


 nueva página del texto (beta)
 Inglés (pdf)
 Artículo en XML
 Referencias del artículo
 Enviar artículo por email
 Citado por SciELO
  Similares en
SciELO
Similares en
SciELO 
 Permalink
One thing's sure and nothing's surer.
The rich get richer and the poor get -children.
In the meantime, In between time-.
Scott Fitzgerald
The Great Gatsby
1. Introduction
The Mexican labor market -up to 2019- improved in terms of the reduction of unemployment and informality rates since the Great Recession (GR) of 2009. Nevertheless, the working and living conditions of an important and growing part of the occupied population have significantly deteriorated at a rather fast pace. Between 2005Q1 and 2019Q4, the proportion of occupied individuals that, for reasons beyond their control, has either extremely long or short workdays with little remuneration (Rate of Critical Conditions of Occupation, RCCO),1 went from 15.06 to 18.80% of the employed population, while the segment that earns one minimum wage in relation to the one that earns more than five (Minimum Wage Ratio, MWR) increased from 1.44 to 2.52 times.
According to De Oliveira (2006), labor precariousness is a multidimensional concept that involves much more than perceiving low remuneration and having exceedingly short or long workdays. We supplement this definition by considering additional dimensions: no written contract, no benefits,2 no social security,3 and different forms of labor flexibility.
Although investment in human capital4 reflects a choice out of a number of limited alternatives, it is necessary to consider that people with the lowest socioeconomic status have greater difficulties to choose, due to the existence of a trade-off between the early urgency to generate income for the household and the desire to stay in school. This part of the population is prone to having an early entry into the labor market, which commonly makes them occupy themselves in minor quality jobs for a low remuneration. This will hardly lead to a successful professional future.
The first job is crucially involved in this situation, regarding its conse quences and its impact on the (future) work trajectory. For this sector of the population, in the most fortunate segments, socioeconomic and geographical conditions of origin (residence), and the parents' educational attainment -which are, of course, factors completely beyond the individuals' control- as well as the type of labor insertion (first-job conditions) will have strong impli cations on workers' professional development.
This hypothesis was first raised by Krueger (2012). Since then, literature refers to it as The Great Gatsby Curve (GGC), which associates a person's ini tial conditions of inequality, and their future possibilities of moving upwards along the socioeconomic ladder in the labor market scale in comparison to their parents (intergenerational social mobility).
In order to empirically (econometrically) prove the impact of these factors on labor precariousness, we use the Social Mobility Survey conducted in Mexico 2017 (SMS, henceforth) (CEEY, 2019a), which builds a wide, solid database that reveal interviewees' circumstances in terms of their parents' educational attainment, their work trajectory, the geographic region of residence, and their parents' conditions of poverty. The SMS is representative and, therefore, suitable for our analysis at the national level for both men and women, 25-65 years of age, because it contains retrospective information about the socioeconomic situation of two generations, and has one section dedicated to the work trajectory, which also shows the dynamic effects of the first job and the working conditions.
Through a logit model, we empirically prove that sex, region of residence, the father's education level, the working conditions of the first job, and the socioeconomic status of the household of origin (poverty) impact the prob ability of having a precarious job. Particularly, we prove that it is the first job (in precarious conditions), followed by the father's educational attainment, which mostly augments the probability of remaining in such a condition.
These results go hand in hand with the GGC hypothesis and are rather relevant since the insertion in the labor market through a precarious job implies a set of conditions that represent a disadvantage to their future. This condition restrains both income and access to social security to face contingencies and economic crises, which may also predispose families to fall into poverty or to remain in it.
The structure of this document is as follows. In the next section, we review the literature around GGC and labor precariousness. To enrich this concept, we employ the next crucial dimensions: access to social security and health services, type of job contract, benefits, workday, and income (RCCO and MWR), as well as labor flexibility. In the third section, we analyze the stylized facts that reveal that Mexican labor market moves rapidly into precariousness. The fourth section deals with the econometric issues (logit model). In section five, we discuss the main results concerning our hypothesis. Finally, in section six, we highlight the main conclusions and make further comments.
2. Literature review
The GGC originally estimates the probability of intergenerational transmission of an individual's socioeconomic situation to their descendants (this probability is known in literature as social mobility). Inequality (in terms of income, education, and, in general, initial opportunities) plays a central, though not decisive, role in the dynamics of this phenomenon. The GGC claims the existence of a direct relationship between the inequality of opportunities and the difficulty of experiencing socioeconomic improvement. Overcoming this condition demands extraordinary relative efforts from the least fortunate groups in order to leave margination and poverty.
This was precisely what Krueger (2012) proved for the United States and for a group of twelve developed countries. Despite the lack of an explanation around the transmission mechanism, the author's contribution became relevant and triggered a series of empirical studies that attempted to contrast his results.
Corak (2013) sustained the hypothesis through a cross-section for a group of twenty-two countries. Bishop et al. (2014) proved it for a larger sample of countries; however, although they obtained statistically significant results, their adjustment was qualified as "poor". Jerrim and Macmillan (2015) used data from twenty-three countries that are members of the Organization for Economic Cooperation and Development (OECD) and concluded that education is the main channel in the relationship between intergenerational mobility and inequality.
Brahim and McLeod (2016) corroborated the existence of the curve for Latin American countries. The authors asserted that the explanation of the decreasing tendency of inequality in most countries can be found in the improvement of the population's living conditions and the raise of social mobi lity among generations. By a random-effects regression for panel data, they demonstrated that this outcome resulted from the concentration of public spending in education, and the subsequent enhancing of coverage that benefited the most vulnerable households, despite the evident delay in educational quality.5
Staley and Yanoletzky (2016) proved the GGC hypothesis for twenty-seven countries (both developed and developing) and found a statistically significant correlation. They concluded that children who grew in unequal societies in 1981 were less prone to experiencing ascending mobility by 2018.
Based on information from a heterogeneous group of thirty countries, we estimate the curve for 2018 (see Figure 1). It demonstrates the clear existence of a negative relationship between inequality-measured by the Gini Coefficient-and intergenerational mobility of income, in which the latter shows the probability of inheriting the socioeconomic results from the previous generation (parents).6
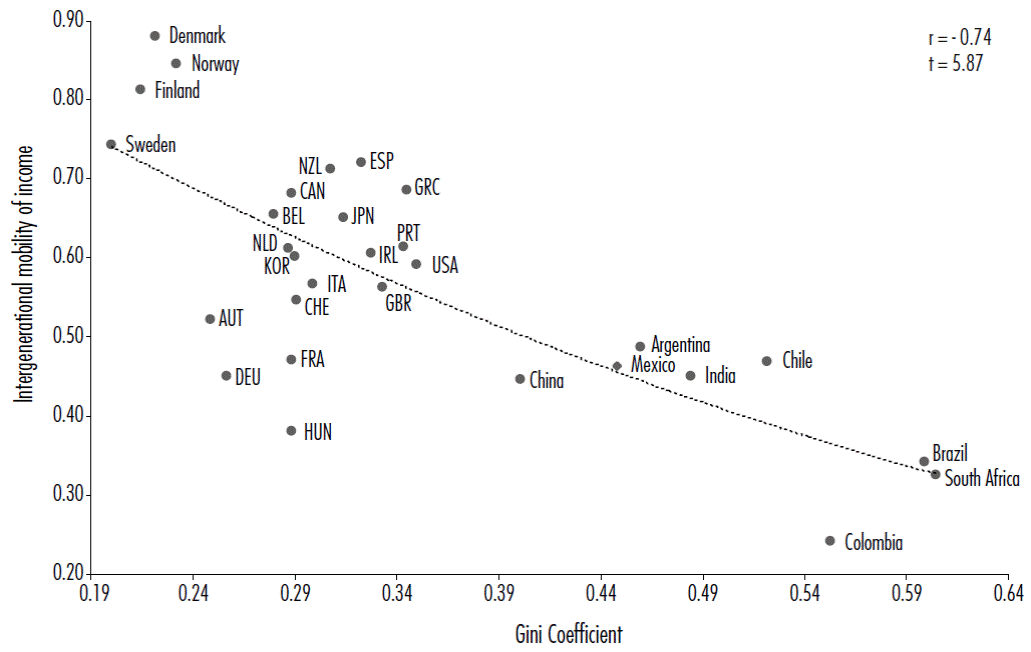
Note: NZL: New Zealand, ESP: Spain, CAN: Canada, GRC: Greece, BEL: Belgium, JPN: Japan, NLD: Netherlands, IRL: Ireland, PRT: Portugal, KOR: South Korea, USA: United States, ITA: Italy, GBR: Great Britain, CHE: Switzerland, AUT: Austria, FRA: France, DEU: Germany, and HUN: Hungary. Source: own calculations with data from OECD (2018), Solt (2019); for Mexico from CEEY (2019a).
Figure 1 The Great Gatsby Curve for thirty countries, 2018
It is still necessary to address the mechanism that rules the relationship. There is an ongoing discussion that focuses on the importance of the level of household income and the human capital investment as well as their effects on inequality and the intergenerational socioeconomic transmission. The quality of prenatal care that impacts considerably the cognitive skills (Becker, 2011), the investment in education and human capital (Garner and Raudenbush, 1991), the differences in academic skills (Marks, 2014) and future aspirations (Sikora and Saha, 2007), are some of the ways in which GGC reflects "the outcome of a whole host of ways that inequality of incomes affects children" (Corak, 2013, p. 13). This author claims that inequality reduces social mobility because it determines the opportunities and incentives that, at the same time, are associated to the institutional order and the degree of socioeconomic development in which individuals grow.
Atkinson (2015, p. 11) states that it is important to differentiate inequality of outcome (ex-post) from inequality of opportunities (ex-ante). The former refers to income inequality (commonly measured with the Gini Coefficient) which configures the future conditions of inequality, so that "the beneficiaries of inequality of outcome today can transmit an unfair advantage to their children tomorrow". In contrast, inequality of opportunities relates to the concerns around the individuals' having the same starting point. Roemer (2002) gave the name of "circumstances" to all those factors that are beyond people's control and that have a relevant impact on their fates. When inequality exists in the previous generation, it determines the inequality of opportunities for the next one.
In this sense, it is plausible to consider that, in a society where there is equality of opportunities, the weight of the circumstances is minimum (Corak, 2013; Ferreira and Peragine, 2015). Therefore, it would be acceptable to think of a more or less homogeneous equality of outcome (both economic and social), which would be reflected in levels and trajectories related to per capita Gross Domestic Product (GDP) growth (Aiyar and Ebeke, 2019).
In this sense, it seems unquestionable that the structure (characteristics) of the labor market plays a central role inasmuch as it can perpetuate or modify the socioeconomic conditions of origin. The labor market is the main mechanism of income and life opportunities for most of the population since it determines consumption alternatives and, in consequence, living conditions for the present and the future.
According to Gallie and Paugam (2003), and Bayón (2006) labor market precariousness is a multidimensional concept which involves, simultaneously and bidirectionally, life and work circumstances and refers to the working conditions (in terms of quality and remuneration) and their effects on satisfac tion and life prospects.
Bayón (2006) analyzed labor precariousness in Argentina and Mexico and argued that, due to the long-lasting macroeconomic crisis of the 1980s (the Lost Decade), the labor market got worse in both countries during the 1990s. Nevertheless, deterioration adopted different characteristics in each country. While unemployment increased in Argentina, in Mexico the effects resulted in a combination of a relatively low unemployment rate -in relation to other countries- along with a strong wage reduction and growth of the informal sector.
Guadarrama et al. (2012) pointed out that Mexico has an extensively heterogeneous labor market. They noted that this characteristic is reflected in the increased job insecurity, lack of social protection, and low remunerations, which exposes the population to rather limited and vulnerable living conditions. The authors agree with Bayón (2006) in that in Mexico, the main problem is labor precariousness rather than unemployment.
In addition to the expansion of the concept of labor precariousness, Solís (2016) associated it to the raise in the proportion of salaried workers who, without a written contract or with temporal contracts, lack such benefits as health services, paid holidays, or bonus, and receive low wages. He stated that precarious job conditions are typical of self-employed activities with low productivity and remuneration.
De Oliveira (2006, p. 40) stated that labor precariousness can be analyzed through three dimensions: a) the economic dimension, which is related to job availability and adequate income; b) the normative dimension, which refers to the promotion of workers' rights; and c) the labor-security dimension, which implies social protection.
Considering these ideas, we can conceptually enrich labor precariousness by encompassing a series of characteristics that constitute a wider set that ultimately integrates five dimensions: a) working conditions related to either extremely short or long workdays with low remunerations (RCCO), b) an increase in the number of individuals who earn one minimum wage relative (MWR) to those who earn more than five, c) lack of labor rights, such as social security and benefits, d) atypical forms of hiring (reflected in inexistent or slight presence of written contracts), and e) different forms of flexibility.
The structure of the labor market plays a central role since it can perpetuate or modify the socioeconomic conditions of origin, as well as reconfigure a poverty trap. Summing up, the hypothesis of the GGC can be synthesized and visualized through the transmission mechanisms that, in addition, might configure a poverty trap (see Figure 2).

All of the above makes labor precariousness a complex phenomenon that requires a multidimensional analysis, which is precisely how we address it, and which constitutes one of the contributions of this paper.
3. Stylized facts
Mexican labor market
The conceptualization of labor precariousness in the referred terms makes it difficult to measure. The National Survey of Occupation and Employment (ENOE, by its acronym in Spanish) -whose starting dates come since 2005Q1- presents the series of RCCO and MWR, as the indicators to analyze the phenomenon and provides the first approximation of its evolution, but it is necessary to complement it and enrich it with other indicators.
As in all economic crises, labor markets are the first ones to be directly affected. Then, it is upon them that the recovery falls -as well as the modality it will have onwards. Unemployment, flexibilization (in all its forms), and labor precariousness are, therefore, reconfigured in each economic cycle.
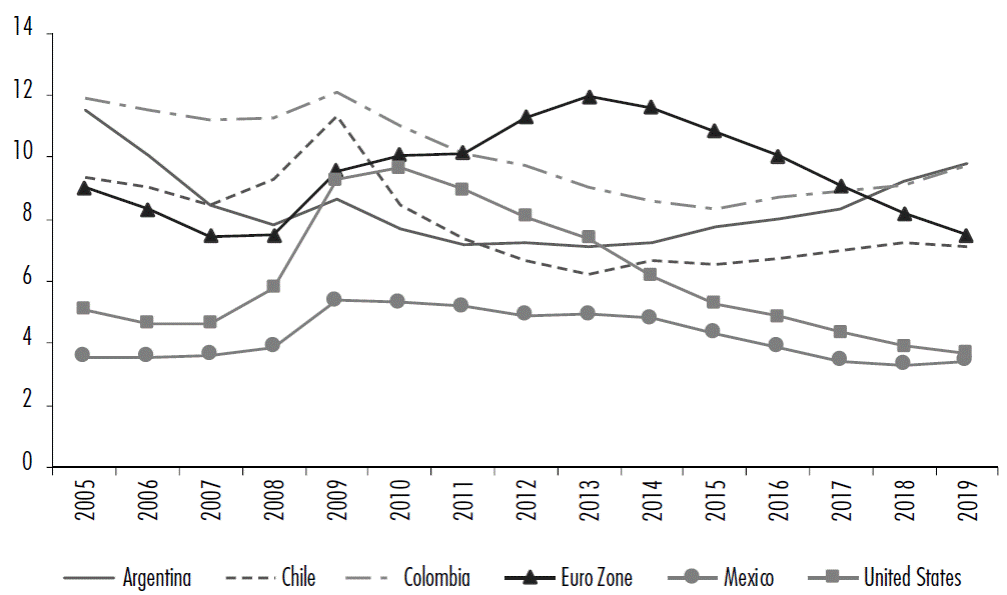
The 2009 gr has affected and delimited many structural features of the Mexican economy ever since. One of them was the labor market. Despite the great impact that it had on economic growth (-4.7% in 2009) and on unemployment rate (5.5%),7 occupation recovered gradually and, until 2019, Mexican labor market did not represent a serious unemployment problem, compared to other OECD and Latin American countries (see Figure 3).
Source: own calculations with data of the World Bank (2020).
Figure 3 Unemployment rate in several countries, 2005-2019
Nonetheless, and derived from the gr, the percentage of people whose escape route used to be informality, increased along with RCCO (see Figure 4). It draws attention that, while informality and unemployment rates grew quickly, RCCO started growing fast after 2014Q2, when the other two variables -to a greater degree, informality- reduced notoriously and secularly (see Figure 4).
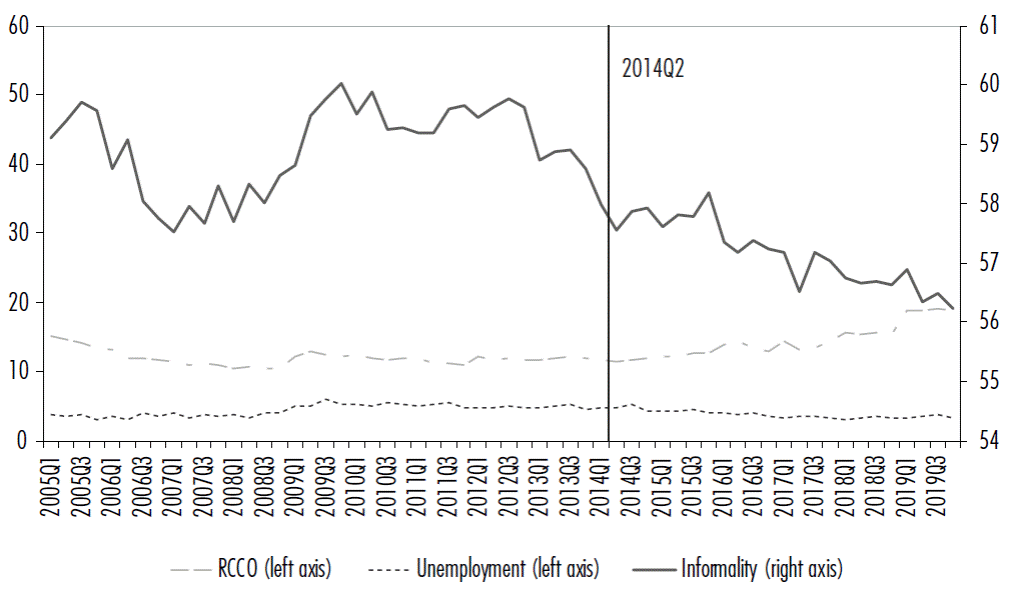
Source: own calculations with data from INEGI (2019).
Figure 4 Mexico: Informality, critical labor conditions, and unemployment rates, 2005Q1 - 2019Q4
According to Loría and Salas (2019), by the enforcement of what they call the third wave of economic reforms between 2012 and 2015 (the Labor Reform amongst them), the federal government attempted to reduce informality in order to raise labor and total factor productivity to enhance economic growth. After the implementation of this reform, since 2014Q2 the creation of formal jobs augmented rapidly, which allowed more people to get access to social security. As presented by these authors, the price that the employed individuals paid for formalization was the worsening of employment conditions to the detriment of productivity, wages, and working hours. Simultaneously, the structure of remunerations polarized due to the rapid growth of MWR (see Figure 5).8

Source: own calculations with data from INEGI (2020b).
Figure 5 Minimum Wage Ratio (MWR) one to five, 2005Q1-2019Q4
It is convenient to analyze the relationship between RCCO and MWR for the entire period and subperiods. It is important to say that we did not find any statistical precedence between them,9 which suggests that both variables are a consequence of others. In Table 1, we prove the high and significant correlation in the first difference for the whole period but particularly for the third subperiod, which strengthens the hypothesis that labor precariousness, as measured with these two variables, has intensified.
Table 1 MWR-RCCO (Partial Correlation), 2005Q1 -2019Q4
| Period | Levels | First difference |
| 2005Q1-2019Q4 | 0.90 (16.10) | 0.76 (8.87) |
| 2005Q1-2014Q1 | 0.19 (1.14)* | 0.39 (2.49) |
| 2014Q2-2019Q4 | 0.98 (24.05) | 0.88 (8.70) |
Note: in parenthesis /-statistic. All coefficients are 99% significant; The break in 2014Q1 responds to the previous analysis about the raise of RCCO and MWR; * Non-significant.
Source: own calculations with data from INEGI (2020b).
To elaborate on our concept of labor precariousness, we analyze the total population's lack of social security trajectory.10 Figure 6 highlights that, although the percentage of the population that suffers from deprivations has diminished, more than a half still suffers from social security issues, this type of deprivation being the most common among Mexican population.

Source: own calculations with data from CONEVAL (2019b).
Figure 6 Population by type of deprivation, 2008-2018 (% of the total population)
The labor reform of November 2012 succeeded in reducing informality, and in raising the Female Participation Rate (FPR). Nevertheless, this seems to be associated with the upturn of RCCO, particularly for men11 (see Figure 7).
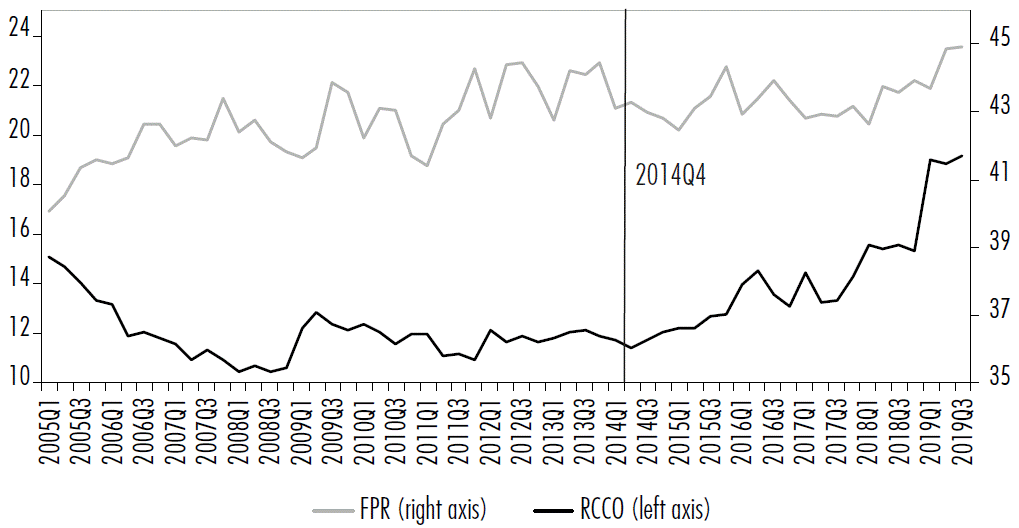
Note: seasonally adjusted series. Source: own calculations with data from INEGI (2020b).
Figure 7 Rate of Critical Conditions of Occupation and Female Participation Rate, 2005Q1-2019Q4
It is important to highlight one special feature of the Mexican economy: a very brief duration of unemployment. About 80% of the unemployed population gets a job in less than three months, and only 5% falls into a category of long-term unemployment (INEGI, 2020b). Tis responds to the lack of waiting conditions (unemployment insurance), which compels the unemployed population to occupy themselves quickly, most commonly in low-quality activities or with little remuneration. This reinforces labor precariousness and may as well be the factor related to the augment in the participation rate of other family members who will work in similar or even worse conditions, which, in the end, might impact the children's future work trajectories.
Related to the fourth factor of labor precariousness, Contreras (2000) pointed out that labor flexibility implies "atypical forms of employment" such as: eventual, partial, and at home (usually outsourcing) work, among others which affect working hours and wages. In Figure 8, we see that a form of labor flexibility can be approximated through the eventual and permanent hiring in proportion to the total. Eventual contracts started gaining ground by the end of the 1990s and kept accelerating until 2012 when they stabilized.
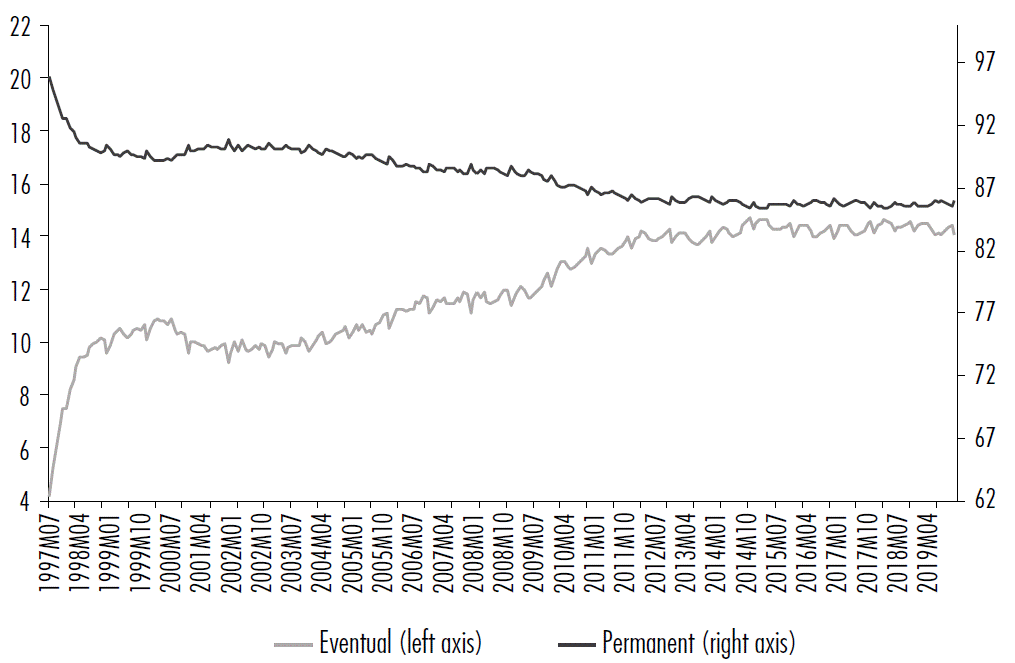
Note: percentage in proportion to the total amount of workers insured with IMSS. Source: INEGI (2019).
Figure 8 Eventual and permanent workers, 1997M07-2019M12
After considering the outsourcing modality12 as a recent and additional factor of labor flexibility, precarious employment acquires further clarification. The labor reform of 2012 (Loría and Salas, 2019, p. 76) legalized this type of hiring although it had already existed. We see the accelerated growth of this variable in Mexico, while there were about 1.3 million people under this hiring condition in 2004, by 2014 (last available figure) the number reached 3.5 million (INEGI, 2020c). It is important to mention that this fast-paced growth has also impacted the composition of the labor market since outsourcing went from 8.6 to 16.6% for the same period (INEGI, 2020c).
Labor precariousness and conditions of origin
The conditions of origin of the most underprivileged socioeconomic groups affect labor precariousness (intertemporally) and can be understood in the context of the GGC. In this sense, the difficulty to overcome poverty from one generation to the next relies upon and feeds back to the limited investment in human capital. In the case of Mexico, the Espinosa-Yglesias Research Center (CEEY, 2019b) states that 49% of individuals born in the poorest income quintile stays there, and the other 51% manages to ascend. Nevertheless, 25% fail to overcome their condition of poverty.
It is noticeable that despite the multiple economic crises that the country has undergone since 1976, the trajectory of inequality -measured by the Gini Coefficient- has descended as can be seen in Figure 9.13 All in all, 74% of those born at the bottom of the socioeconomic ladder remain below the poverty line (see Figure 10).


Another factor of origin that impacts precarious temporal persistency is the productive structure-which ultimately responds to development (structurai) conditions-and the corresponding types of labor demand in the distinct regions of the country. In this sense the SMS classifies Mexico in five extensive regions,14 as shown in Table 2.
Table 2 Regionalization by CEEY (2019a)
| Region | States |
| North | Baja California, Sonora, Chihuahua, Coahuila, Nuevo León and Tamaulipas. |
| North-West | Baja California Sur, Sinaloa, Nayarit, Durango and Zacatecas. |
| Center-North | Jalisco, Aguascalientes, Colima, Michoacán and San Luis Potosí. |
| Center | Guanajuato, Querétaro, Hidalgo, State of Mexico, Mexico City, Morelos, Tlaxcala and Puebla. |
| South | Guerrero, Oaxaca, Chiapas, Veracruz, Tabasco, Campeche, Yucatán and Quintana Roo. |
Source: CEEY (2019b).
Figure 11 shows that the country's precarious jobs15 concentrate in the Central16 and Southern regions.17
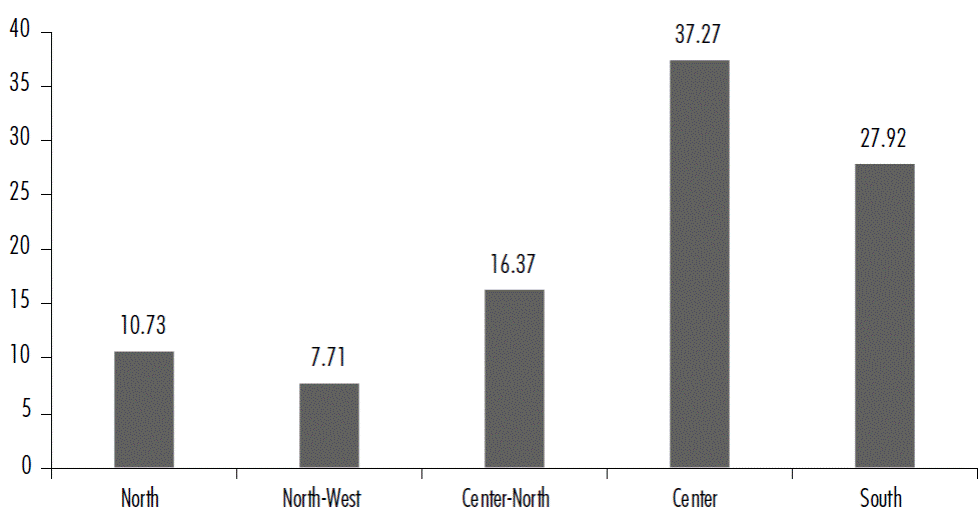
Source: own calculations with data from CEEY (2019a).
Figure 11 Precarious jobs by region, 2017 (% of the occupied population)
Finally, Figure 12 shows precarious workers' educational attainment as well as that of their fathers'. In terms of our objective, it stands out that labor precariousness is focused in the group with the least access to education ("less than primary school"). Starting from middle school, the relationship between the father's educational attainment and the child's is reverted, which demonstrates that the possibility to ascend increases with the level of education attained by the father.
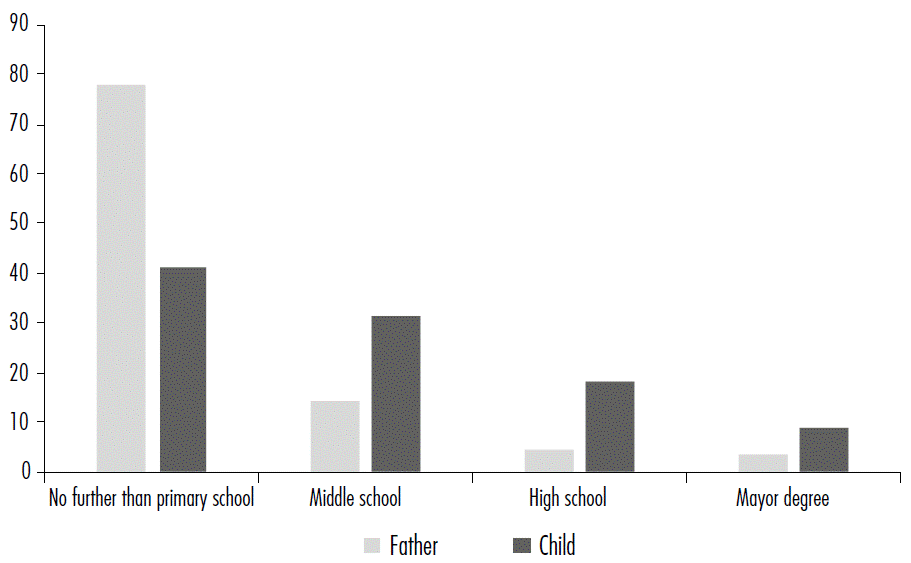
Source: own calculations with data from CEEY (2019a).
Figure 12 Labor precariousness by educational achievement, 2017 (percentage of the precarious population)
4. Econometric issues
Hosmer and Lemeshow (2000), and Cameron and Trivedi (2005) declared that a logistic regression is an econometric technique used to predict the outcome of a categorical variable based on independent or predictive variables. The probabilities describing the possible outcome of a single trial are modeled as a function of explanatory variables, using a logistic function. Logit models identify the individual's belonging to one of two possible categories. The logistic regression analyzes binomially distributed data in the form:
Where the number of Bernoulli trials and the probabilities of success p i are not known.
The model is, then, obtained based on what each trial (value of i) and the set of explanatory/independent variables can report about the final probability. These explanatory variables can be thought of as a k-dimensional X i vector. The model, then, takes the form:
The logit of the unknown binomial probabilities (i.e. the logarithms of the odds ratio) are modeled as a linear function of X i :
With the above, the logistic cumulative distribution function is obtained:
Where Δ(χ'β) is the logistic cumulative distribution function, with
In summary:
The calculation of the marginal effects (the effect of the k-th explanatory variable, keeping the remainder constant) is solved as follows:
Based on this econometric methodology, it is plausible to prove our central hypothesis empirically with data from the SMS because of its national statistical representativity for men and women (head of household), 25-64 years of age from urban and non-urban areas, and because it was designed to analyze intergenerational mobility. The SMS counts with retrospective information about the respondents, revealing their situation when they were 14 years old, their current status, and their parents' educational, economic, and occupational context (CEEY, 2019c).
We chose the 2017 SMS because, as we have previously discussed, labor precariousness has accentuated since 2014Q2, and the results of the survey reveal the consequences of labor deterioration. Also, compared to the previous surveys of 2006 and 2011, the 2017 one allows for a more in-depth reflection on the labor market and its heterogeneity, as it incorporates regional information.18 With these data, we estimate a logit model that encompasses gender, the father's educational attainment, the region of residence, the precarious first job, and the socioeconomic status of the household of origin (poor).19 The model uses "1" and "0" depending on whether the workers are precarious or not. The description of the independent variables is in Table 3.
Table 3 Variable description
| Variable | Codification and description |
| Poor | 0 = Population of the quintiles 2-5 |
| 1 = Population of quintile 120 | |
| Gender | 0 = Woman |
| 1 = Man | |
| Region | 0 = North |
| 1 = North-West | |
| 2 = Center-North | |
| 3 = Center | |
| 4 = South | |
| Father's schooling | 0 = No schooling |
| 1 = Primary school | |
| 2 = Middle school | |
| 3 = High school | |
| 4 = Mayor degree | |
| Precarious first job | 0 = Precarious |
| 1 = Not precarious |
Source: own elaboration.
Marginal effects (see Table 4) allow us to directly analyze the increment in the probability of being a precarious worker re
Table 4 Marginal effects on labor precariousness
|
|
Std. Err. | |
| Poor | 0.33* | 0.06 |
| Gender | -0.18* | 0.04 |
| Region | ||
| North-West | 0.15* | 0.06 |
| Center-North | 0.11* | 0.05 |
| Center | 0.17* | 0.05 |
| South | 0.31* | 0.06 |
| Father's schooling | ||
| Primary school | -0.19* | 0.05 |
| Middle school | -0.26* | 0.05 |
| High school | -0.36* | 0.05 |
| Mayor degree | -0.37* | 0.05 |
| Precarious First Job | 0.65* | 0.04 |
Note: Number of observations: 1 222, Pseudo R2 = 0.42%, Prob. > Chi2 = 0.00. Goodness-of-fit Stukel (1988) test: Prob. > Chi2 = 0.36. The overall rate of correct classification is estimated to be 81.91°%. The HAC weighting matrix (Newey and West, 1 987) was used to obtain robust standard errors free of heteroskedasticity; * Significant at 5°% confidence.
Source: own calculations with data from CEEY (2019a).
It is noteworthy that the largest marginal effects that positively influence the probability of being a precarious worker correspond to the precariousness of the first job and the situation of poverty in the household since both variables denote the influence of inequality of opportunities in job achievement.
In addition, the regional component plays a relevant role in the probability of working in precarious conditions, given that positive marginal effects are reported in all regions. Nevertheless, the South and Central regions report the highest marginal effects in relation to the rest of them. It is noted that the marginal effect of the South region doubles the one reported for the CenterNorth and North-West regions.
It can be seen that gender has a significant influence since women are more likely to work in precarious conditions compared to men. In addition, the academic achievement of the father, throughout all levels, is negatively related to the precarious status of the child. However, the higher the educational achievement of the father, the lower the probability of precariousness for the child.
When analyzing how these characteristics interact with each other (see Table 5), we observe that the probability of working in precarious conditions worsens when living in the Southern region (78.2% probability), whereas poverty condition and the precarious status of the first job increase the probability at 90.0 and 94.6%, respectively. On the other hand, living in a Central region confers a probability of precariousness of 70.3%, which is aggravated when interacting with other characteristics, such as the situation of poverty (85.6%) and the precariousness of the first job (91.1%).
Table 5 Estimation of the probability of labor precariousness (%, selected features)
| North-West | Center-North | |||||||
| 69.1 | 65.7 | |||||||
| Poor | Non-Poor | Poor | Non-Poor | |||||
| 84.9 | 64.3 | 82.8 | 60.3 | |||||
| PFJ | NPFJ | PFJ | NPFJ | PFJ | NPFJ | PFJ | NPFJ | |
| 90.5 | 38.3 | 70.3 | 13.2 | 88.6 | 33.8 | 66.1 | 11.0 | |
| Center | South | |||||||
| 70.3 | 78.2 | |||||||
| Poor | Non-Poor | Poor | Non-Poor | |||||
| 85.6 | 65.6 | 90.0 | 74.8 | |||||
| PFJ | NPFJ | PFJ | NPFJ | PFJ | NPFJ | PFJ | NPFJ | |
| 91.1 | 39.9 | 71.7 | 14.0 | 94.6 | 52.8 | 81.1 | 22.0 | |
Note: all probabilities are significant at 5 % confidence; Since the conditional probabilities are analyzed on different characteristics, their sum does not necessarily have to be equal to 100°%; PFJ: Precarious First Job; NPFJ: Non-Precarious First Job.
Source: own calculations with data from CEEY (2019a).
5. Discussion
1) In agreement with our hypothesis, we find that coming from a poor household influences strongly and positively the possibility of becoming a precarious worker. As established by the GGC, inequality restricts the possibility of overcoming poverty (Torche, 2010; CEEY, 2019b). It is the fourth variable in importance, only behind the precariousness of the first job and the father's educational achievement (superior and professional education).
2) The results demonstrate that being a woman increases the chances of labor precariousness. This is explained by the dimensions of labor precarious-ness that register the occupations in which women enroll most frequently: self-employed (informal) activities. This is proved by seeing that, for all the historical series (since 2005Q1), the female informality rate has been systematically higher than the male one. In 2019Q4, the former was of 57.6% against the latter of 55.3% (INEGI, 2020b).
3) We observe that precarious employment is accentuated in the Southern region since its probability doubles that of the rest of the country. According to Loria et al. (2020), the Southern states display a stressed structural homogeneity, and are characterized by their poor institutional, economic, and social performance. The authors report that, in this region, the labor market does not respond to economic growth (as suggested by Okun's Law, 1962), and its RCCO average is six percentage points higher than the national standard (12.32%).20 Central region reports the second largest marginal effect. This is a consequence of its heterogeneity. Furthermore, the regional findings are in line with CEEY (2019b): in the South and Central regions, the options to experience upward social mobility are much lower than in the rest of the regions (CEEY, 2019b, p. 42).
4) According to GGC, one of the most relevant results is that the father's educational attainment has a significant (and increasing) effect on the children's work trajectory and influences their probability of becoming precarious workers.
5) Finally, the precariousness of the first job has the greatest impact in the Mexican work trajectory because it reports the highest marginal effect of the entire model (0.65). According to CEEY (2019b), schooling and socioeconomic level determine the possibilities of social mobility and the condition of the first job and the achievements in the labor market, so that the first job plays a relevant role in the occupational trajectories (Llamosas and Rangel, 2019).
6) The econometric findings show the importance of the factors that influence inequality of opportunities. Table 5 highlights characteristics of origin such as the region, poverty conditions of the household, the precarious-ness of the first job, and how the probability of precariousness in the current job increases when these characteristics are analyzed together. Thus, as shown in figure 2, the structure of the labor market plays a central role for it can perpetuate or modify the socioeconomic conditions of origin and inequality of opportunities, as well as reconfigure a poverty trap.
6. Conclusion and further comments
Labor market represents an essential element in the occupied population's life, because it determines their income and, therefore, defines their possibilities and decisions regarding consumption, savings, and retirement for present and future generations.
At first sight, up to 2019, we can suggest that the conditions of the Mexican labor market have improved since unemployment and informality remained at historically low levels. Nevertheless, the working conditions (quality) of a significant part of the occupied population have deteriorated considerably -as reflected in the levels of labor precariousness expressed by RCCO and MWR- which can be associated to the negative effects of the Great Recession of 2009 and the Labor Reform of 2012.
As an additional contribution of this paper, we assert that labor precariousness is a multidimensional concept that implies much more than only perceiving low remunerations and working extremely long or short working hours. A wider conceptualization, like the one we propose, must add the following dimensions: no written contracts, no benefits, no social security, and flexibility of the labor market.
The objective of this document is to demonstrate that being a precarious worker is determined by initial conditions upon which individuals cannot exert any control. At the same time, labor precariousness presents an explanation for social mobility, as there are circumstances that allow for a rise along the socioeconomic ladder while others make it difficult. This analysis offers an explanation for the transmission mechanism behind the hypothesis of The Great Gatsby Curve by Krueger (2012), because we have demonstrated, based on the data from SMS, that household poverty and the father's education are associated to the probability of the children's becoming precarious workers. Consequently, experiencing social mobility from one generation to another becomes a difficult task, while a precarious work trajectory persists. We also find that additional indicators like the region of residence, gender, the socioeconomic status of the household of origin (poverty), and the precarious first job are statistically significant, thus providing high economic sense and meaning.
It is the precarious first job, poverty and region, specifically, which mostly increases the probability of working in precarious conditions, and which most strongly impacts the future work trajectory. Furthermore, when these characteristics interact with each other, we find that the probability of getting a precarious job worsens, which reflects how relevant inequality of opportunities is for the labor trajectory.
Another important factor is the father's education, which plays a decisive role in the children's investment in human capital. This represents a substantial piece of evidence that, at least in Mexico, conditions of origin affect the trajectory of people's lives and work.
When Deaton (2013) and Atkinson (2015) deal with wellbeing, escape from poverty, and inequality reduction, they do not attribute solutions exclusively to the economic sphere. Access to social security, benefits, and decent labor conditions also play an important role because they reduce people's vulnerability in the face of economic crashes.
In this sense -and related to the two previous economic crises, the dot com crisis, and the Great Recession of 2009- the Mexican crisis of 1995 further increased poverty (particularly food poverty). As a result of this impact, it took six years to return to the previous levels. GDP decreased by 6.8% in 1995, and food poverty augmented 72% after going from 22 to 38% of the total population.
The ongoing crisis (engendered by the SARS-CoV-2 pandemic) is impacting every sector of the economic activity and is generating employment and wage losses (permanent). The consequences that it carries will represent the greatest challenge for all the different branches of human knowledge, and not only for social sciences and economics. It is evident that this pandemic will have enormous effects on inequality, labor precariousness, and, consequently, on poverty all around the world. Once again, labor markets will be the means through which these effects and consequences will be transferred or diluted and will lay the foundations for the eventual recovery.
Most probably, the starting decade will be recognized for the yet unseen increments in poverty, inequality, and labor precariousness, which in turn will hamper growth in the long run. Thus, these will be (or at least should be) the crucial themes to determine the academic agenda of research and politics all around the world.

