


 nueva página del texto (beta)
 Inglés (pdf)
 Artículo en XML
 Referencias del artículo
 Enviar artículo por email
 Citado por SciELO
  Similares en
SciELO
Similares en
SciELO 
 Permalink
1. Introduction
The multidimensional approach to the poverty measurement broadens the widely used income-centred definitions as it is based on the direct evaluation of deprivation in a range of dimensions. Latin American countries pioneered in the use of the multidimensional approach, with experiences dating back to the 1980s; however, mostly monetary based indicators were regularly produced during the last three decades.
Recently, there has been a renewed interest in developing and applying multidimensional measures (MDM) in the region. Several Latin American countries have begun to create official MDMS during the last ten years, in many occasions assisted by OPHI (The Oxford Poverty and Human Develop ment Initiative). Notwithstanding the production of such MDMS in Latin America, they face challenges, especially related to the selection of dimen sions and variables/indicators.
This article presents the first results of a research project aimed at contributing to the design of a multidimensional poverty measure that could be regularly produced in different Latin American countries, based on public information drawn from existing official household surveys. The paper is oriented to one main aspect of the measurement process: the selection of the dimensions for which deprivation would be evaluated. It is important to emphasize the limitation that such objective faces, as a result of resting on data from statistical sources that have not been specifically designed for measuring MD poverty. To discuss this, alternative estimations for Argentina employing two available household surveys have been carried out, using some methodological criteria that give evidence on how appropriate the used variables are. It must be pointed out that it is only an exercise aimed at highlighting the challenges facing the development of a MDM in general and, particularly, when only existing data could be used. Consequently, the results in terms of poverty incidence are only included to show its sensibility to changes in the items considered.
The article has the following structure. Next section points out the steps that, in principle, any process of MD poverty measurement should take, regardless of the theoretical and methodological aspects of the specific approach. Section 3 includes a very brief review of the main approaches that can be identified in literature and that have resulted in empirical methodologies and actual measures. The following heading describes, also in broad terms, the principal multidimensional poverty measurements carried out for Latin American countries. Section 5 describes the methodological approach and discuss the results obtained for Argentina based on two different data sources. The final section presents some remarks about the feasibility of our initial objective and about potential future activities required to develop a MD poverty measure for the region.
2. Basic features of a multidimensional poverty measure
The notion of poverty being a phenomenon associated to deprivation in multiple dimensions is widely accepted (Spicker, 1999). However, this un derstanding does not necessarily translate into measures that can be considered as multidimensional. Any poverty measure needs to address two basic methodological questions: identification (i.e. which units are to be considered poor) and aggregation (combination of data into an indicator of poverty). Regarding the formes, it is necessary to agree on:
i) Dimensions: which are the relevant basic aspects (needs, capabilities, rights) that households persons should satisfy to be considered no poor.
ii) Indicators: relevant observable variables that should account for the satisfaction (or not) of the diverse dimensions.
iii) Thresholds: the values of each indicator denoting deprivation.
iv) Combination of dimensions: the number, or proportion, of dimensions and/or indicators with deprivation required for a person household to be considered poor.
The identification of the relevant dimensions for a poverty measure should, ideally, be based on a conceptual frame such as the capability approach, Townsends' definition of relative poverty, rights recognized by law and/or international consensus. However, the sets of dimensions considered in many MDM are not always clearly based on theoretical considerations. Instead, the availability of information frequently limits the selection process (Feres and Mancero, 2001).
Once the relevant dimensions have been identified, the following step is to find one indicator that accurately indicates if the household/person is, or is not, deprived in each dimension. This means that the variable or indicator should denote a clear manifestation of the phenomenon is intend to measure. Availability of information and comparative aims (cross country, regional or inter-temporal) should play a significant role in the selection of indicators.
For the determination of thresholds, three main approaches -related to those used for the selection of dimensions- have been considered. Traditionally, the discussion was about the possibility of establishing absolute or relative thresholds. A radical version of the first position would affirm that there are needs and thresholds that hold for every society at any time. Conversely, the extreme relative approach would say that the needs and thresholds are social products and thus completely determined within each society at different moments of history. As a result, the situation of poverty should exclusively be determined while considering the situation of other members of the society (Townsend, 1979). At some point between both, poverty could be considered an absolute phenomenon (and consequently measured independently of the situation of other members of society) but not independent of the society and historical time the individual lives in. A third approach is the consensual perspective, according to which the definition of the relevant needs and thresholds is based on the views of the population regarding whether a given item should be considered necessary (Guio et al., 2016). An important feature to be noted is that the critical levels of satisfaction should be overall available for the society under study (if set too high -or too low- they would be analytically useless) (Kaztman, 1995).
Finally, once deprivation is identified a criterion should be established to determine if the person household is to be considered poor. Specifically, how many dimensions or indicators are required to identify a unit as poor. The most usual is the union method that considers just one of them. This approach is too inclusive and might overestimate poverty, although setting very low thresholds for each dimension should counteract this bias. Another principle sometimes employed is the intersection, which identifies poor individuals households as those who are deprived in all dimensions. Contrary to the first approach, this can understimate poverty constrain, hence yielding low measures. Other alternatives have been proposed, such as setting a given number of indicators different from one, or a weighted proportion of them.
Precisely, a question associated to this issue concerns the weight assigned to each dimension (and indicator) which entails important assumptions regarding substitution among them (Decancq and Lugo, 2008). The indirect (or poverty line) method solves this problem by aggregating dimensions in the value of a consumption bundle and comparing it to the household's income or expenditure. Direct measures that preserve multidimensionality have not solved this issue yet, although in practice different criteria are being adopted.
It must be kept in mind that any decision regarding the weights represents a judgment about the relative contribution of each dimension to poverty, as well as trade off rates between them. The first possibility is to use no weights at all, which has been referred to as the "agnostic" approach, also resulting from lack of information or consensus. This means implicitly assigning equal weights to every indicator. However, if the number of indicators in each dimension is different, the implicit weights of the dimensions will differ. Another option is to use proportions based on a function of the relative frequencies of the dimensions. For example, as proposed by Desai and Shah (1988) and Cerioli and Zani (1990), to assign higher weights to the dimensions that are less frequent in the population. However, Brandolini and D'Alessio (2000) show that the resulting structure could be unbalanced if deprivation in certain aspects differs widely across the society. It was also suggested to base the structure of weights on multivariate techniques, such as factor analysis, principal components or cluster analysis (Brandolini, 2008; Nolan and Whelan, 1996). This could be an interesting way to justify otherwise somewhat arbitrary decisions, but questions have been raised about the convenience of leaving a decision that is fundamentally normative to a mathematical algorithm (Brandolini, 2008).
Beyond the theoretical considerations employed to select the indicators, the weighting system and the thresholds used for the identification of deprivation, a MDM should be methodologically robust. It implies that the measure should prove to: 1) consistently identify the poor households; 2) measure poverty and not another concept; 3) have an adequate number and choice of dimensions. To assess these requirements, different evaluation (tests) should be performed regarding aspect such as validity (the selected dimensions and indicators are correlated with results or causes of poverty) or reliability (how well it measures one common factor).
The issue of the unit of analysis should also be addressed. The household is considered in many of the existing measures, partly because many dimensions (such as housing) are necessarily satisfied at this level and because others (such as nutrition) are culturally also treated as common needs. The use of this unit implies that resources are equally distributed among its members. If this is the choice, it should be noted that all individuals living in households identified as poor will be considered poor. However, there are also experiences resorting to the individual as the preferred unit of analysis.
Regarding aggregation, the incidence indicator is generally employed, although others trying to approach to some idea of intensity were also considered. Alkire and Foster (2011) developed a unified framework for measuring different indicators beyond the head count ratio.
3. Some approaches to multidimensional poverty measurement
Perhaps the first official MDM of poverty was the one implemented in Argentina in 1985 with data from the 1980 population census (INDEC, 1984), which is known as the Unmet Basic Needs (UBN) method. In the following years, many countries of the region replicated the exercise with their censuses (sometimes referred to as "poverty maps").1 It was inspired in a study made by a governmental institution in Chile during the seventies (OPN and IEUC, 1975). The method resorts to five indicators on housing and education and uses the union approach. Even if the idea of "needs" was explicitly considered, the selection of variables and dimensions was restricted by the scope of the census.
During the sixties, Townsend (1979) developed a definition of poverty based on relative deprivation. Specifically, people can be considered poor when they "lack resources to obtain the type of diet, participate in the activities and have the living conditions and amenities which are customary, or at least widely encouraged or approved, in the societies to which they belong". Based on this view, and on the study made by Mack and Lansley (1985), a methodology for measuring MD poverty was developed -the so called "Bristol methodology". One of its main features is the selection of the dimensions and indicators based on the views of the population about their relevance, i.e., they reflect a consensus among the population about what should be considered "the 'necessities' of life" (consensual approach). An initial list of goods, services and activities is prepared based on expert opinion and focus groups and then included in the questionnaire of a survey to appraise the opinion of the population about whether each of those items is necessary. Then, the survey investigates if the respondent has/can do it, or not; in case he/she does not if they cannot afford them. An initial group of items is selected based on the percentage of the population that considered them necessary for an acceptable standard of living (consensual approach). The final selection considers the results of different tests to check for the robustness of the indicator. Once set, people are classified as poor if they cannot afford at least two of the listed items or activities (the unit of analysis is the individual). In the original Bristol measure income is also considered, and, as a result, people can be classified in four groups: poor (they cannot afford two necessities and have low income), vulnerable to poverty (they do not lack two necessities but have relatively low income), risen out of poverty (they lack two necessities, but they have relatively high income), not poor (they do not lack two necessities and they have relatively high income) (Gordon et al., 2000).
This methodology was applied in the United Kingdom and in many different developing countries. In 2017 the European Community adopted this approach as the official measure of MD poverty for their countries (Guio et al., 2016).
An influencing work on MD poverty measures is the one developed by the OPHI. The experiences it promoted seem to be based on the capability approach (Alkire, 2007). It seems, consequently, that poverty is defined as insufficient capabilities. However, the indicators employed refer in general terms to variables that could be considered, in Sen's analytical scheme, to functionings. But even if this should be the case, the idea of functioning is itself relatively broad. The variables selected in different OPHI'S sponsored measures in Latin America may be associated to other perspectives (e.g. quality of life). In fact, Alkire (2007) 2 recognizes the need to clarify the process followed to select the dimensions which would be required to explicit different empirical criteria. The approach by OPHI employed the criteria of nested weights: equal weights are assigned to each dimensions and equal weight to each indicator within dimensions. When the number of indicators varies among dimensions, the weight of each indicator of different dimensions in the global measure is not the same. OPHI proposes to carry out different statistical tests to evaluate if the resulting measure complies with the principles of parsimony and robustness.
OPHI'S main contributions have been, on the one hand, an identification method that generalizes the union or intersection criteria, the two forms of cut-off. On the other hand, an aggregation measure based on the well-known Foster, Greer y Thorbecke (FGT) measures which are "appropriately adjusted to account for multidimensionality. The axioms are presented as joint restrictions on identification and the methodology satisfies a range of desirable properties including decomposability" (Alkire and Foster, 2011, pp. 476).
Finally, UNICEF (ECLAC-UNICEF, 2010) promoted a child poverty measure that refers to the Convention on the Rights of the Child for the selection of dimensions and indicators.
4. A brief review of Latin American experiences with MD measures of poverty
Probably the first official measure of MD poverty was carried out for Argentina using the UBN approach (INDEC, 1984). But after this first attempt and the application of this method by several countries with census data, Latin America practically abandoned the MD approach and focused on the production of monetary measures.3
Only during the 2000s, some countries embarked in designing and incorporating as a regular indicator a MD poverty measure with a broader perspective than the UBN, using household survey data. Mainly, the variables already collected were considered, although in some cases specific variables for the poverty measure were included in the surveys' questionnaire.
Specifically, nine countries in the region now produce official estimates of MDM on a regular basis, as shown in Table 1. Mexico's indicator is, in fact, based on the combined method.4
Table 1 Official MDM in Latin America. Some characteristics
| Chile | Colombia | Costa Rica |
Dominican Republic |
Ecuador | El Salvador | Honduras | Panama | Mexico | ECLAC |
ECLAC-UNICEF (child poverty) |
|||
| MDM | Income poor | Poor | |||||||||||
| Dimensions | 5 | 4 | 5 | 5 | 4 | 5 | 4 | 5 | 6 | 5 | 6 | ||
| Indicators | 15 | 15 | 20 | 24 | 12 | 20 | 15 | 17 | 12 | 13 | 16 | ||
| Weights | |||||||||||||
| Dimensions | Equal except one | Equal | Equal | Equal | Equal | Equal | Equal | Equal | Equal except one | Equal | |||
| Indicators in dimensions | Equal | Equal | Equal except in one | Equal | Equal | Equal | Equal | Equal | Equal except in two | ||||
| Cut off to identify poor units (% of weights of indicators) |
33.5 | 33 | 20 | 33 | 33 | 35 | 25 | 30 | One dimension One indicator per dimension |
Intersection | 22 | Extreme poverty: extreme deprivation in one dimension Child poverty: moderate deprivation in one dimension |
|
| Unit of analysis | Household | Household | Household | Household | Household | Household | Household | Household | Individual | Household | Individual | Household | Individual (child) |
Source: prepared by authors based on national official publications and publications from international agencies.
Most of these national experiences were influenced by OPHI, which supported the work done in virtually all the countries. Even if the framework of capabilities is mentioned as the conceptual basis of the measures, the selection of dimensions and indicators appears as resting on a more general criteria: certain "common sense", normative criteria, views of the population and/or what has been done in other similar exercises. Mexico explicitly based its measure on the idea of poverty as deprivation of rights.5 In Ecuador the influence of OPHI is also considered although the dimensions, as in México, intend to reflect rights.6
Dimensions are similar in the different measures; some are those traditionally employed in MD welfare analysis: education, health, food security and housing. But also, the consideration of the working conditions is frequent, a somewhat surprising decision to the extent that it appears as a determinant of poverty rather than a manifestation of it. Lately, Chile incorporated other spaces as social networks and social cohesion.
Cut-offs for each indicator are defined according to expert opinion and, in the case of Mexico at least, considering normative criteria established by law.
Explicit weights are established, although in general, each of the dimensions (and each of the indicators within a given dimension) is equally important. A unit (household person) is identified as poor if deprived in some weighting proportion of the indicators. For Mexico, this is the case if a person is denied one right (dimension); for that to occur, he/she must be deprived in one of the indicators of the dimension.7,8
The unit of analysis is in all cases, the household, Mexico being the exception.
Data used in producing the measures comes from the regular household surveys of each country, the same employed to estimate income poverty. Colombia is the only exception where a different survey is considered for the MD indicator.
Apart from national official measures, it is worth mentioning two onetime exercises carried out by international agencies. ECLAC produced an MDM for 17 countries, also using the national household surveys, which is explicitly based on OPHI'S methodology. It does not differ, in general terms, from the countries' measures. The capability approach is considered when defining the dimensions and indicators, but also considerations on welfare and basic needs are mentioned. Moreover, it includes income poverty as one of the indicators in the "standard of living" dimension (ECLAC, 2013).
UNICEF produced with ECLAC a comparable measure for Latin American countries based on the idea of poverty as denial of rights. A child is poor if he/she is deprived in at least one dimension; deprivation in each of the six dimensions is defined by considering either one indicator or the union of two or three indicators (ECLAC-UNICEF, 2010).
In all countries producing official figures of MDM poverty (also, in the case of the two international exercises), the head count ratio, an intensity measure and the adjusted head count ratio, based on the Alkire-Foster methodology, are calculated and disseminated. The exception is the integrated method of Mexico (only incidence).
5. A multidimensional poverty measure for Argentina. An exercise
This section presents the first results of a broader research aimed at designing a MD poverty measure for Argentina that could be applied straightforward in other Latin American countries, based on available information from current household surveys.
In particular, the paper mainly focuses on the issue of the selection of dimensions and indicators and it does not discuss in details other relevant aspects of such measures as aggregation or weighting criteria. The estimates on poverty incidence included should be, consequently, considered providing with evidence on the possible sensibility to the use of different sources and parameters.
Data from two household surveys have been used in this exercise. One of them is the Argentine Social Protection and Social Security Survey (Encuesta Nacional de Protección Social y Seguridad Social-ENAPROSS II) carried out by the Ministry of Labour and Social Security (MTEyss). This survey has been conducted during 2015 in the city of Buenos Aires and its surrounding urban area, and in cities of other five provinces.9 Although it has no representativity for the whole country, it has been selected because it provides more information on certain dimensions than the regular employment survey.
The second is the Permanent Household Survey (Encuesta Permanente de Hogares-EPH) made by the National Statistical Office (INDEC), corresponding to the second quarter of 2015. The design of this survey is aimed at capturing labour market information on a quarterly basis.
The indicators have been defined at the individual level. The household is the unit in which it is expected that the main consumption decisions are made, income is shared and needs of all the members are cared for, and consequently it is usually used as unit of analysis. However, even if this would be the best choice when measuring income poverty, for measures that directly assess the satisfaction of certain needs, taking the individual as the unit of analysis can be reasonable.
The selection of dimensions and indicators
General criteria and the initial selection
The use of surveys which are not specifically designed to measure MDM poverty, restricted the possibility of making a theoretically grounded selection of dimensions and variables. Therefore, the initial identification of the indicators among those surveyed was based on general definitions of poverty such as "deficiency in a few dimensions entailing material deprivation" (Abdu and Delamonica, 2017, p. 885) or "severe restriction in opportunities to pursue well-being" (Osmani, 2003), or "a condition characterized by severe deprivation of basic human needs" (UN, 1995).
These views lead to a relatively straightforward initial choice of possible dimensions (and variables) among those included in the survey. Those refer to housing, water, sanitation and education; they are in fact usually contemplated in MD poverty measures that explicitly recognize to be based on the capability, the basic needs or the rights approaches. Instead, it is not possible to evaluate deprivations in other relevant dimensions -also contemplated in either of those approaches-. For example, it is noteworthy the lack of evidence related to health -only one indicator referring to access to health institutions and treatments could be found in the case of the ENAPROSS-, or food con sumption.
From a conceptual perspective, the only consideration made was to exclude some dimensions and variables included in the surveys that are sometime contemplated in MDM measures, because they were considered as probable causes of deprivations rather than expression of such deprivations. One of these variables left aside is income. This is not necessarily the case, however, regarding the other two dimensions that were also excluded. One of them refers to employment, specifically, the labour force status and job quality. This dimension has been considered in some of the measures carried out in the region (Table 1), a decision that usually rests on the idea of work as a right or on the view that the lack of a good quality job negatively affects well-being. The third excluded variable is adult education, which is also contemplated in some measures on the grounds that those with an inadequate level of schooling are deprived of a right or their well-being negatively affected. The decision of disregarding both dimensions reflects the view that unemployment or working in an inadequate job or low level of schooling, negatively influence the capacity of obtaining adequate resources that usually derive in material deprivation.
Consequently, the available indicators that were chosen refer to items that were precisely those that have been the core of the UBN approach. The specific definitions of the indicators considered in our proposal are not the same of those used when calculating the UBN indicator and the thresholds considered are stricter than in that case. The list of indicators initially selected is shown in the Appendix 1.
Statistical criteria
The initially selected variables need to be evaluated from a statistical perspective in order to gather evidence about their robustness for a possible multidi mensional poverty measure.
Different criteria and tests have been used in the literature as for example in Guio et al. (2016), who applied some of them when designing a measure of material deprivation for the European Union, or those proposed in OPHI'S methodology (Santos and Villatoro, 2016). Specifically, the statistical analyses evaluate the validity and reliability of the selected items.
i) Validity test
For an indicator to be valid, it should measure the phenomenon that it has been designed to assess, and not something else. Thus, validity points to the correlation of an indicator with variables related to the concept to be measured. In this case, these variables could be causes or consequences of poverty. When constructing a multidimensional poverty measure, it is expected that all the included items are valid measures of deprivation.
Validity has been assessed by correlating individual items included in the first selection with a poverty-related indicator set as dependent variable in each model. Each item can be considered valid if it shows statistically significant relative risk ratios with a set of variables known to be correlated with the latent construct of deprivation. Although Perry (2002) finds a mismatch between poverty measured by direct indicators and income poverty, Guio et al. (2016) uses low income, economic strain and self-reported health-status to test for validity. Also, Townsend (1979) and Mack and Lansley (1985) selected the relevant items based on the correlation between deprivation and income.
Validity has been tested through the estimation of the odds ratios for each item obtained from the estimation of two logistic regressions for each individual item, where the poverty-related variables set as independent are low income (belonging to the first quintile of the adult equivalent household income) and being poor according to the monetary perspective.10 The odds ratio can be interpreted as the probability of having a deprivation versus not having a deprivation for all those who have low income or are income-poor, relative to that ratio in the population that does not show these characteristics.
Overall, the probability of being deprived/not being deprived for those who have low income or are monetary poor is higher than for those with higher incomes (Table 2). When using the ENAPROSS dataset, twelve of fourteen variables proved to be positively and significantly correlated both with low income and an income-based poverty measure. The variables that should be excluded of the MDM because of low correlation with low income are, therefore: i) inadequate house, ii) did not buy medicines/medical studies because have no money or did not receive attention. As for the second dataset, the validity test results show that all the variables are correlated with low income and monetary poverty.
Table 2 Validity test: correlation (odds ratio) with low income and income poverty
| Variables | ENAPROSS - MTEySS | EPH-INDEC | ||||||||
| Low income | Income poverty | Test result | Low income | Income poverty | Test result | |||||
| Inadequate house | -0.706 | (0.559) | 0.549 | (0.450) | fail | 0.472*** | (0.146) | 0.400*** | (0.149) | pass |
| Water outside the house | 1.325*** | (0.0500) | 1.272*** | (0.0495) | pass | 1.741*** | (0.0461) | 1.645*** | (0.0479) | pass |
| Inferior quality of housing materials | 1.372*** | (0.0333) | 1.246*** | (0.0330) | pass | 1.427*** | (0.0288) | 1.300*** | (0.0298) | pass |
| Insecure tenure | 0.843*** | (0.0378) | 0.836*** | (0.0379) | pass | 0.922*** | (0.0378) | 0.918*** | (0.0393) | pass |
| Overcrowding | 1.658*** | (0.0665) | 1.631*** | (0.0653) | pass | 1.943*** | (0.0380) | 1.948*** | (0.0404) | pass |
| No kitchen | 0.925*** | (0.0417) | 0.912*** | (0.0417) | pass | 0.830*** | (0.0399) | 0.739*** | (0.0414) | pass |
| Shared toilet | 0.730*** | (0.0703) | 0.751*** | (0.0703) | pass | 1.254*** | (0.0707) | 1.215*** | (0.0739) | pass |
| No septic tank | 1.159*** | (0.0526) | 1.037*** | (0.0520) | pass | 0.857*** | (0.0308) | 0.975*** | (0.0321) | pass |
| No flush | 1.429*** | (0.0421) | 1.488*** | (0.0421) | pass | 1.635*** | (0.0344) | 1.648*** | (0.0366) | pass |
| Children from 4 to 17 years that do not attend school | 1.258*** | (0.130) | 1.260*** | (0.129) | pass | 1.227*** | (0.0916) | 1.184*** | (0.0937) | pass |
| School backwardness | 1.068*** | (0.0590) | 1.103*** | (0.0589) | pass | 1.060*** | (0.0399) | 0.992*** | (0.0403) | pass |
| Shanty town/garbage dump site | - | - | - | - | - | 0.776*** | (0.0288) | 0.632*** | (0.0297) | pass |
| Did not go to the doctor | 1.074*** | (0.205) | 0.935*** | (0.202) | pass | - | - | - | - | - |
| Did not buy medicines/studies | 0.277 | (0.195) | 0.421** | (0.194) | fail | - | - | - | - | - |
| Did not go to the doctor/buy medicines II | 0.884*** | (0.0347) | 0.815*** | (0.0348) | pass | - | - | - | - | - |
Notes: standard errors in parentheses; *** p < 0.01, ** p < 0.05, * p < 0.1
Source: calculations based on data from the ENAPROSS-MTEySS and the EPH-INDEC.
ii) Reliability tests
Two tests will be used to assess reliability: a) Cronbach's alpha (α) and b) Item Response Theory (IRT).
a) Cronbach's alpha
Classical test theory assesses reliability of a set of items to measure a phenomenon. The ideal way to test for reliability would be to compare at least two independent measures. However, as this is not always possible, Cronbach (1951) suggests the use of α defined as the square of the correlation between the measured scale (the sum of individual item scores) and the underlying factor. The test can be interpreted as a random sample of items from a hypothetical domain of items designed to measure the same thing (in this case poverty), and α represents the expected correlation of one set of indicators with an alternative set containing the same number of items. Thus, the square root of α is the estimated correlation of set of variables showing true scores with no errors (Nunnally, 1967; Nunnally and Bernstein, 1994).
It is usually considered that values of α lower than 0.7 imply that the set of items is an unreliable measure of a given phenomenon (Nunnally, 1967). Therefore, the initial groups of indicators (from both surveys) are not a reliable measure of poverty as the parameter is 0.54 for ENAPROSS and 0.58 for EPH. If the items that showed no significant correlation with low income are extracted from the dataset, the resulting α rises only a few points, but remains below that threshold (α =0.58).
Consequently, if the indicators that do not pass the validity test are left out, the resulting set is not a reliable measure according to Cronbach's coefficient.
b) Item Response Theory (IRT)
While Classical Test Theory gives information about the group of items as whole, IRT allows to test the reliability of each of the observed items on mea suring the "latent trait" or unobservable phenomenon (i.e. poverty).
Two aspects are measured: discrimination and severity. The discrimination parameter describes how fast the probability of success (or failure) changes for different levels of the latent variable. In this case, how well it discriminates between deprived and not deprived individuals. If the parameter takes values below 0.4, it is suggesting low discrimination potential (Guio et al., 2016). The second parameter indicates how severe poverty is for an individual who has a lack of each item. It is in consequence, desirable to include indicators with different severity scores in a composed measure. For this parameter Guio et al. (2016) suggest a threshold of 3 standard deviations from the mean of the latent variable, so that any item with higher values would be too severe and thus only very poor individuals will fail to accomplish that need. As a result, those variables would be unreliable as poverty indicators. If, on the contrary, the difficulty parameter is too low, it would mean that the item is affordable for most individual and thus not useful for identification.
Graphically, the Item Characteristic Curve (ICC) describes the probability that an individual is deprived on certain dimension. The probability of failing in an item is a function of the properties of the dimension and the level of the latent variable (multidimensional poverty). The more the ICC is shifted to the right, the more overall deprived an individual must be to be deprived in a given item. Discrimination can also be observed in the ICC, namely the steeper the slope of the curve, the more discriminating the item would be.
When considering the original set of variables from ENAPROSS, the following proved to be too severe (Figure 1): i) shared toilet facility, ii) children of 4 to 17 years old that do not attend school, iii) school backwardness, iv) did not go to the doctor/hospital because have no money or did not receive attention, v) inadequate house and vi) did not buy medicines/studies because have no money or did not receive attention. Note that the last two also failed the validity test. Furthermore, even if the discrimination parameters for all variables are above the threshold, both health-related indicators and school backwardness are barely above 0.4.
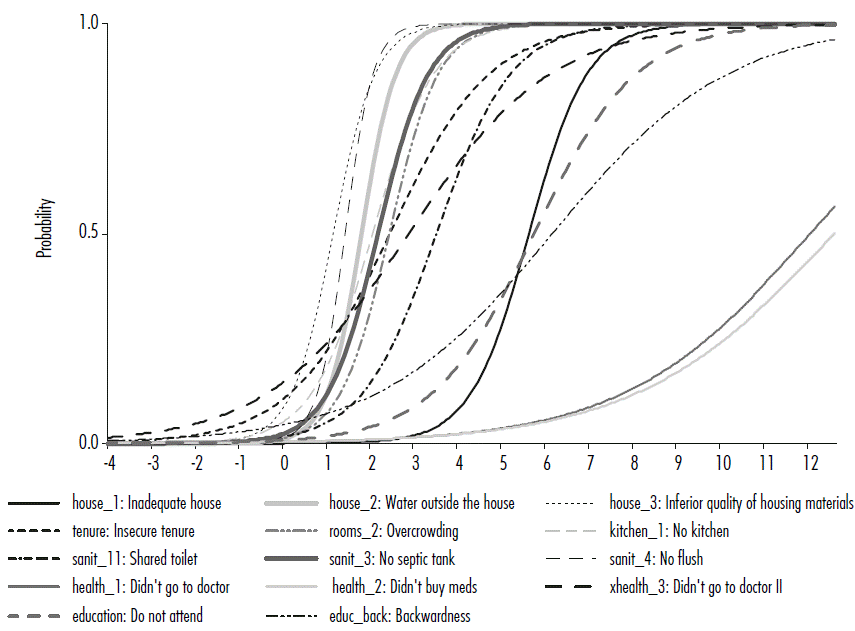
* See Table A2.1. (Appendix 2).
Source: calculations based on ENAPROSS-MTEySS.
Figure 1 Item Characteristic Curves-initial set of variables (ENAPROSS)*
In the case of the second set of variables, although all variables show reasonable results regarding their discrimination potential (being "school backwardness" the less discriminating), six of them are too severe: i) inadequate house, ii) separate room for cooking, iii) shanty town or near garbage dump site, iv) children of 4 to 17 years old that do not attend school, v) school backwardness and vi) shared toilet facility (Figure 2).
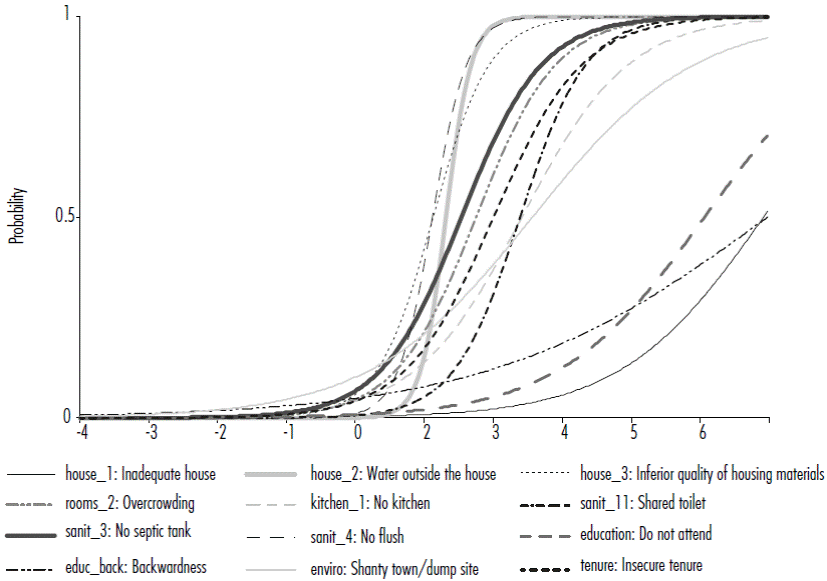
* See Table A2.1. (Appendix 2).
Source: calculations based on EPH-INDEC.
Figure 2 Item Characteristic Curves-initial set of variables (EPH-INDEC)*
If the variables that did not pass validity and IRT tests are suppressed, only eight variables remain in the set of the first source. All these show adequate results both in terms of severity and discrimination. However, the health indicator (having skipped doctor/health facility visits for monetary reason!) shows the highest severity and the lowest discrimination potential (Figure 3). Moreover, Cronbach's alpha for the final set of variables is higher than for the initial, denoting higher overall reliability. However, this parameter is still under the threshold, as it only grows to 0.64.
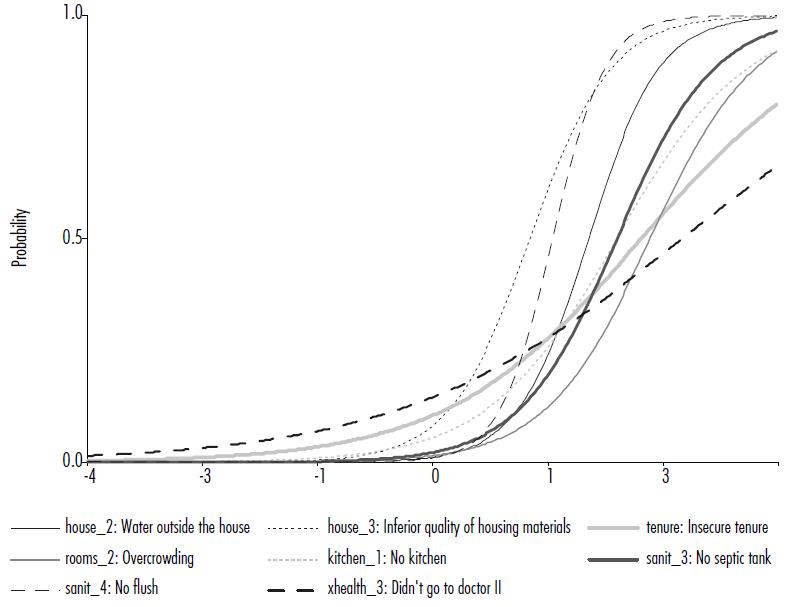
* See Table A2.1. (Appendix 2).
Source: calculations based on ENAPROSS-MTEySS.
Figure 3 Item Characteristic Curves-selected variables (ENAPROSS)*
For the second dataset, if only the indicators that do not fail the IRT test are considered, six variables remain in the set, all of them related to characteristics of the house and sanitation facilities. For this set, Cronbach's alpha is higher, although it remains below the threshold (α =0.65). All variables throw adequate results both for discrimination and severity (Figure 4).
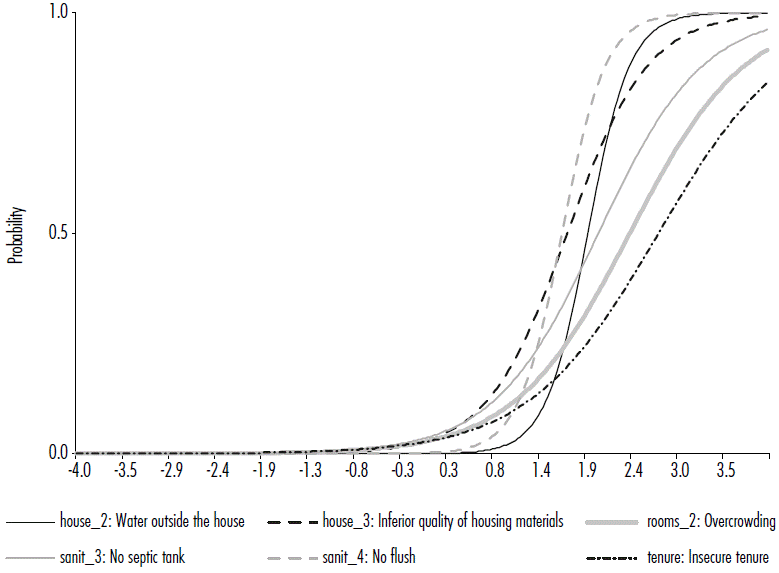
* See Table A2.1. (Appendix 2).
Source: calculations based on EPH-INDEC.
Figure 4 Item Characteristic Curves-selected variables (EPH-INDEC)*
As a conclusion of these tests, the dimensions and indicators that prove to be the best indicators of multidimensional poverty are very similar (although with more strict thresholds) to those included in the original UBN measure, as most of them refer to the quality of the house and sanitation facilities.
iii) Final selection of indicators
The final set of indicators that comply with the validity test and the IRT are those indicated in Appendix 1. When the Cronbach's reliability test is applied to this set, the value of α grows to about 0.65. Even if it is still below the usual threshold, that set of indicators was considered to reasonably meet the statistical standards.
The incidence of multidimensional poverty
If individuals who fail to meet one of the selected needs are considered poor, the headcount ratio from the ENAPROSS dataset results in 39.1%, this figure falls to 17-9% if setting the cut-off in two instead of one indicator (Table 3)11
Table 3 Deprivation rate (% of individuals)
| ENAPROSS | EPH | EPH (alt.) | |
| One indicator | 39.1 | 26.5 | 23.7 |
| Two indicators | 17.9 | 10.3 | 8.0 |
Source: calculations based on data from ENAPROSS-MTEySS and EPH-INDEC.
From people deprived in only one indicator according to the last set, 33-2% are deprived in the health dimension. Regarding the considered indicator, it is important to note that the survey asks if at least one member of the household did not go to the doctor or did not buy medicines due to economic problems. Moreover, 17-2% of these persons are deprived in the dimension "inferior quality of housing materials" which -as mentioned- seems to be too restrictive but cannot be relaxed with the available information.
With EPH the results are 26.5 and 10.3% respectively. Of those individuals who are deprived in only one dimension, 34.1% live in households whose toilet facility lacks a septic tank and 19.9% live in households built with materials of an inferior quality. If this last indicator is relaxed, by setting the thresholds in houses built with very precarious materials, the headcount drops to 23.7% if the threshold of one deprivation is held, and to 8.0% of the population if the cut-off is set at two or more deprivations. Considering this new set of variables, however, Cronbach's alpha drops (α=0.59). Moreover, the new indicator on household building materials does not pass the IRT test, as it overrides the severity threshold (table A2.2, Appendix 2).
If instead of selecting variables as explained above, all indicators of the initial datasets would have been used, the poverty rate considering one deprivation threshold would have been 41.8% (ENAPROSS) or 36.8% (EPH). If the threshold was set for two variables, the results would have been 20.3 and 15.5%, respectively.
6. Final remarks
We report on this paper the results of a first exercise of MDM of poverty estimation based on data included in existing official surveys. An initial group of items were selected; only those conveying a clear manifestation of deprivation were considered, leaving aside variables referring to clear determinants of poverty or their consequences. Those items were evaluated in terms of their validity and reliability as indicators of such measure.
Those considered in the original choice appear, in general, as valid items of an MDM; only two out of the thirteen are not correlated with low income and income poverty when ENAPROSS data are employed. Regarding reliability, all proposed sets of indicators fail Cronbach's test. Finally, an IRT reliability test was applied. Those indicators that resulted appropriated from the point of view of these two criteria are very similar to those used in the UBN approach. Furthermore, although the health dimension potentially adds valuable information, data available on this topic in the surveys considered do not provide adequate indicators to be included in a MDM.
In conclusion, as the international experience indicates, developing a Multidimensional Poverty Measure for the region is a desirable and possible objective. However, at least for the case under study (Argentina), a preliminary conclusion is that current publicly available information from household surveys appears as too restrictive as a source of indicators suitable for MDM covering different areas of social interest. It would be necessary that the countries of the region, as is the case with some of them, consider the production of specific information to be included in such measures. This would make possible to follow a more reasonable sequence of the estimation process. A crucial step is to discuss the conceptual framework of the measure, both in terms of the general definition of poverty and for identifying the relevant dimensions. The indicators to be used should followed from this discussion, and not as it is now in many countries where poverty is defined only on the bases of the existing information.

