


Serviços Personalizados
Journal
Artigo
 texto em
  Inglês (pdf)
 Artigo em XML
 Referências do artigo
 Enviar este artigo por email
Indicadores
-
 Citado por SciELO
 -
 Acessos
Links relacionados
-
 Similares em
SciELO
Similares em
SciELO
Compartilhar

 Permalink
Problemas del desarrollo
versão impressa ISSN 0301-7036
Prob. Des vol.50 no.198 Ciudad de México Jul./Set. 2019 Epub 16-Nov-2019
https://doi.org/10.22201/iiec.20078951e.2019.198.67471
Articles
The roles of Uruguay and Mexico in economic integration, 1990-2016: MERCOSUR and NAFTA
aUniversidad de la República, Uruguay. nicolas.reig@cienciassociales.edu.uy
bUniversidad Nacional Autónoma de México (UNAM), Faculty of Economics, Mexico. anyul@unam.mx
Using structural analysis techniques and methods, this paper analyzes the integration of Uruguay into MERCOSUR and the integration of Mexico into NAFTA during the period 1990-2016 and compares the two. This analysis is conducted in the context of the process of economic integration between the main economic blocs in the Americas. The evidence and results suggest a divergence between the trajectories of the blocs and those of smaller partners. MERCOSUR made no significant progress and remained only a loosely integrated bloc, while NAFTA fostered a deeper integration between its partners. In this context, the integration of junior partners such as Mexico and Uruguay into their respective agreements has been asymmetrical, and therefore their respective contributions have differed considerably. This is much more significant in the case of Mexico than in Uruguay.
Key Words: trade integration; MERCOSUR; NAFTA; economic asymmetries; structural analysis methods and techniques
El objetivo de este artículo es analizar y comparar, en el marco de los procesos de integración comercial de los dos grandes bloques de las Américas, la integración de Uruguay en el MERCOSUR y de México en el TLCAN en el periodo 1990-2016, a través de métodos y técnicas de análisis estructural. La evidencia y los resultados sugieren que los bloques y los socios menores tuvieron trayectorias divergentes en sus procesos de integración. El MERCOSUR no tuvo avances significativos y continúa siendo un bloque poco integrado; mientras que el TLCAN profundizó la integración entre sus socios. En este contexto, los socios “menores” como Uruguay y México tuvieron una integración asimétrica en sus respectivos acuerdos y, por lo tanto, un aporte claramente diferente, siendo mucho más importante en el caso de México que en el de Uruguay.
Palabras clave: integración comercial; MERCOSUR; TLCAN; asimetrías económicas; métodos y técnicas de análisis estructural
Clasificación JEL: F13; F15; F53
1. Introduction
Of the various processes of economic integration that took place between different countries across the Americas during the 1990s, the MERCOSUR (1991) and NAFTA (1994) blocs stand out in terms of their economic and commercial importance. These integration agreements connected countries with economic and social asymmetries and distinct structural characteristics. MERCOSUR consists of one large country, Brazil; one medium-sized partner, Argentina, and two junior partners, Uruguay and Paraguay. Meanwhile, in NAFTA the U.S. is the large partner, Canada is the medium-sized partner, and Mexico the relatively “junior” partner.1 Additionally, MERCOSUR is composed of four developing countries, while NAFTA is composed of two developed countries and one developing country.
From a global economy perspective, bloc formation, such as free-trade areas, customs unions, or common markets between groups of countries, has as much to do with the potential benefits to trade between its members and harnessing possible complementarities present in the respective economies as it has to do with establishing a new translational unit that is strong enough to negotiate and compete with other countries or economic blocs. For junior partners in particular, economic integration offers the possibility of participating in a wider market under conditions which are more favorable than those of their potential competitors, fostering productive complementarity, developing economies of scale, and integrating into regional and global value chains. However, as the different types of treaties demonstrate, economic integration and bloc formation are in fact multifaceted processes which are not concerned solely with trade. Trade advantages are only one of the benefits to be gained from economic integration, as these processes, rather than being concerned solely with trade, are also intended to gain dynamic comparative and competitive advantages for member states.
Different schools of thought exist regarding the importance of integration processes, their potential effects on trade, and the growth and development of the countries which decide to participate in the various types of treat. For decades, the Latin American structuralist school has emphasized the role of regional integration in structural economic transformation, factoring in productivity and trade factors as well as social and political factors.2 From a trade perspective, on the other hand, diverse trade theories point to a set of costs and benefits that arise from regional integration processes. These include: redistribution of resources according to comparative advantages and increased inter-industry trade, relocation of production, an increase in the market’s effective size, heightened specialization and productive scale, the existence of new products, and increased diversity in consumption.3 Asymmetries between member states are also important and the effects they have on the distribution of costs and benefits must be taken into account. Wealth and economic size are particularly important factors which determine a country’s capacity to benefit from integration.4
The existence of trade flows within the Americas provides a set of indicators which distinguish trade between countries, trade between the centers of distinct blocs, and trade which takes place between countries of different blocs. In turn, the existence of empirical data on trade flows over the last 25 years makes it possible to compare the intended outcomes of implementing trade treaties with the actual outcomes of the integrations which result from them. Economic integration outcomes can be measured using geographically coherent temporal indicators which make reference to the various schools of thought on the role of international trade. In addition to differentiating trade between countries from trade between blocs, integration indicators can also allow trade composition and the role of intra-industry and inter-industry exchange in economic development to be estimated.
This paper seeks to analyze the respective trade integrations created by MERCOSUR and NAFTA and the respective roles played by Uruguay and Mexico in each one, before making comparisons between them. This paper focuses on the period 1990-2016 and employs structural analysis methods and techniques. It must be pointed out that, since 2004, an FTA has existed between the junior partners of each bloc. This constitutes both an exception between members of the two blocs as well as a special relationship and connection between the junior partners, which contributed to the decision to conduct an analysis of the two countries. Additionally, examining the treaties’ junior partners makes it possible to conduct a comparative analysis of their trajectories as members of blocs with different characteristics.
This analysis seeks to answer the following questions: what has been the outcome of the MERCOSUR and NAFTA economic integration processes, respectively? And what role did the junior partners Mexico and Uruguay play in their respective blocs? The working hypothesis is as follows: given the variety of trajectories within the MERCOSUR and NAFTA integration processes, the integration trajectory of each respective bloc’s junior partners differed significantly, with differences being more significant in the case of Mexico than in that of Uruguay.
Following on from Prakas et al. (2007) and Garcia and Puchet (2015), empirical analysis is conducted using structural analysis methods and techniques, using data from trade flow matrices and various systematic integration indices (SII s ). These methodologies are fundamental to the analysis of regional integrational processes as, by understanding regional blocs as systems, they allow the interdependence between countries to be quantified.
Seen in this light, these indicators and the measures which result from them can demonstrate the intensity and complexity of an economic integration treaty. Integration is also analyzed from a macroeconomic perspective, showing the aggregated extent of a bloc’s or a country’s integration level. Additionally, such analysis shows the extent to which integration is linked to underlying sectorial or mesoeconomic integration trends. These trends depend, to a large extent, as much on the trajectory of a country’s productive and trade specialization as they do on the deepening of trade relations within a regional and international value chain framework.
An extensive bibliography already exists of research which analyzes each bloc’s integration processes from trade and institutional perspectives, among others. This paper seeks to contribute to the analysis of and debate around trade integration created by MERCOSUR and NAFTA, as well as the roles played by their junior partners. This is achieved using various empirical findings obtained via structural analysis methods to understand the blocs, with special attention being given to the junior partners.
Little research on this subject exists, but the following works can be cited: Gonzalez and Larruina (2010) and Corbella (2013) for MERCOSUR, Garcia and Puchet (2015) for Mexico-U.S. relations, and Castilho and Puchet (2012) for various trading blocs. In general, however, these papers focus on analyzing integration at the level of blocs and between partners, particularly larger partners, without considering the role of junior partners.
This paper is structured as follows: section two describes and analyzes general characteristics of blocs’ and countries’ trade integration. Section three outlines the methodology and indicators used. In section four the findings are presented, with the key conclusions presented in section five.
2. Integration, bloc structure and trade
MERCOSUR and NAFTA
MERCOSUR, consisting of Brazil, Argentina, Uruguay, and Paraguay, was intended to result in deep integration, with the long-term objective of progressing through the various phases of integration and eventually becoming a common market. The bloc began with the creation of a Free Trade Zone (FTZ), which then evolved into a flawed Customs Union (CU), which remains the current model. Broadly speaking, from a trade perspective, this regional integration process passed through three distinct phases: the first (1991-1998), during which MERCOSUR was formally created and various institutional agreements were strengthened, saw an increase in intrabloc trade flows and, as a result, increased economic integration. The second (1992-2002) was characterized by regional crisis, with trade flows and integration levels stagnating and falling. During the third (2003-2017), little progress was made in terms of intraregional trade flows and integration.
NAFTA-consisting of the U.S., Canada, and Mexico-was, with the exception of a few goods and services,5 conceived from the outset as an FTZ, and was never intended to progress through the various stages of regional integration. At least two important periods of regional integration can be distinguished (Dussel Peters and Ortiz, 2016): during the first, 1994-2000, there was strong growth in trade, job creation, and foreign direct investment (FDI). The second period began in 2001 and has been characterized by slower growth in the aforementioned variables. We see, therefore, that each respective bloc was formed using a different type and format of treaty.6 From both a conceptual and practical perspective, these different kinds of treaties can be expected to have distinct effects on the relationship between partners, as well as on trade.7
The type of integration process, bloc structure, and the position occupied by each partner relative to its size are all important factors and must be analyzed carefully. Size is an important determining factor of a country’s ability to benefit from integration. This is particularly true for smaller partners.
In the framework used in this paper, benefits derived from integration are predominantly related to trade, particularly from interregional trade between partners. Findings also suggest that there is an increased level of interdependence between partners. It is beyond the scope of this paper to consider other possible benefits, such as increased employment, or investment in or diversification of the productive structure related to integration processes.
Table 1 shows the structure of blocs and countries, as well as some of their main characteristics. The difference between a country’s size and its relative position in a bloc, the difference between the large and small countries in each bloc, and the differences between the junior partners in each bloc are particularly notable. Bloc structure and the position as large or junior partner in a regional treaty are related to the place that each partner occupies in both relative and absolute terms after factoring in crucial economic variables such as GDP, GDP per capita, exports and foreign direct investment (FDI) received, and population.
Table. 1 Bloc structure: Mercosur and NAFTA, 2015
| GDP | Poblation | GDP pc | Exports | DFI | ||||||
| B | % | M | % | T | % | B | % | B | % | |
| MERCOSUR | ||||||||||
| Brazil | 1 774.7 | 72.5 | 207.8 | 79.6 | 8.5 | 91.2 | 191.1 | 72.4 | 65.0 | 82.8 |
| Argentina | 583.1 | 23.8 | 43.4 | 16.6 | 13.4 | 143.5 | 56.7 | 21.5 | 11.6 | 14.8 |
| Uruguay | 57.5 | 2.4 | 3.4 | 1.3 | 16.9 | 180.6 | 7.7 | 2.9 | 1.6 | 2.0 |
| Paraguay | 30.9 | 1.3 | 6.6 | 2.5 | 4.7 | 50.0 | 8.4 | 3.2 | 0.3 | 0.4 |
| MERCOSUR | 2 446.2 | 100.0 | 261.2 | 100.0 | 9.4 | 263.9 | 100.0 | 78.5 | 100.0 | |
| Argentina / Brazil | 32.9 | 20.9 | 1.57 | 29.7 | 17.8 | |||||
| Uruguay / Brazil | 3.2 | 1.6 | 1.98 | 4.0 | 2.5 | |||||
| Uruguay / Argentina | 9.9 | 7.8 | 1.26 | 13.6 | 13.8 | |||||
| NAFTA | ||||||||||
| U.S. | 18 036.6 | 87.0 | 321.4 | 66.5 | 56.1 | 130.9 | 1 503.9 | 65.6 | 380.0 | 82.8 |
| Canada | 1 550.5 | 7.5 | 35.8 | 7.4 | 43.3 | 101.0 | 408.8 | 17.8 | 49.0 | 10.7 |
| Mexico | 1 143.8 | 5.5 | 126.2 | 26.1 | 9.1 | 21.1 | 380.6 | 16.6 | 30.0 | 6.5 |
| NAFTA | 20 730.9 | 100.0 | 483.4 | 100.0 | 42.9 | 2 293.3 | 100.0 | 459.0 | 100.0 | |
| Canada / U.S. | 8.6 | 11.1 | 0.77 | 27.2 | 12.9 | |||||
| Mexico / U.S. | 6.3 | 39.3 | 0.16 | 25.3 | 7.9 | |||||
| Mexico / Canada | 73.8 | 352.5 | 0.21 | 93.1 | 61.2 | |||||
| MERCOSUR / NAFTA | ||||||||||
| Brazil / EUA | 9.8 | 64.7 | 0.15 | 12.7 | 17.1 | |||||
| MERCOSUR / NAFTA | 11.8 | 54.0 | 0.22 | 11.5 | 17.1 | |||||
| Uruguay / Mexico | 5.0 | 2.7 | 1.87 | 2.0 | 5.3 | |||||
Notes: GDP, exports & DFI received: billion (B) in current US$; GDP per capita (GDP pc): thousand (1) of current US$; Population millions (M).
Source: compiled by the author based on data obtained from AIADI, WTO, UNCIAD, COMTRADE/WITS and WDF-World Bank.
In relative terms, Brazil is the largest partner in MERCOSUR in all economic dimensions-except for GDP per capita-and in population, followed by Argentina. Uruguay is one of the junior partners and its contributions are less than 5% across all four dimensions. It does, however, have greater GDP per capita than the largest partner. In NAFTA, on the other hand, the U.S. is the largest partner across every economic dimension as well as in population, while Canada, with the exception of population, is the second partner. In relative terms, Mexico is the junior partner, with contributions of less than 10% in GDP and DFI received. It attains between 15% and 30% across the other dimensions. Likewise, there is a significant asymmetry between the blocs in favor of NAFTA, due to the differences between the largest partners in each bloc.
It is worth noting that, on the one hand, significant differences exist between the respective countries of each bloc and also between the two blocs themselves, while on the other hand, Mexico and Uruguay can be characterized as the junior partners or as the smallest economies in relative terms within their respective regional treaties. In terms of characteristics and dimensions, the most junior partner in MERCOSUR is a small country while in NAFTA the most junior partner is a large country. In view of this-and especially considering country and bloc size-we can see that the vast difference in size between the blocs and the junior partners could create conditions more favorable for NAFTA members compared to MERCOSUR members when seeking to maximize the benefits of trade and integration.
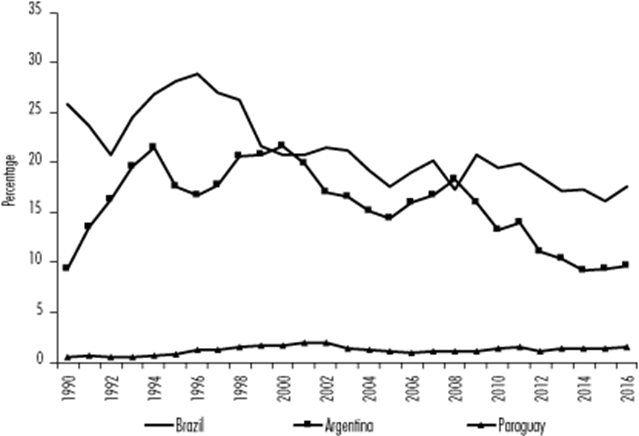
Significant differences exist between the blocs regarding intraregional trade. In the case of MERCOSUR, the large partners had low levels of trade, while trade was more important to the junior partners despite decreasing during the study period (see Figure 1 and Table 2). Average trade levels throughout the study period were as follows: Brazil 10%, Argentina 27%, Uruguay 35%, and Paraguay 44%. Given the size of Brazil’s economy, the bloc’s trade levels and trends were relatively similar to that of the largest partner.
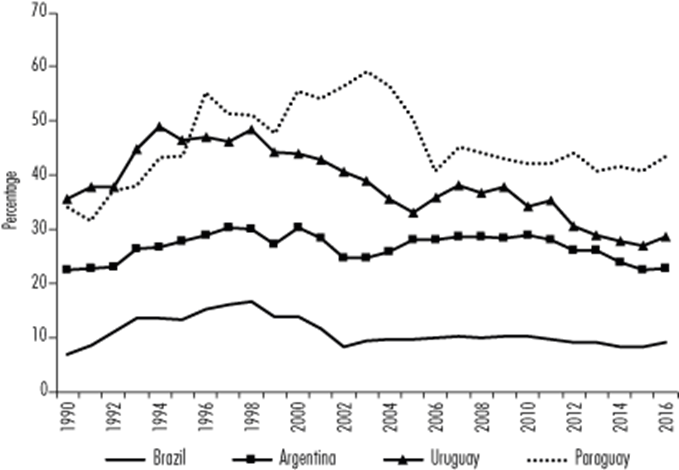
Notes: *Total trade is the sum of exports (X) and imports (M) ** Percentages calculated using values in current prices (US$).
Source: Compiled by the authors based on data obtained from COMTRADE/WITS and WDI-World Bank.
Figure 1 MERCOSUR countries: interregional trade as a share of total Trade, *1990-2016 (in percentages) **
Table 2 Mercosur countries and Mercosur; trade and interregonal* and extraregional** trade´s share of total trade, 1990-2000, 2001-2010, 2011-2016 (averages in millions of US$ and %)***
| 1990-2000 | 2001-2010 | 2011-2016 | 1990-2000 | 2001-2010 | 2011-2016 | |||
| M | M | M | % | % | % | |||
| Brazil | Intrarregional | MERCOSUR | 11 941 | 22 446 | 38 548 | 13.7 | 10.0 | 9.0 |
| Extrarregional | RW | 73 655 | 180 638 | 316 559 | 84.6 | 80.8 | 73.9 | |
| China | 1 429 | 20 392 | 73 114 | 1.6 | 9.1 | 17.1 | ||
| Argentina | Intrarregional | MERCOSUR | 11 006 | 21 741 | 34 291 | 27.8 | 27.9 | 25.1 |
| Extrarregional | RW | 27 491 | 49 415 | 86 272 | 69.6 | 63.4 | 63.2 | |
| China | 1 030 | 6 778 | 15 929 | 2.6 | 8.7 | 11.7 | ||
| Uruguay | Intrarregional | MERCOSUR | 2 180 | 3 248 | 5 548 | 44.6 | 36.8 | 29.7 |
| Extrarregional | RW | 2 555 | 4 976 | 10 414 | 52.2 | 56.3 | 55.8 | |
| China | 158 | 608 | 2 688 | 3.2 | 6.9 | 14.4 | ||
| Paraguay | Intrarregional | MERCOSUR | 1 452 | 3 384 | 8 362 | 46.1 | 46.0 | 42.1 |
| Extrarregional | RW | 1 540 | 3 290 | 8 819 | 48.9 | 44.7 | 44.4 | |
| China | 160 | 684 | 2 696 | 5.1 | 9.3 | 13.6 | ||
| MERCOSUR | Intrarregional | MERCOSUR | 26 579 | 50 819 | 86 748 | 19.7 | 16.0 | 14.4 |
| Extrarregional | RW | 105 532 | 237 700 | 421 652 | 78.4 | 74.8 | 69.9 | |
| China | 2 486 | 29 080 | 94 840 | 1.8 | 9.2 | 15.7 |
Notes: *Trade is (X+M); Extraregional is broken down into Rest of the World (RW) and China; *** Percentages calculated using values in current prices (US$)
Source: Compiled by the authors based on data ontained from COMTRADE/WIITS and WDI-World Bank.
Therefore, levels of intrabloc exchange were low, averaging 16% across the study period (see Figure 2 and Table 2), with imports being slightly higher than exports (17% on average as opposed to 16%). Although intraregional trade grew during the study period, growth in extraregional trade was much higher, resulting in a decrease in MERCOSUR’s relative share. In turn, the massive increase of China’s share in all countries is noteworthy, especially in the case of Brazil.
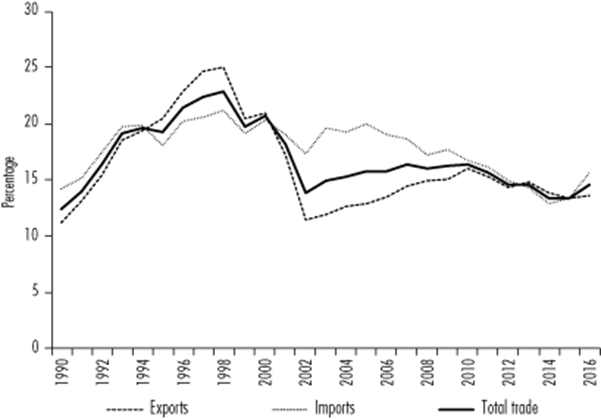
Notes: * Percentages calculated using values in current prices (US$).
Source: Compiled by the authors based on data obtained from COMTRADE/WITS and WDI-World Bank.
Figure 2 MERCOSUR: interregional exports (X), imports (M), and total trade (X + M) as a share of the respective totals, 1990-2016 (in percentages)*
The development of intraregional trade is closely linked to various internal factors specific to each respective country and bloc, as well as to profound transformations in the global economy during recent decades, particularly China’s emergence as a global economic force.8 As Castilho and Puchet (2012) point out, levels of economic integration within MERCOSUR remained low in the sense that growth in intra-zone trade was low and there were no significant gains in productive integration.
Hiratuka (2016) points out that there has been an increase in commodities’ share of total exports -consisting mainly of agricultural products, foodstuffs, fuels, and minerals- with inter-industry trade predominant in the majority of regions. Latin America is an exception to this trend, where intra-industry trade has had a higher share. This has been linked to flows of intrasectoral expertise, particularly between Brazil and Argentina. Following on from this analysis, Cepal (2018) and Amar and García (2018) demonstrate that bilateral exchange between large partners increased, although productive integration remains concentrated in sectors in which transnational subsidiaries and sector-specific regimes have a strong presence, such as the automotive, chemicals and plastic, and the metal-mechanic complex in its broadest sense.
Likewise, China’s impact has been significant. It has steadily grown in importance due to its exports and imports and its predominantly intersectoral trade, while its absolute and relative volume have increased sufficiently to pose a direct threat to trade and result in a loss of market-share, particularly during the period 2001-2014 (Hiratuka, 2016).
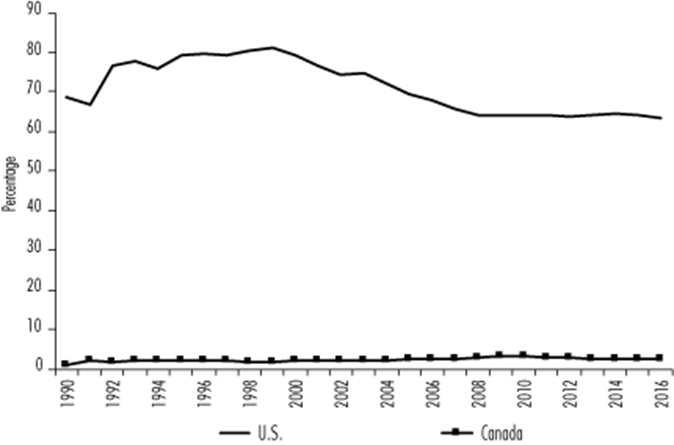
On the other hand, NAFTA’s intraregional trade remained important throughout the entire study period. The largest partner, the U.S., had the lowest level of regional trade, while regional trade remained highly important in the other two countries. It did, however, begin to decline in 2000 when compared with earlier levels (see Figure 3 and Table 3). The averages over the entire study period are as follows: U.S. 29%, Canada 71%, and Mexico 71%. Due to the importance of the U.S., the bloc’s trade levels and trends evolved in a way similar to that of the large partner.
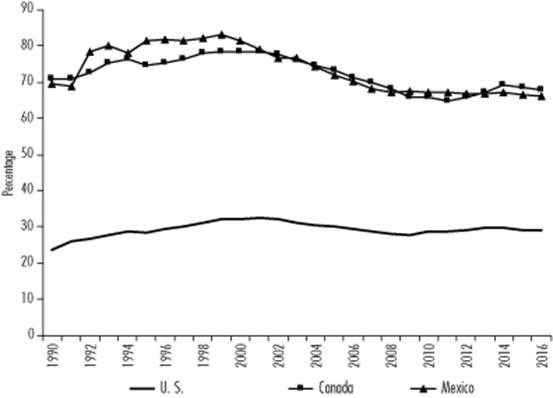
Notes: * Total trade is the sum of exports (X) and imports (M); ** Percentages calculated using values in current prices (US$)
Source: Compiled by the authors using date obtained from COMTRADE/WITS and WDI-World Bank
Figure 3 NAFTA countries: interregional trade’s share of total trade,* 1990-2016 (in %)**
Table 3 NAFTA countries and NAFTA: trade and interregional* and extraregional** trade´s share of total trade, 1990-2000, 2001-2010, 2011-2016 (average, in millions of (US$) and %) ***
| 1990-2000 | 2001-2010 | 2011-2016 | 1990-2000 | 2001-2010 | 2011-2016 | |||
| M | M | M | % | % | % | |||
| U.S. | Intrarregional | NAFTA | 397 682 | 779 040 | 1 116 790 | 29.4 | 29.7 | 29.3 |
| Extrarregional | RW | 889 422 | 1 543 555 | 2 128 156 | 65.9 | 58.8 | 55.8 | |
| China | 63 417 | 303 854 | 570 832 | 4.7 | 11.6 | 15.0 | ||
| Canada | Intrarregional | NAFTA | 266 531 | 468 074 | 593 126 | 75.9 | 71.4 | 67.2 |
| Extrarregional | RW | 79 297 | 154 924 | 221 196 | 22.6 | 23.6 | 25.1 | |
| China | 5 491 | 32 481 | 68 120 | 1.6 | 5.0 | 7.7 | ||
| Mexico | Intrarregional | NAFTA | 139 940 | 321 963 | 504 667 | 80.5 | 71.0 | 66.7 |
| Extrarregional | RW | 32 764 | 108 190 | 182 979 | 18.9 | 23.9 | 24.2 | |
| China | 1 094 | 23 443 | 68 445 | 0.6 | 5.2 | 9.1 | ||
| NAFTA | Intrarregional | NAFTA | 804 152 | 1 569 077 | 2 214 582 | 42.9 | 42.0 | 40.6 |
| Extrarregional | RW | 1 003 893 | 1 806 669 | 2 533 680 | 53.5 | 48.4 | 46.5 | |
| China | 67 592 | 359 778 | 706 047 | 3.6 | 9.6 | 12.9 |
Notes: *Trade is (X+M); Extraregional is broken down into Rest of the World (RW) and China; *** Percentages calculated using values in current prices (US$)
Source: Compiled by the authors based on data ontained from COMTRADE/WIITS and WDI-World Bank.
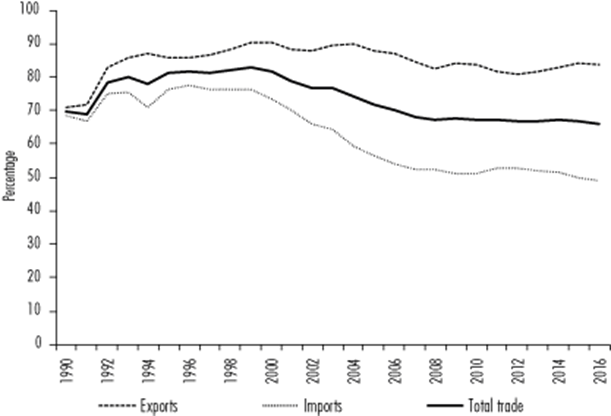
Trade levels within the bloc increased, averaging 42% over the entire study period (see Figure 4 and Table 3), with exports higher than imports (50% on average as opposed to 36%). Three distinct phases occurred: the growth period of the 1990s, the slump of the 2000s, and the recovery witnessed in recent years. The majority of the U.S.’s and the bloc’s trade was extraregional, while the majority of Canada’s and Mexico’s trade was intraregional. As in MERCOSUR, the drastic increase of China’s share is worth noting, particularly in the case of the U.S.
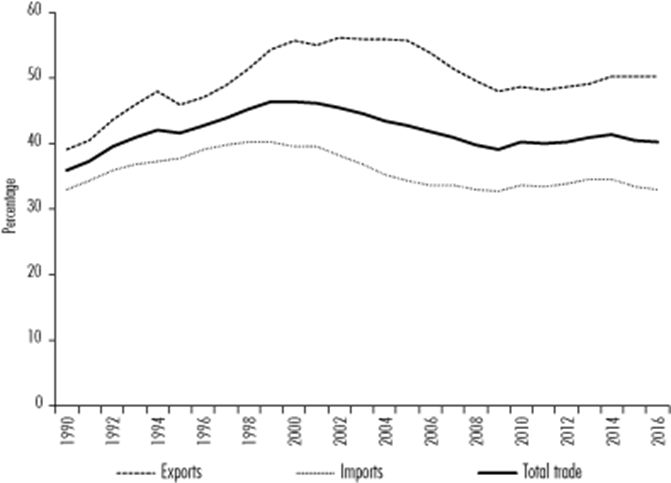
Notes: Percentages calculated using values in current prices (US$).
Source: compiled by the author based on data obtained from COMTRADE/WITS and WDI-World Bank
Figure 4 NAFTA: intraregional exports (X), imports (M), and total trade’s(X+M) share of their respective totals, 1990-2016 (in %) *
The bloc, which is centered on the U.S., underwent significant integration with an increase in intrazone trade and structured value chains, resulting in a significant productive integration (Castilho and Puchet, 2012). Consistent with Dussel Peters and Ortiz’s (2016) analysis, intra-industry trade predominated. This reality allowed for the development and strengthening of the main regional chains: auto parts/automotive, electronics, and fuels. China’s impact on NAFTA has been significant in every way. Dussel Peters and Ortiz (2016) demonstrate a growing Chinese trade presence, the existence of important structural and technological changes in intra-NAFTA trade and trade with China, increasing competitivity between intra-NAFTA trade and trade with China, and substantially higher levels of direct threats to the NAFTA market from China, particularly in two of the bloc’s main production chains, namely auto parts/automotive and electrical appliances.
The junior partners: Uruguay in MERCOSUR and Mexico in NAFTA
Uruguay’s principal integration treaty is MERCOSUR, to which it has belonged to as a full partner since its creation in 1991. Its main regional trading partner during the study period was Brazil, followed by Argentina, with both countries shares becoming less important over the duration of the study period, in particular since the year 2000 (see Figure 5). Averages for bilateral trade across the period were as follows: Brazil 22%, Argentina 10%, and Paraguay 2%. In relative terms, trade within the bloc fell, reaching its highest levels during the 1990s (peaking at over 40%) then decreasing significantly after the year 2000, a slump which has continued up to the present day (around 30%) with export levels experiencing the most significant drop-off (see Figure 6).
Notes: * Total trade is the sum of exports (X) and imports (M); ** Percentages calculated using values in current prices (US$)
Source: Compiled by the authors using date obtained from COMTRADE/WITS and WDI-World Bank
Figure 5 Uruguay: intraregional trade as a share of total trade,* country-by-country, 1990-2016 (in %)**

Notes: *Percentages calculated using values in current prices (US$)
Source: Compiled by the authors using date obtained from COMTRADE/WITS and WDI-World Bank
Figure 6 Uruguay: intraregional exports (X), imports (M), and total trade’s(X+M) share of their respective totals, 1990-2016 (in %)*
During recent years, trade with China grew significantly, in terms of both exports and imports. This resulted in China becoming the largest trading partner in terms of individual countries, and second largest after MERCOSUR in terms of major trading blocs (see Table 2).
Changes in intraregional development are connected to Uruguay’s specialization pattern, which is characterized by inter-industry trade consisting of exportation of raw materials and agricultural commodities, and importation of industrial goods and, increasingly, technology. Several studies have demonstrated this.9 However, intra-industry trade has been developing in the region, particularly with Argentina and Brazil, consisting primarily of chemicals, plastics, and rubber, and to a lesser extent automobiles and auto parts, sectors in which subsidiaries of transnational companies and sector-specific regimes both have a strong presence.10 This prevailing trade specialization pattern has deepened over recent years as a result of the intensifying relationship with China, causing trade flows to the region to decrease significantly in relative terms, with bloc integration and intra-industry trade also falling.
Mexico’s principal treaty is NAFTA, of which it was a founding member and has retained full membership since its creation in 1994.11 The U.S. was Mexico’s largest trading partner and trade with the U.S. was important throughout the study period, especially during the 1990s. Trade levels with Canada, meanwhile, were low (see Figure 7).
Notes: * Total trade is the sum of exports (X) and imports (M); ** Percentages calculated using values in current prices (US$).
Source: Compiled by the authors using date obtained from COMTRADE/WITS and WDI-World Bank.
Figure 7 Mexico: intraregional trade as a share of total trade,* country-by-country, 1990-2016 (in %)**
Bilateral trade averages throughout the period are as follows: U.S. 72% and Canada 2%. Consequently, intraregional trade remained highly important throughout the study period, peaking in the 1990s and falling after the year 2000. It has remained constant over recent years. Exports made up over 80%, while imports, although also high, decreased from 72% to 52% (see Figure 8). Imports from China have risen significantly in recent years, resulting in China becoming Mexico’s second most important trading partner (see Figure 3).
Notes: *Percentages calculated using values in current prices (US$)
Source: Compiled by the authors using date obtained from COMTRADE/WITS and WDI-World Bank
Figure 8 Mexico: intraregional exports (X), imports (M), and total trade’s(X+M) share of their respective totals, 1990-2016 (in %)*
Intra-industry trade became the predominant specialization pattern, especially with the NAFTA region. Productive integration is strong in Mexico and through NAFTA its role as supplier of manufactured goods to the U.S. market has been consolidated. Increasingly, Mexico now also supplies Asian countries with components for use in the assembly industry, particularly China.
Within the framework of the treaty, global value chains were developed and strengthened, with trade and investment also increasing. This was expediated by the arrival in Mexico of new manufacturing industry businesses, in particular from the auto parts/automotive, yarn-textile-garment, and electronics sectors (Dussel Peters and Ortiz, 2016).
In turn, García and Puchet (2015) outline several of the defining characteristics of the Mexico-U.S. relationship: […] certain characteristics present in the trade structure of the Mexico-U.S. relationship make it difficult to modify the degree of economic openness or to diversify trade […] Mexico’s trajectory is that of an economy dominated by its relations with its main trading partner, placing it in a purely transitional position from which it is incapable of influencing the functioning of its trading partners via breaking interdependence links.
3. Methodology
The empirical analysis employs structural analysis techniques and methods which factor in trade matrices and systematic integration indices (SII s ). The main reference points for analysis are Prakas et al. (2007) and García and Puchet (2015). In general terms, the point of departure for analysis is the construction of annual trade matrices for each MERCOSUR and NAFTA member for the 1990-2016 period, in addition to multi-country matrices for each bloc. Based on these matrixes, a fixed proportion model of trade relations is then proposed. This is an input-output model in which different structural integration measures can be calculated and determined, such as systematic integration indices (SIIs) by exports ( SII imp ), imports (SII exp ), and global (SII global ). As the authors explain, these indices illustrate the intensity and complexity of trade integration treaties. The indices are defined as follows:
T, S, and T´ are matrices for intercountry trade proportions between bloc members (t ij , s ij ), the terms (t ii , s ii ) represent the proportion between internal demand (supply) and global demand (supply) and n is the number of countries which make up the treaty. The indices vary between 0-1, depending on the extent of integration within the bloc.
On the other hand, the following methodological variation was used to calculate and analyze junior partners’ contribution to the integration process: First, each bloc’s three SIIs were calculated using their respective trade matrices, MERCOSUR with four partners and NAFTA with three. Next, the junior partners’ transactions were deducted from the trade matrices, or in other words, Uruguay’s commercial transactions were excluded from MERCOSUR’s matrix of four countries, and Mexico’s commercial transactions excluded from NAFTA’s matrix of three countries. Using these modified matrices, each bloc’s three SII s are calculated once more. The resulting SII s are denoted as SII s *. Finally, the difference is calculated between the SIIs obtained from each bloc’s matrix and the SII s* obtained from the matrix which excludes the junior partner’s transactions. The difference between the respective indices reveals the junior partners’ contribution to the integration process of its respective bloc in terms of its exports and imports, as well as from a global perspective.
4. Results
The results of the various SIIs calculated will now be presented. First, the SIIs of each bloc and between the countries of each bloc, followed by the results of the methodology applied to the small partners of each bloc. The annual matrices for the period 1990-2016 were constructed using the following data: GDP; consumption and investment (internal demand) in current prices (US$), based on data obtained from the World Bank; and trade statistics (exports by destination and imports by origin) in current prices (US$), based on data obtained from COMTRADE/WITS.
Blocs and countries
In the case of MERCOSUR (see Figure 9), findings indicate that integration levels within the bloc were low and passed through two distinct stages. During the first, from the beginning of the treaty up to the mid-2000s, integration deepened significantly, principally due to exports during the 1990s, with imports contributing constantly to integration throughout the study period. On the other hand, during the second period, lasting from the mid-2000s until recent years, there was a significant decrease in integration levels, more so in imports than exports, given that export levels remained low. Integration levels over recent years, therefore, were similar to integration levels at the beginning of the study period.

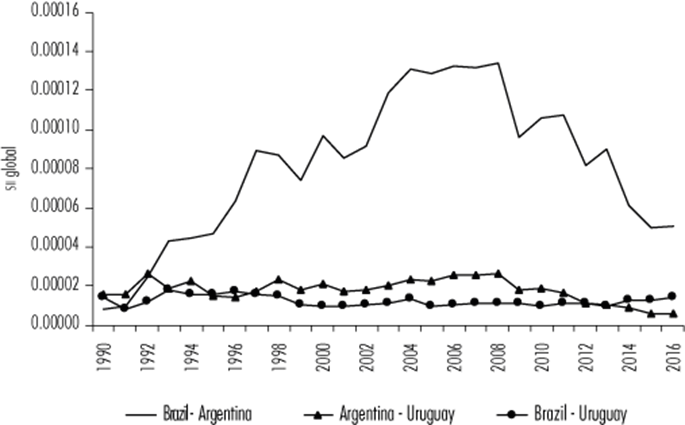
MERCOSUR’s integration outcomes are largely due to changes in the origin and destination of trade as well as the structure and specialization profile of its member countries. As was mentioned earlier on, total trade levels within the bloc were low in relative terms and declined over the study period; extraregional trade, particularly industrial, was predominant, and the deepening trade relation with China had significant impact at the intraregional level. Although bilateral trade between Brazil and Argentina intensified and there was a degree of intra-industry trade, productive integration remained low and was concentrated in sectors such as automotive, chemical and plastics, and the metal-mechanic complex, when defined in its broadest possible sense. When considering relationships between countries12 (see Figure 10), the most important trade links were between the large countries, which defined both the level and development of integration for the bloc as a whole. Integration levels between Brazil and Argentina were low during the two previously mentioned phases, namely the growth period of the 1990s and 2000s, and the subsequent period of significant recession, where integration levels returned to levels similar to those of the 1990s. Junior partner Uruguay’s relation with the larger partners had little impact on the bloc as a whole, and its development was similar to that of the larger partners. Although in global terms the integration with Argentina was more important, integration with Brazil was more stable, especially from the 2000s onwards.
In the case of NAFTA (see Figure 11), findings indicate that during the study period, the bloc deepened integration with exports, with imports decreasing. Three distinct phases can be defined: the 1990s, during which integration levels grew the most, in particular exports; the 2000s, during which integration levels decreased significantly, especially in terms of imports, although exports also decreased to levels similar to those of the mid-1990s; the final period saw exports begin to increase again during recent years, although not as intensely as during the 1990s, while imports remained relatively stable.

NAFTA’s SII values were significantly higher than those of MERCOSUR. These findings can be explained to a large extent by changes in the origin and destination of trade, as well as each countries’ respective structure and trade specialization profile.
Intra-bloc trade levels were high and grew throughout the study period, with a strong productive integration based on structured value chains, in particular the regional auto parts-automotive, electronics, and fuel chains. Undoubtedly, the growing trade relation with China had a significant impact at the intraregional level.
At the country level (see Figure 12), the most important relationship was that between the U.S. and Canada which, consisting of the three phases already mentioned, defined the bloc’s integration level and development to a large extent. However, the relationship between Mexico and the U.S. grew in importance throughout the study period in terms of its exports, in recent years reaching levels similar to those between the U.S. and Canada. Although relations between Mexico and Canada deepened during the study period, this relation remains a marginal one in the context of the bloc as a whole.

These findings strongly imply that the respective trajectories of MERCOSUR and NAFTA diverged in terms of their economic integration levels and trends (see Figures 9 and 11). The degree of integration within the MERCOSUR bloc was significantly lower than that within NAFTA both in terms of exports and imports, as well as at the global level. The integration indices clearly diverge, with those of MERCOSUR being less than one-tenth of those of NAFTA.
A significant difference can also be seen between integration trends, given that MERCOSUR made little progress throughout the study period, while within NAFTA there was a significant growth. Likewise, MERCOSUR’s global index conformed to the Brazil-Argentina index, while NAFTA’s global index conformed to the U.S.-Canada index (see Figure 12). In the case of MERCOSUR, no other bilateral integration came close to the trajectory of the large partners (see Figure 10), while in NAFTA the U.S.-Mexico index was similar to that of the bloc (see Figure 12). Therefore, we can conclude that large partners dominated these integrations.
Junior partners: Uruguay and Mexico
In the case of Uruguay, findings obtained from analysis of the junior partners indicate that its contribution to the integration process was low and decreased over the study period in terms of its imports and exports, as well as at the global level (see Figure 13). Values were at their highest during the 1990s, especially exports. Since then values have fallen constantly, eventually reaching levels lower that those recorded at the start of the integration process.

Source: compiled by the authors
Figure 13 Uruguay’s contributions in MERCOSUR: exports (exp), imports (imp), and global.
These findings reflect the drastic decrease in the region’s trade flows in relative terms. This decrease is related to the deepening of the predominant trade specialization pattern, particularly since the growth of trade relations with China. Intra-industry trade between sectors and branches has been undeniably important in the region, especially for Argentina and Brazil. This trade has taken place in industrial sectors and branches where transnational subsidiaries and sector-specific regimes have a strong presence, such as chemicals, plastic and rubber, and to a lesser extent automobiles and auto parts.
In contrast, Mexico’s contribution to NAFTA’s integration was significant and increased over the study period, principally in terms of both exports but also in imports to a lesser extent. This reality is reflected by the significant growth of the global index (see Figure 14). In accordance with the bloc’s integration trajectory, the highest contribution occurred during the 1990s, which then declined during the 2000s, with recent years seeing some return to the 1990s levels. Findings reflect the enormous increase in regional trade, especially in exports, and the increase associated with the deepening of the predominant trade specialization pattern in the region and integration with highly-structured regional value chains in the manufacturing industry, in sectors such as auto parts/automotive, yarn-textile-garment, and electronics.
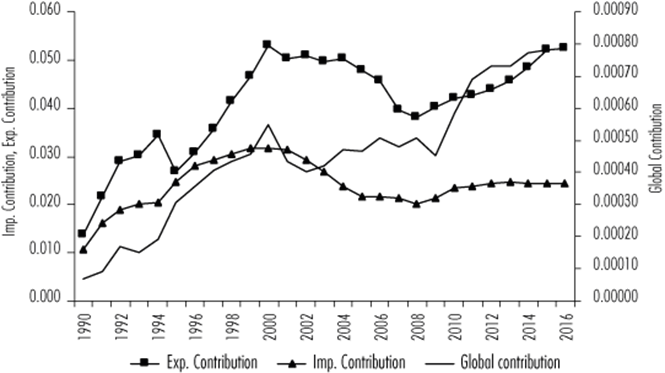
Source: compiled by the authors
Figure 14 Mexico’s contribution to NAFTA: exports (exp.), imports (imp.), and global
Findings show that Uruguay and Mexico had divergent trajectories in terms of their integration levels and trends. The degree of integration and contribution on the part of Uruguay was substantially lower than that of Mexico, in both exports and imports, as well as at the global level. Integration indices diverge, as those of Mexico were on average approximately 20 times higher than those of Uruguay throughout the study period. Significant differences can also be observed in regards to integration trends, given that Uruguay’s integration made little progress and underwent a serious retrogression, while Mexico’s integration deepened. These indices reflect profound asymmetries that the two countries have experienced in their integrations into their respective blocs, resulting in differences in potential positive effects related to trade with regional partners. As has been demonstrated, this disparity is connected as much to the evolution of each respective bloc’s integration as much as it is to changes in the origin and destination of trade, as well as structural transformations in each country’s trade and specialization profile.
5. Conclusions
Since their formation more than two decades ago, MERCOSUR and NAFTA-the two most important blocs in the Americas in both economic and trade terms-have had divergent trajectories in their respective economic integration processes. In turn, understanding bloc formation as the result of integration processes makes it possible to confirm that proposing a more ambitious institutional structure does not necessarily result in greater levels of integration. The evidence and findings obtained from structural analysis techniques and methods suggest that not only have both blocs passed through phases of increased and decreased integration, but also that MERCOSUR made little progress and remains a poorly integrated bloc, while NAFTA, on the other hand, deepened integration levels between its partners throughout the entirety of the study period.
MERCOSUR was heavily dominated by the bilateral relation between the largest partner Brazil and Argentina, with relations with junior partner Uruguay being of little importance. Meanwhile in NAFTA- although the most important relationship was between the largest partner the U.S. and Canada- Mexico, the relatively junior partner, attained a deeper level of integration and became more and more important in the bloc’s trading scheme.
These divergent integration outcomes between the two blocs are closely related to changes in the origin and destination of trade, as well as the structure and trade specialization profile of countries and blocs. In MERCOSUR, total intra-bloc trade levels were low and decreased in relative terms over the study period; extraregional trade, particularly inter-industry trade was predominant; and the growing trade relation with China has had significant impacts at the intraregional level.
Although bilateral trade between Brazil and Argentina intensified and a degree of intra-industry trade existed, productive integration levels remained low and were concentrated in certain sectors, such as automotive, chemicals and plastics, and the metal-mechanic complex in its broadest definition. The situation in NAFTA was different, with intra-bloc trade levels remaining high and growing throughout the entirety of the study period, as well as a strong productive integration based on structured value chains, mainly the regional auto parts-automotive, electronics, and fuel chains. The growth of trade relations with China had a significant impact at the intraregional level.
It is in this context that the countries considered to be the junior partners, Uruguay and Mexico, experienced significant differences in their integrations into their respective treaties, resulting in drastically different contributions. This is much significant in the case of Mexico than of Uruguay.
The findings show that Uruguay’s contributions to the integration process was low and deceased over the study period in terms of both exports and imports, and that values peaked in the 1990s, particularly in terms of exports, then fell to levels even lower than those which existed when the integration process commenced. The drastic fall in relative terms in regional trade flows is related to the deepening of the predominant trade specialization pattern, particularly since the growth of trade relations with China. Regional intra-industry trade was important, particularly between Argentina and Brazil and in sectors and branches where transnational subsidiaries and sector-specific regimes have a strong presence, such as chemicals, plastics and rubber, and to a lesser extent, auto parts and automobiles.
In contrast, Mexico’s contribution to the integration of NAFTA was significant and grew over the study period, in terms of both exports and imports. In accordance with the bloc’s integration trajectory, the greatest contribution occurred in the 1990s, which then fell during the 2000s, with recent years seeing some return to 1990s levels. The massive increase in regional trade, particularly in exports, is linked to the deepening of the region’s predominant trade specialization pattern and integration with highly-structured regional value chains in manufacturing sectors such as auto parts-automotive, yarn-textile-garment, and electronics. These findings demonstrate the disparities that existed between each country in their integration into their respective blocs, as well as the potential positive effect on trade with regional partners.
The macroeconomic structural analysis is focused on linkages created by trade relations between countries and allows both the interdependence between countries and the role of their relative sizes to be measured. Simultaneously, classified matrices of bloc transactions constitute the necessary base on which to consistently articulate the macro-level with meso-economic level, both at the country and intersectoral levels, when blocs’ sectorial composition are taken into consideration.
REFERENCES
Amar, A. y García, F. (2018), “Integración productiva entre la Argentina y el Brasil. Un análisis basado en metodologías de insumo-producto interpaís”, Documentos de Proyectos, CEPAL/UIA. [ Links ]
Balassa, B. (1962), The Theory of Economic Integration, London, Allen & Unwin. [ Links ]
Bértola, L., Isabella, F. y Saavedra, C. (2014), “El ciclo económico del Uruguay 1998-2012”, Serie Estudios y Perspectivas, Montevideo, CEPAL. [ Links ]
Bittencourt, G. (coord.) (2012), América Latina frente a China como potencia económica mundial: exportaciones e inversión extranjera, Montevideo, Red MERCOSUR, núm. 20. [ Links ]
Bittencourt, G. y Carracelas, G. (2015), “Estudio para apoyo a Subgrupo de Libre Circulación de Bienes y Servicios, Grupo de Alto Nivel (GAN) Brasil-Uruguay”, Informe Final, julio, ResearchGate. [ Links ]
Castilho, M. y Puchet, M. (2012), “Commercial integration and the structure of trade flows in Latin America”, en L. Punzo, C. Feijo y M. Puchet (eds.), Beyond the global crisis. Structural adjusments and regional integration in Europe and Latin America, London y New York, Routledge, Routledge Studies in the Modern World Economy, 106. [ Links ]
CEPAL (2014), “Integración regional: hacia una estrategia de cadenas de valor inclusivas”, CEPAL. [ Links ]
______ (2018), “El rol del MERCOSUR en la integración regional”, Boletín de Comercio Exterior del MERCOSUR, CEPAL. [ Links ]
Corbella, V. (2013), “Integración y flujos comerciales entre países de la UNA-SUR”, Análisis Económico, vol. XXVIII, núm. 69, México, UAM. [ Links ]
Dussel Peters, E. (2012), “Políticas chinas de comercio exterior e inversión extranjera y sus efectos”, en G. Bittencourt (coord.), América Latina frente a China como potencia a mundial: exportaciones e inversión extranjera, Montevideo, Red MERCOSUR , núm. 20. [ Links ]
Dussel Peters, E. y Ortiz, S. (2016), “El Tratado de Libre Comercio de América del Norte, ¿contribuye China a su integración o desintegración?”, en E. Dussel Peters (coord.), La nueva relación comercial entre América Latina y el Caribe-China: ¿integración o desintegración regional?, RED ALC-CHINA y UDUAL, México. [ Links ]
Fergusson, I. y Villareal, M. (2013), “NAFTA at 20: overview and trade effects”, Cornell University ILR School, Federal Publications, Key Workplace Documents. [ Links ]
García, M. y Puchet, M. (2015), “Apertura comercial, grado de integración y estructura de los bloques económicos. El caso de México-EUA, 1970-2009”, en A. Puyana (coord.), Parábolas de la globalización y el desarrollo latinoamericano, FLACSO-México. [ Links ]
González, M. y Larruina, K. (2010), “Integración del MERCOSUR”, Taller Métodos de Análisis de Comercio entre países, Universidad de la República (UdelaR). [ Links ]
Hiratuka, C. (2016), “Impactos de China sobre el proceso de integración regional de MERCOSUR”, E. Dussel Peters (coord.), La nueva relación comercial entre América Latina y el Caribe-China: ¿integración o desintegración regional?, RED ALC-CHINA yUDUAL, México . [ Links ]
Krugman, P. (1990), Rethinking international trade, Cambridge, MIT Press. [ Links ]
Krugman, P. y Venables, A. J. (1996), “Integration, specialization, and adjustment”, European Economic Review, vol. 40, núm. 3-5. [ Links ]
Markusen, J., Melvin, J., Kaempfer, W. y Maskus, K. (1995), International trade. Theory and evidence, USA, McGraw-Hill. [ Links ]
Moreno-Brid, J., Puchet, M. y Ruiz, P. (2011), “La integración regional de México: condicionantes y oportunidades por su doble pertenencia a América del Norte y a Latinoamérica”, economía, UNAM, vol. 8, núm. 23. [ Links ]
Ons, A. (2017), “¿Cómo fortalecer el comercio intrarregional?”, en Los futuros del MERCOSUR, INTAL, BID, Nota técnica nº IDB-TN-1263. [ Links ]
Prakas, D., Dietzenbacher, E. y Basu, D. (2007), “Economic integration: systemic measures in an input-output framework”, Economic System Research, vol. 19, núm. 4. [ Links ]
Terra, I. (coord.) (2008), Asimetrías en el MERCOSUR, ¿un obstáculo para el crecimiento?, Serie Red MERCOSUR núm. 12, Montevideo. [ Links ]
Vaillant, M. y Ferreira, N. (2015), “Uruguay’s trade policy and specialization over two decades: a gradual and permanent path to trade openness”, Documento de Trabajo núm. 14/15, Departamento de Economía, Facultad de Ciencias Sociales, UdelaR. [ Links ]
Venables, A. J. (2003), “Winners and losers from regional integration agreements”, The Economic Journal, vol. 113, núm. 490. [ Links ]
Viner, J. (1950), The customs union issue, New York, Carnegie Endowment for International Peace. [ Links ]
1Countries are classified mainly by the size of their economies, in terms of normal GDP, as well as by other important variables (see section 2 of this paper).
3See Viner (1950), Balassa (1962), Markusen et al. (1995), Krugman (1990), Krugman and Venables (1996), and Venables (2003).
4For an example, see Terra (2008).
6Tariffs and trade barriers were eliminated between members in the FTZ and each country remains autonomous in its trade policies. On the other hand, the CU adds the adoption of common trade policy to the FTZ.
7While this would be a highly pertinent line of inquiry to follow, it is beyond the reach of this paper to do so.
8As is widely documented in the bibliography, China’s growth and emergence resulted in profound changes and serious impacts on the structure of production, trade, and investment on an international scale. This had significant effects on various countries and regions, including MERCOSUR and NAFTA. For an example, see Bittencourt (2012) and Peters (2012).
10See Bittencourt and Carracelas (2015), Ons (2017), and CEPAL (2018).
11See Moreno-Brid et al. (2011).
Received: September 19, 2018; Accepted: January 15, 2019
 Este es un artículo publicado en acceso abierto bajo una licencia
Creative Commons
Este es un artículo publicado en acceso abierto bajo una licencia
Creative Commons
