


 nueva página del texto (beta)
 Inglés (pdf)
 Artículo en XML
 Referencias del artículo
 Enviar artículo por email
 Citado por SciELO
  Similares en
SciELO
Similares en
SciELO 
 Permalink
1. Introduction
Information and Communication Technologies (ICT) are essential to enhance the competitiveness, innovation and productivity, economic growth and development of countries (Alderete, 2016; Balboni et al., 2011; Koutroumpis, 2009; Brynjolfsson and Hitt, 2003). Therefore, it is of main interest to study which factors explain ICT penetration.
ICT access differs among continents and also within the same continent. Broadband infrastructure and investment in fiber are different in North America, Europe and Asia. However, in many developing countries broad-band access is still limited (ITU, 2013).
A popular concept to understand this difference between countries is the digital divide which refers to the inequality in ICT access and ICT use at the household or country levels. Firstly, this concept referred to the gap between those with Internet access and those without (NTIA, 1990); it was known as the first-level digital divide. As people increasingly gained access to the Internet, this concept turns into the second-level digital divide by focusing on the inequities of Internet use (Hargittai, 2003).
The International Telecommunication Union (ITU) distinguishes among ICT readiness, which reflects the level of networked infrastructure and access to ICT; ICT use, meaning the level of intensity of ICT in the society and finally, ICT impact, related to the results or outcomes of more efficient and effective ICT use (relevant ICT skills). A country can have an adequate ICT infrastructure (such as fiber optic network) but individuals in general do not have access to modern devices such as PC, or smartphones (leading to barriers in ICT access) . On the other side, a country can have an adequate ICT infrastructure and access, but individuals have a low ICT use (ICT demand) due to low digital readiness or skills. “Advancing through these stages depends on a combination of three factors: the availability of ICT infrastructure and access, a high level of ICT usage, and the capability to use ICTs” (ITU, 2017, p. 26).
Hence, broadband penetration depends both on supply and demand factors. In respect to the fixed broadband, the demand gap which is the percentage of households that can actually access a fixed broadband service but choose not, is significant (Katz, 2013). Countries with the lowest fixed broad-band coverage are Bolivia and Peru. Excluding the aforementioned cases, the demand gap varies from 88% (Ecuador) to 38% (Chile); being Chile the best positioned country in terms of broadband penetration (Alderete, 2017).
On the other side, during the last years, mobile broadband penetration has considerable increased in Latin America. In the region, mobile subscriptions penetration rates go from 37% in Mexico to 77% in Costa Rica, being the lowest and highest rates respectively. While some countries are leaders in mobile broadband diffusion, others are lagging behind. Only 10% of Latin American population are not covered by mobile broadband, and 57% of population is covered but do not subscribe to mobile broadband. Thus, most of Latin Americans who have coverage do not use the mobile broadband. This indicates a significant gap in demand despite network availability GSM(Intelligence, 2016, p. 4). Some of the main reasons explaining this gap are absence of locally relevant content (web traffic data shows that less than 30% of content is in local languages) and lack of digital skills and affordability (Katz, 2013).
The broadband explosion that began in 2010 has led to the third phase in the IT sector. The second phase was characterized by the mobile revolution investments. However, many investors left Latin America because of difficulties in the countries and failure of their business strategies and policies (World Economic Forum, 2016). Changes in penetration rates are not due to a single factor; several factors or variables must be analyzed. Some studies have stressed the factors influencing the adoption decision, such as the ICT adoption costs (prices of the services), human capital, growth of the economy and level of income (Comin and Hobijn, 2004; Hall and Khan, 2003). A study by Horrigan (2015) for American citizens shows that 36% of non-adopters state that the main reason for not having broadband is cost-related (including monthly access fee, computer cost, activation fee, and a combination of reasons). Most of them have an economic nature. However, differences in per capita GDP, for instance, have a limited influence on ICT penetration (GSM Association, 2014). In fact, ICT adoption rates diverge across countries regardless of their income levels (Erumban and de Jong, 2006). There is evidence that adoption rates differ significantly across countries with similar economic situations (Van Ark et al., 2002; Meijer and Ling, 2001). This divergence is due to both economic and non-economic factors (Erumban and de Jong, 2006).
In this line, some authors highlight the role of non-economic variables in the ICT adoption decision (Pavlyuk, 2011; Billon et al., 2009; Erumban and de Jong, 2006). The socio-cultural environment, institutions and political atmosphere lead to similar ICT adoption patterns (Billon et al., 2009; Flamm, 2005). Flamm (2005) models the determinants of broadband penetration in the United States. He applies it to a zip code level database and suggests that state policies matter. Moreover, Pavlyuk (2011) states that geographic proxi‑mity may affect the ICT penetration rates. The author examines the spatial distribution of telecommunications in the European Union and finds significant positive spatial effects. Higher broadband rates in neighbor countries have a positive impact on broadband adoption in a given country. This fin‑ding provides a baseline for a spatial effects analysis in Latin America.
This paper mainly contributes to examine the impact of the spatial effects on the fixed and mobile broadband penetration in Latin America. The spatial effects are supported both from supply and demand sides. The research question to be addressed is: Does geographic distance explain the fixed and mobile broadband penetration within Latin American countries? Do neighbor effects matter? Only a few studies have considered the neighbor effects or geographic proximity among countries to explain ICT penetration (Pavlyuk, 2011; Billon et al., 2009). However, this is the first attempt to examine the spatial effects related to the fixed and mobile broadband penetration in Latin American. This paper focuses in both fixed and mobile broadband because fixed broadband penetration is usually lower than mobile broadband penetration in developing countries (World Bank, 2016). Moreover, mobile phones have proven to be one of the most important technologies for low-income countries, overtaking fixedline phones and fixed broadband.
The research is structured as follows. The next section describes the state of the art. Section 3 offers a theoretical framework, by adding different approaches related to ICT adoption and assessing the review of empirical literature. In the section 4, methodology and data are explained. In the last sections, results and discussion obtained from the estimated model are analysed, and conclusions are developed at the end.
2. State of the art
The Latin American region is on the border between emerging and transitional economies based on the digitization index (Katz et al ., 2013), which constitutes a measure of a country’s progress on the path to digitization development.1 While Chile is the best-positioned country in the region, Cuba, Bolivia and Nicaragua are at the bottom (Alderete, 2017).
Katz and Callorda (2018) argue that Latin American countries can be classified in advanced countries and developing countries. Among advanced countries in terms of supply and penetration of broadband services are Argentina, Brazil, Chile, Colombia, and Costa Rica. This group needs to focus on policies that promote next generation broadband network deployment. On the other side, Bolivia, Paraguay, Peru and Ecuador correspond to the developing countries group, but while Bolivia and Paraguay are at the bottom stage of broadband development both in terms of supply and demand, Peru and Ecuador achieve an intermediate stage covering an advanced percentage of the population combined with low penetration. While Bolivia and Paraguay need to implement policies to stimulate the demand and universalize digital literacy; countries with very low broadband development must focus on affordability initiatives.
Moreover, some countries follow a public-operator model (Argentina and Brazil) where the government assumes a long-term public investment for the operation and modernization of the network. Private are expected in the last-mile segment. Other countries have a public-private partnership (PPP) model (Colombia, Mexico and Chile) where public and private investments in the network are coordinated ex ante. Therefore, it is likely to associate national variations in regulatory policy.
Mobile broadband is the most dynamic market segment; globally, mobile broadband penetration reaches 47% in 2015, a value that increased 12 times since 2007 (ITU, 2015). In Latin America, mobile broadband has increased on average from 8.27% in 2011 to 44% in 2015. On the other side, fixed broadband penetration was more stable in most of the countries of the region going from 5.63% in 2011 to 8.7% in 2015. While Uruguay is the country with the largest mobile and fixed broadband penetrations, the two-worst positioned countries are Honduras and Nicaragua. Figure 1 shows the evolution of mobile and fixed broadband penetration in the years 2011 and 2015 in the Latin American countries.
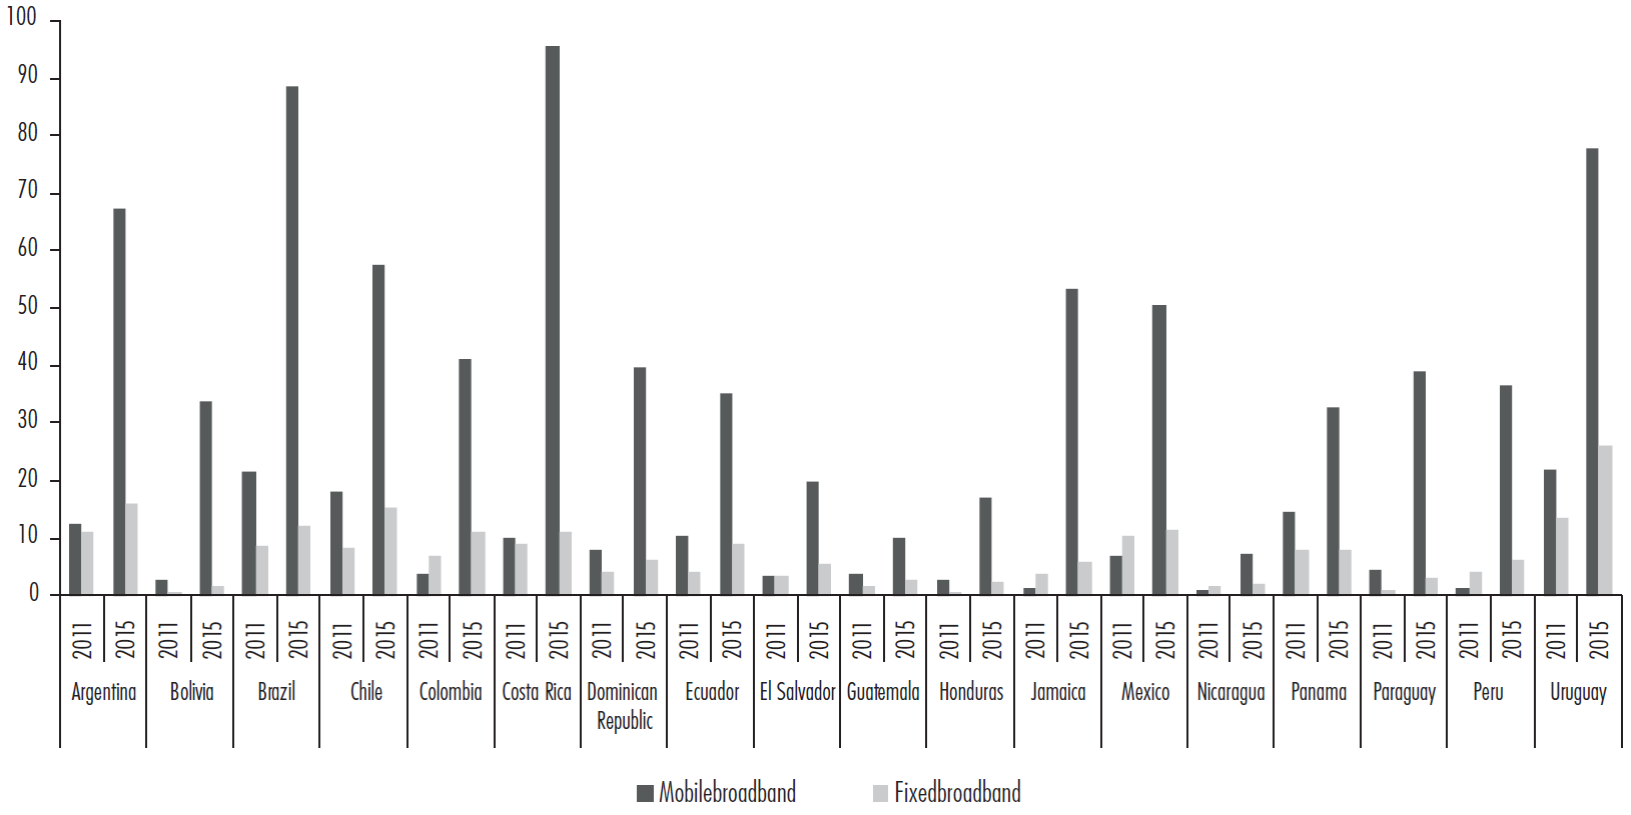
Source: the author based on ITU, 2011-2015.
Figure 1 Mobile broadband penetration growth in Latin American countries
Broadband coverage significantly diverges among countries in the region. In terms of supply, the region needs to enhance the speed of the bandwidth. On average, speed in Latin America is six times lower than in Europe (CEPAL, 2015). Operators have invested heavily in their infrastructure over the past three years, with capital expenditures set to increase further to support mobile broadband network deployments (GSM Intelligence, 2016). Several factors impact the deployment of mobile broadband networks, notably the timely allocation and assignment of required 3G/4G spectrum in each country, as well as macro-economic conditions that can influence investment decisions (Voltornist, 2014).
The migration to mobile broadband is being driven by a higher availability and affordability of smartphones, more extensive and deeper network coverage, and in some cases by operator handset subsidies. Countries with the cheapest mobile broadband are Chile, Argentina, Uruguay and Costa Rica, based on the prices of mobile broadband published by DIRSI.2 Moreover, countries differ in their fiscal policy. There are high mobile specific taxes in countries such as Brazil and Argentina. Latin American countries impose different import taxes. For instance, importing switches routers and modems might cost a 20% more in Argentina and Venezuela due to import duties. Similarly, import duties are 16% in Brazil and Uruguay. Hence, a possible regulation is the reduction of network equipment import duties (Katz and Callorda, 2018).
3. Literature review
There is a wide set of economic, social, institutional, political, and cultural factors that might explain differences in ICT diffusion among countries. Social differences among countries, related to income, urbanization and digital skills, are important factors in the process of broadband growth, apart from the technical or economic characteristics.
Culture has a significant effect on consumer behavior and technology diffusion. Since countries differ in terms of national culture, some authors have studied how differences in national cultures are transformed into differences observed in ICT adoption across countries (Nehari Talet and Al-Wahaishi, 2011; Zhao, 2011; Erumban and de Jong, 2006). In this vein, Hofstede (1984; 2001) and Trompenaars (1993) had observed that differences in the national culture are supposed to influence the way people interact and make use of their environment. Hence, we can expect that countries with different/ similar cultures will achieve different/similar ICT penetration rates. Hence, if we treat spatial proximity as a proxy of cultural proximity (Parent and Lesage, 2008; Oerlemans and Meeus, 2005), we might expect that neighbor countries in the Latin American region might achieve similar levels of broadband penetration.
Niles and Hanson (2003) pointed out that countries with spatial proximity may influence one another in their ICT development. The authors have argued that spatial proximity is likely to result in relational proximity when there are increased interactions. In the same vein, Pavlyuk (2011) analyses the possible dependencies between neighboring countries of broadband adoption in EU member states. The author shows significant positive spatial effects. According to the social influence theory (Agarwal et al., 2009) an individual’s Internet adoption behavior may be influenced by the Internet adoption behavior of the individual’s spatial peers. Such neighbor effects can operate via two different mechanisms: the informative effect (i.e., learning about product quality) and the persuasive effect (i.e., social normative pressure) (Janakiraman and Niraj, 2011).
On the other side, ICT diffusion patterns are also the result of the influence of supply and demand factors (Karshenas and Stoneman, 1995). Several countries have attempted to develop ICT through heavy ICT investments over the years (Doong and Ho, 2012). The lack of required infrastructure is considered one of the main barriers causing a low broadband penetration. Anyway, the distribution of resources diverges among countries. For instance, there is more communication fiber in the Asian, North American and European continents than in Africa (Doong and Ho, 2012), and this divergence extends within countries. Similarly, one would expect that a greater level of ICT infrastructure would lead to greater diffusion rates of some technologies (Chinn and Fairlie, 2007). The ICT adoption as well as broadband penetration is directly related with economic development (Horrigan, 2015; Kyriakidou et al., 2011; Holt and Jamison, 2009; Samoilenko and Osei-Bryson, 2008). Socio-economic factors (particularly income) explained broadband adoption more than price, even when controlling for service access (Horrigan, 2015). Moreover, Falch (2007) suggested that income affects broadband penetration rate as subscribers are concentrated in countries with high Gross Domestic Product (GDP). On the other side, Billon et al. (2009) observes that high income economies concentrate a large percentage of broadband subscribers. Besides, wealthier countries are considered to have more resources at their disposal in ICT deve‑lopment and may have created a higher level of ICT development (Doong and Ho, 2012, p. 1).
On the other side, education plays a crucial role to the usage of broad-band services (Horrigan, 2009). Human capital is expected to facilitate ICT diffusion because countries with more educated people will be prone to adopt and use innovations (Crenshaw and Robison, 2006; Kraemer et al., 2005). Households with lower levels of education evidence a remarkably lower level of adoption (Katz, 2013).
Public policy is an important factor to shape telecommunication development. Katz and Callorda (2018) state that the regulatory framework and public policies represent critical enablers of the digital ecosystem development, such as spectrum management and tax incentives. Broadband plans in Latin American countries exhibit common patterns as well as differences (Galperín et al., 2013). The main policy tools in the telecommunications sector have been public financing and investment in networks and equipment; government participation in the networks’ functioning, and an active industrial policy. Proliferation of national broadband plan is an evidence of the implementation of those policies to promote telecommunications.
Galperín et al. (2013) argues that broadband initiatives in Latin America mainly centre on extending coverage and enhancing competition in the wholesale segment of the network. In technologically developing nations, a competitive telecommunications sector and higher investment in ICT lead to greater broadband diffusion (Gulati and Yates, 2012, p. 749). However, considering that Latin American countries have public sector budget constraints, telecommunication investment can mainly increase based on the private investments (Katz and Callorda, 2018). Therefore, regulatory policy has a role in promoting investments in the telecommunication sector, for instance, for deployment of last generation broadband infrastructure.
Since Latin America and Caribbean countries are heterogeneous in terms of broadband penetration, policy recommendations should not be uniform. In Colombia, broadband diffusion policies search to find solutions to boost the broadband market. However, the existence of several market imperfections or failures means that there are problems in solving these inefficiency issues. The regulatory system must guarantee competitive conditions, the protection of users and transparency to properly estimate the temporal horizon of connectivity diffusion (Martínez Coral, 2013 in Alderete, 2017).
In respect to ICT affordability, we should include both the prices of ICT services and the income level of users to reflect the financial constraint to pay on the demand side (World Bank, 2016; Galperín et al., 2013). Since mobile broadband tariffs are cheaper than fixed broadband’s, mobile broadband has become more affordable. Kiiski and Pohjola (2002) find that a 50% reduction in Internet access cost would raise the number of computer hosts per capita by 25% over a 5-year period. On the contrary, other authors do not find a significant influence of telecommunication prices on ICT diffusion (Chinn and Fairlie, 2007; Hargittai, 1999).
On the other side, unemployment is considered an explanatory factor of ICT adoption. Dwivedi and Lal (2007) examine the impact of socio-economic determinants of broadband adoption such as occupation. The employment status of the consumers has a positive correlation to the internet access rates; economically active households are more likely to access to Internet (Anderson et al., 2002). On the contrary, Dwivedi and Lal (2007) find that the largest number of broadband adopters were unemployed citizens. Some reason could be that unemployed people live with other family members who are employed (Rice, 1997). Besides, Freeman (1995) argues it is more likely that unemployed people become the adopters of broadband than non-adopters. Unemployed people may be engaged in a re-skilling process in order to get employed. Therefore, since ICT promotes the process of re-skilling, it is more likely that unemployed people become the adopters of broadband.
Apart from that, some authors focus in the role innovation plays to promote ICT adoption (Hempell et al., 2006). Although there are some empirical evidence and case studies identifying innovation as a key factor for ICT implementation success, quantitative studies in this research field are scarce. Some exceptions are Licht and Moch (1999), and Hempell (2002) that examines the relationship between ICT and product and process innovations in services firms.
Furthermore, the deployment of mobile broadband networks in countries with large population sizes influence coverage results at regional and global levels (Voltornist, 2014). Population could facilitate information and knowledge about new technologies, sometimes transmitted through face-to-face communication. Demographic factors such as population size, or population density are associated with the cross-country digital divide (Bagchi, 2005; Chinn and Fairlie, 2007; Quibria et al., 2003). A higher population density may lead to a higher level of broadband adoption since people living in such areas usually don’t face digital exclusion (Strover et al., 2004; Wood, 2008). In developing countries, urban population is positively associated with the ICT adoption (Billon et al., 2009).
4. Methodology
The objective of this study is to determine if geographic proximity may be a significant factor to explain the fixed and mobile broadband penetration in Latin American countries. To achieve this goal, we use a five year period 2011-2015 for fixed broadband and a three period, 2011-2013 for mobile broad-band through a panel data for 18 Latin American countries. Since mobile broadband penetration has recently been adopted in the region, long-term data series in the subject are missing, especially related to mobile broadband prices. Besides, data is missing for a few countries in the region, such as Barbados, Cuba, Venezuela and Haiti. On the other side, we employ data on mobile penetration from the International Telecommunication Union and due to changes in the methodology to measure mobile broadband in 2013 (the concept becomes wider), we use a shorter period than fixed broadband’s.
We estimate a spatial fixed effects panel data model. This type of model assumes that certain characteristics of an individual country may have an influence on the mobile broadband penetration (direct effect). By using spatial econometric estimation techniques, the spatial dependence effect and the impact of mobile broadband adoption in one country on the broadband penetration in neighbor countries (indirect effect) can be measured.
This paper employs the geographic distance or proximity between countries i and j as the criterion to select the weightings w i,j . Events in one country are frequently related to phenomenons taking place in bordering countries (Herrera Gómez et al., 2011). We use a spatial contiguity matrix based on the assumption that any country spatially interact with its geographic neighbors. In order to measure this interaction, we employ data from geographic coordinates. A country is treated as a geographic neighbour of another if their distance is below the band of 20. Anselin (1988) explains that a country i is considered neighbour of a country j if j falls within a specified critical distance (distance bands) of i.
A possible explanation for the existence of geographic linkages in broad-band penetration can be associated to the demand and supply sides of broad-band penetration. On the supply side, explanations are due to the decisions of telecommunication investors seeking economies of scale and diversification. On the demand side, there are issues related to regulation policies, affordability of the service, lack of local content and digital skills.
We choose a contiguity spatial weight matrix named W. All neighbours of an observation (w ij = 1 if i and j are neighbours) have the same weight in that matrix. This square matrix has 18 rows × 18 columns corresponding to the 18 Latin-American countries examined. W is a binary contiguity matrix, symmetric and row normalized (Elhorst, 2010). Even though the coefficient estimates can be severely distorted if the choice of a spatial weights matrix is wrong, it is unlikely that this really happens if spatial dependence is strong (Stakhovych and Bijmolt, 2009).
Besides, we use Moran’s I test (Moran, 1950; Cliff and Ord, 1981), which measures the presence of global spatial autocorrelation, to determine whether mobile broadband penetration presents spatial patterns.
Where n is the number of countries or spatial units indexed by
i and j (N=18);
y is the dependent variable: fixed/mobile broadband
penetration;
After controlling for spatial correlation, we estimate a spatial panel data model to detect explanatory factors of broadband penetration at country level. We use the Spatial Durbin Model (SDM), which is an extended type of the Spatial Autoregressive Regression (SAR). This model adds the lag dependent variable and the spatial lag of independent variables (Anselin, 1988). We choose this model because the dependencies in the spatial relationships take place both in the dependent and independent variables (Anselin, 1988; Brasington and Hite, 2005; Kissling and Carl, 2007; Dell’Erba et al., 2013). Compare to the SAR and Spatial Error Model (SEM) models, the SDM model achieves some advantages (LeSage and Pace, 2009). In particular, the bias problem due to omitting certain variables does not alter the model (Levratto, 2014) and it does not enforce previous restrictions on the magnitude of potential spatial spillover effects (Le Sage and Pace, 2009).
The SDM model is determined by the following equation:
Where Θ corresponds to the spatial dependence effect of the explanatory variables on the outcome variable, using a spatial average of each neighbours.
WY represents the endogenous interaction effect among the dependent variables, and WX the exogenous interaction effect among the independent variables.
Besides, the scalar parameter rho, which is the spatial lag coefficient for the outcome variable, measures the complete spatial dependence between the observations in the dataset (Kirby and LeSage, 2009). The bounds of this scalar parameter are -1/w min and 1, such that w min is the smallest characteristic root of the spatial weights matrix (Elhorst, 2010). If the spatial lag coefficient is positive, it denotes positive product space spillovers. On the contrary, if the rho parameter is negative, it denotes negative spatial spillovers. We use the maximum likelihood (ML) method to estimate the SDM model (Anselin, 2010).
SDM should be used when one believes that there are omitted variables in the model that are spatially correlated and that, in addition, these spatially correlated omitted variables are correlated with an excluded variable in the model (LeSage and Pace, 2009). SDM is the correct model each time these two conditions hold (Levratto, 2014). In this model, a possible omitted variable may be a measure of speed of connections, perceptions of usefulness, telecommunication regulations, among others.
Data and Variables
Dependent variables
Fixed Broadband penetration (fixed broadband): Fixed-broadband subscriptions per 100 inhabitants. Source: International Telecommunications Union (ITU). Years: 2011 to 2015.
Mobile Broadband penetration (mobile broadband): Active mobile-broad-band subscriptions per 100 inhabitants. Source: International Telecommunications Union (ITU). Years: 2011 to 2013.3
Independent variables
Telecommunication investment (itelecom): Investment in telecom projects with private participation that have reached financial closure and directly or indirectly serve the public. Data are in current U.S. dollars. Source: The World Bank. The higher the telecom investments, the higher the mobile broadband penetration will be.
ICT affordability (price): Least expensive post-paid mobile broadband 1GB and least expensive fixed broadband plan as percentage of GDP. Source: DIRSI. It measures the ICT affordability, the higher the ICT service cost, the lower the penetration.
Gross Domestic Product (GDP): The sum of value added by all resident producers plus any product taxes (less subsidies) not included in the valuation of output plus net receipts of primary income (compensation of employees and property income) from abroad. Data are in constant 2010 U.S. dollars, per capita. Source: The World Bank. The Gross Domestic Product is included to control for economic development differences among countries. The higher the GDP, the higher the mobile broadband penetration will be.
Unemployment (unemployment): Rate of unemployment as percentage of total labour force. Source: The World Bank. Unemployment refers to the share of the labour force which is not working but is seeking employment. It is expected, ceteris paribus, that higher unemployment rates will lead to higher mobile broadband penetration.
Innovation (trademarks): Applications to register a trademark with a national and regional Intellectual Property (IP) Office. A trademark is a distinctive sign which identifies certain goods or services as those produced or provided by a specific person or enterprise. Source: The World Intellectual Property Organization (WIPO). This variable measures the impact of innovation on the ICT penetration. The more innovative the country, the higher the mobile broadband penetration is expected.
Education (education): The secondary gross enrolment ratio. The total enrolment in secondary education, regardless of age, expressed as a percentage of the eligible official school-age population corresponding to secondary education in a given school-year. It is one of the ICT skills indicators published by ITU and represents human capital. The more educated the inhabitants, the higher the ICT penetration will be.
Population density (popdensity): Population density is midyear population divided by land area in square kilometers. Population definition counts all residents regardless of legal status or citizenship--except for refugees not permanently settled in the country of asylum. Source: The World Bank.
We could have employed the Ease of Doing Business index as a proxy to measure telecommunications regulatory framework. However, there are some methodological problems: In 2015 the index changed the methodology, so we have different scores from 2015 according to the methodology employed. Moreover, Brazil and Mexico only have data for the years 2014 and 2015, and Chile is missing for the whole period. The lack of availability of a telecommunication regulation variable also reinforces the usefulness of estimating a SDM model.
Table 1 summarizes information on the descriptive statistics of the variables included in the model.
Table 1 Descriptive statistics
| Variable | Obs | Mean | Std. Dev. | Min | Max |
| mobilebroadband | 90 | 26.25333 | 22.52499 | 1 | 95.5 |
| itelecoms | 90 | 3.01e+09 | 1.20e+10 | 1.20e+07 | 1.11e+11 |
| unemployment | 90 | 6.771044 | 3.293392 | 2.3 | 15.25 |
| trademarks | 90 | 24911.8 | 41166.89 | 0 | 163422 |
| gdp | 90 | 11313.34 | 5.318.963 | 3535.39 | 22536.62 |
| education | 90 | 87.14921 | 14.27698 | 63.53116 | 123.0857 |
| preciopre | 90 | 1.831944 | 2.623818 | .04 | 21.02 |
| preciopost | 90 | 13.57592 | 6.098258 | 2.29299 | 32.48 |
| popdensity | 90 | 83.06172 | 86.99617 | 9.303372 | 304.6563 |
Source: own elaboration.
5. Results and discussion
To test the existence of spatial clustering, we calculate the global Moran’s I test statistics for the dependent variables in each cross section. Moran’s I and Geary’s C indicate a clear spatial autocorrelation for the fixed broadband variable, but a non-clear one for the mobile broadband (Table 2). Moran always approximates a positive spatial autocorrelation for fixed broadband. In the mobile case, it suggests a negative spatial autocorrelation which is non-significant, except for the year 2011 with a positive and significant spatial autocorrelation. In the same vein, Geary’s C indicates a positive spatial auto-correlation for the fixed broadband but a non-significant (except for the year 2011) negative spatial autocorrelation for the mobile broadband.
Table 2 Moran’s I and Geary’s C values for broadband penetration
| Fixed broadband | Mobile broadband | |||||||
| years | 2011 | 2012 | 2013 | 2014 | 2015 | 2011 | 2012 | 2013 |
| Moran’s I | 0.202** | 0.251*** | 0.286*** | 0.323*** | 0.309*** | -0.049 | 0.183** | -0.051 |
| Geary’s C | 0.726* | 0.672* | 0.603* | 0.560* | 0.575* | 1.145 | 0.520** | 0.671 |
Note: ***, **, * statistically significant at 1, 5 and 10% respectively.
Source: own elaboration.
Afterwards, a SDM model is estimated (Table 3) to examine the neighbour effect contribution to the fixed and mobile broadband penetration of a group of 18 Latin American countries during the period 2011-2015. Based on this specification, the broadband penetration of a country might be affected by its own socio-economic indicators and those of their bordering countries. Based on the literature review, we examine a spatial model to explain the phenomenon of broadband penetration. We estimate two models: Model 1, for fixed broadband and Model 2 for mobile broadband. We only show the coefficients and their significance for the total effects (Table 3).
Table 3 SDM estimation results
| Fixed broadband | Mobile broadband | |||||
| coefficient | Z | p-value | coefficient | Z | p-value | |
| Spatial rho | .3423042 | 2.62 | 0.009 | -1.113192 | -3.49 | 0.00 |
| Variance sigma2_e | .7284547 | 3.04 | 0.002 | 1.3626770 | 4.73 | 0.00 |
| Itelecom | -4.42e-10 | -1.30 | 0.195 | -2.18E-08 | -2.81 | 0.005 |
| Unemployment | -1.478320 | -2.25 | 0.024 | 5.119.187 | 1.45 | 0.147 |
| Trademark | -.001214 | -2.77 | 0.006 | -0.0014141 | -2.61 | 0.009 |
| GDP | .0038004 | 2.36 | 0.018 | 0.0506259 | 9.56 | 0 |
| Education | .2938843 | 1.01 | 0.313 | -0.0000105 | -0.88 | 0.379 |
| Price | .9094365 | 1.33 | 0.183 | -0.0235091 | -0.08 | 0.938 |
| Popdensity | -.139285 | -0.44 | 0.660 | 1.684998 | 2.6 | 0.009 |
| R-sqwithin | 0.6485 | 0.7276 | ||||
| Between | 0.0689 | 0.0007 | ||||
| Overall | 0.0733 | 0.0012 | ||||
| Log-pseudo Likelihood | -114.4830 | -152.5662 | ||||
Source: own elaboration.
The importance of the spatial dependence phenomenon is confirmed by the significant value of Rho which is equal to 0.34 and significant at 1% for the fixed broadband model. This positive spatial dependence result is similar to Pavlyuk (2011) and Billon et al. (2009). However, in the case of the mobile broadband, and contrary to the fixed broadband, the spatial proximity shows a negative sign. A possible explanation is that countries are more divergent in terms of mobile broadband, even in the case of neighboring countries. Contrary to fixed broadband which is reaching saturation levels in most of the countries (which does not mean high levels), mobile broadband has become a substitute rather than a complement of fixed broadband reaching higher and different levels among countries. A major difference between developed and developing countries is that, in developed countries, mobile broadband is often a complement to rather than a substitute for fixed-broadband access (ITU, 2013). Moreover, in Latin America supply factors could be more important than demand factors to explain this type of connectivity.
Moreover, many authors have stressed the cultural heterogeneity among Latin American countries (Lagos, 2008; García Canclini, 2001; Achugar, 1996). Although the analysis of cultural heterogeneity is beyond the scope of this paper, the main idea is that heterogeneity (structural and cultural) is one of the characteristics of socio-cultural formations in Latin America.
The penetration level of the population and the operator’s market share determine the operator’s subscribers’ basement. However, the negative impact of the mobile broadband penetration of neighbor countries on the mobile broadband penetration of a country may be explained by the supply side of the market. Economic, political and institutional reasons may discourage ope‑rators’ investments in spite of competition or scale economies. Therefore, market conditions should be appropriate to invest in bordering countries in spite of the scale economies.
In the Latin American market, same as in the global market, there is a tendency towards a higher concentration of network operators, since economies of scale are necessary to confront with the high investment levels and operation and maintenance expenditures required. In the last four spectrum tenders, only incumbents and existent operators that were already bringing services in the country participated (such as Colombia, Chile, Brazil, Mexico and Peru). This situation differs from the fixed broadband market which is more diversified with more operators. On the other side, the mobile broad-band market in Latin America is less competitive and the number of operators is fewer than in the fixed broadband case (Katz, 2013) reducing the influence of neighbor penetration.
On the other side, if neighbor countries perform a better policy and therefore attract more telecommunications and mobile broadband investments, they will have a higher broadband penetration than the host countries. For suppliers, it is easier and cheaper to provide broadband connection in adjacent areas (Pavlyuk, 2011), unless political or institutional instability of neighbor countries discourage exploiting these advantages due to increase installation and maintenance costs.
Therefore, the institutional factor plays a strategic role for mobile broad-band adoption. A country might concentrate an adequate number of competitors but if the laws ruling the ICT sector are weak, the incentives to increase the broadband coverage will be lower. For instance, El Salvador in Central America is the worst positioned country in these terms (Revista Summa, 2015). On the other side, Colombia distinguishes in the region in respect to the number of competitors in the mobile broadband sector. Colombia has a comparative advantage in terms of the IT sector laws in South America.
Before examining the results obtained in terms of the significance of the variables, we should remind that total effects should be significant in these models. It is not sufficient to have a significant direct or indirect effect if the total one is not. In the case of the GDP, both the direct and indirect effects are positive in the mobile and fixed broadband models. Therefore, the spatial effects are strong in GDP. Since we are examining the Latin American region, it is reasonable that economic growth in a country will lead to spillover effects on neighboring countries.
For each 10% increase in GDP, the mobile broadband penetration rate increases in 0.5% (model 2) while the fixed broadband increases in 0.04% (model 1). This result confirms the potential growth of mobile broadband compare to fixed broadband. Income or GDP has a significant and positive effect on broadband adoption, as many researchers have already proved (Doong and Ho, 2012; Holt and Jamison, 2009; Samoilenko and Osei-Bryson, 2008). Wealthier countries have more resources and, hence, opportunities to create a higher level of ICT development (Doong and Ho, 2012; Kyriakidou et al., 2011). Therefore, the spatial effects are strong in GDP. Since we are examining the Latin American region, it is reasonable that economic growth in a country will lead to spillover effect to neighboring countries.
Besides, unemployment has a significant and negative impact on fixed broadband penetration. This finding contradicts Anderson et al. (2002) but is in line with many authors (Dwivedi and Lal, 2007; Rice, 1997; Freeman, 1995) who find that the largest number of broadband adopters were unemployed citizens.
Moreover, telecom investments have significant and negative effects on mobile broadband penetration. These investments usually imply the allocation of resources in the infrastructure with the consequent development of the broadband. Contrary to some existent results (Billon et al., 2009; Chinn and Fairlie, 2007; Quibria et al., 2003), the higher the telecommunication investments, the lower the broadband penetration will be. A possible explanation is that mobile phone diffusion is less dependent on ICT infrastructure and other factors such as skilled labor (James, 2007), which might explain its wide diffusion in some poor countries. For each 10% in telecommunication investments, mobile penetration reduces in 2.18e-07% in model 1.
Similarly, innovation presents a negative and significant total effect on broadband penetration (fixed and mobile). Hence, the more innovative a country in the region is, the lower penetration of broadband will reach. This result is contrary to Licht and Moch (1999) and Hempell (2002). A possible explanation is that most of the broadband penetration is related to new adopters in Latin America, people that have not yet experienced with the techno‑logy. On the contrary, in Europe most of subscribers are early adopters which are by far the most interested in the ICT advances.
On the other side, population density has a positive and significant effect on mobile broadband penetration. As it was expected, countries with a large population per area are supposed to have a larger penetration of mobile broad-band due to urbanization and informational reasons. However, this variable is not significant for the fixed broadband model reinforcing the potential of the mobile broadband market.
Moreover, a country’s enrolment in secondary school is not significant to explain broadband penetration (neither fixed nor mobile). This result contradicts some authors (Horrigan, 2009; Kraemer et al., 2005) for whom the higher the education level, the better the mobile broadband uptake. A possible explanation is that mobile broadband is simple to use, and we might expect that it does not require advanced levels of knowledge; hence education could be less important for mobile broadband adoption than for fixed broadband’s. However, we cannot confirm a significant relationship between education and fixed broadband. This result could likely be related to the avai‑lable data in the region.
Besides, the ICT affordability, measured by the broadband price is found non-significant for both the fixed and the mobile broadband penetration. A possible reason of this non-significant result might be the data set. Therefore, we cannot state the demand gap in Latin America is mainly caused by afforda‑bility reasons. This result is in line with Horrigan (2015) and Hargittai (1999).
6. Conclusions
The objective of this paper is to examine the hypothesis of spatial effects on the fixed and mobile broadband penetration in the Latin American region. We estimate a Spatial Durbin Model (SDM) to address the research question if neighbor effects could explain the broadband penetration of a country.
Previous studies have analyzed the spatial distribution of telecommunications in the European Union (Pavlyuk, 2011; Billon et al., 2009) but there are no contributions in this subject in the Latin America region. Recent statistics show that while the rate of growth of fixed broadband is converging to a stable level, the mobile broadband is increasing at an exponential rate, especially in the developing countries. Hence, we use not only the fixed broad-band but also the mobile broadband penetration as the main ICT indicators in the region.
Results obtained suggest a significant spatial effect of the broadband penetration. However, while we have obtained positive spatial effects for the fixed broadband (confirming previous studies in Europe), the spatial effects are negative for the mobile broadband model. On the one side, the higher the fixed penetration in neighboring countries, the higher the penetration rate will be in the country. On the other side, the higher the mobile penetration in neighboring countries, the lower the penetration rate will be in the country. One possible explanation comes from the supply side of the mobile broadband market. Political and institutional reasons may discourage operators’ investments in spite of competition or scale economies reasons. On the other side, it highlights the need to enlarge the data set as we have just taken into account three years. On the other side, mobile penetration is related to local usefulness of mobile contents. Hence, cultural heterogeneity among Latin American countries could discourage the neighbor effects. Contrary to many authors (Doong and Ho, 2012; Kyriakidou et al., 2011), our results suggest a negative and significant impact of the spatial effects on mobile penetration. Thus, in the Latin American region, a convergent process is expected among neighboring countries with similar levels of fixed broadband penetration rates. On the other side, a divergence process could be expected with a set of non-neighboring countries more mobile penetrated than others.
Moreover, based on the estimated model, income has positive and significant spatial effects. This result may corroborate the idea that there are divergences within the Latin American region, where countries are grouped or cluster according to their income levels, such that neighbor countries usually achieve similar levels of GDP.
While fixed broadband depends negatively on unemployment and innovation, mobile broadband penetration depends negatively on telecom investments and innovation but positively on population density. Mobile broadband diffusion is less dependent on ICT infrastructure which might explain its wide diffusion in some poor and less innovative countries.
The State accomplishes a main role to promote broadband adoption. Some areas to be promoted are the deployment of electronic government to increase the value of the broadband services and the implementation of subsidy programs for the acquisition of devices. Besides, it is important to foster an environment that encourages entrepreneurs to build local applications. Government policies and plans that support tech innovations and start-ups are critical to this cause. Mobile operators can provide the local talent with opportunities to incubate and scale these startups and innovations.

