


Servicios Personalizados
Revista
Articulo
 texto en
  Inglés (pdf)
 Artículo en XML
 Referencias del artículo
 Enviar artículo por email
Indicadores
-
 Citado por SciELO
 -
 Accesos
Links relacionados
-
 Similares en
SciELO
Similares en
SciELO
Compartir

 Permalink
Problemas del desarrollo
versión impresa ISSN 0301-7036
Prob. Des vol.50 no.196 Ciudad de México ene./mar. 2019
https://doi.org/10.22201/iiec.20078951e.2019.196.63499
Articles
Public Social Expenditure, Access to Drinking Water and Sanitation for Rural Populations in Latin America
aChimborazo National University, Ecuador. *Email addresses: dpinilla@unach.edu.ec; ytorres@unach.edu.ec, respectively.
The aim of this study is to shed light on the nature of the relationship between public social spending and water and sanitation coverage for rural populations in Latin America between 1994 and 2014. Using generalized least squares, four models were proposed to describe the relationship between the percentage of coverage in both urban and rural populations with public social spending, as well as with other control variables. Their co-integration has also been established. The evidence indicates that there is a highly-consistent positive correlation between public social spending and the level of coverage in those rural populations in which high access costs are normally incurred. These costs increase when there is no nearby water source or participation mechanisms. Therefore, state intervention has been necessary to increase coverage.
Key Words: Public social spending; drinking water; sanitation; rural populations; public infrastructure; econometric analysis
El objetivo del presente estudio es determinar la relación entre el gasto público social y la cobertura de agua y de saneamiento en América Latina (1994-2014). Se estiman cuatro modelos por mínimos cuadrados generales que vinculan los porcentajes de cobertura de las poblaciones urbanas y rurales con el gasto público social y otras variables de control. También se verifica su cointegración. La evidencia indica que el gasto público social tiene una relación positiva y superconsistente con el nivel de cobertura de las poblaciones rurales, que suelen asumir altos costos de acceso, por lo que los aumentos de cobertura han requerido de la intervención estatal.
Palabras clave: gasto público social; agua potable; saneamiento; poblaciones rurales; infraestructura pública; análisis econométrico
Clasificación JEL: C23; H44; H53; L95; Q25
1. INTRODUCTION
One of the Millennium Development Goals (MDGs) was to increase global drinking water coverage from 77% in 1990 to 88.5% in 2015. The state needed to play an active role for this ambition to be realized. On occasion, extensive state intervention was required. The state has honoured its commitment to this by implementing various policies. As pointed out by Gupta et al. (2002), a country´s ability to achieve the MDGs is determined by its public expenditure policies. In order to expand the provision of water and sanitation in rural areas (Watkins, 2006) and increase public investment, it was necessary to expand the fiscal space for investment in the MDGs (Vos et al., 2010). In the case of Latin America, the question has arisen of to what extent the increase in water and sanitation coverage in recent decades is due to state intervention.
Theoretical formulations, such as those made by Mehta et al. (2005) and Ginneken et al. (2011), find that public financing has played a crucial role in paying for coverage increases in developing countries. For Mehta et al. (2005), funds from public financing can be used to develop or rehabilitate infrastructure and finance its operation and maintenance. It can also fund activities such as community capacity building, policy formulation, or supervision of the sector. Ginnekan et al. (2011) highlight the long life of infrastructure, and the need for sufficient maintenance funds to be available. On the other hand, redistribution and market failures require investment and necessitate public intervention.
Understood in this way, it can be seen that Latin American public sectors played a central role in increasing access to water and sanitation, especially in rural populations. It was always unlikely that an increase in coverage would originate from the private sector. Water and sanitation projects require a high initial investment, of both time and money, and offer low rates of return. Therefore, it was always unlikely that the private sector would cover the funding gaps in Latin America. In any case, any private sector participation would always need to be complemented by a strong public sector presence, in order to guarantee its efficiency (Zhang et al., 2005, Estache et al., 2005, Thoenen, 2007). Water and sanitation are sectors with high lost costs and imperfect information, characteristics which tend to be unattractive to investors and can result in an undesirable consumption level (Ginneken et al., 2011). Although there are other sources of financing, such as charging fees to users and private sector or community participation, the need for these sectors to be given high priority in public budgets is clear.
Undoubtedly, increased and more efficient public financing is crucial to cover the costs of higher water and sanitation coverage rates in most developing countries (Mehta et al., 2005). The claim that the private sector has participated in the process of extending coverage for rural populations has little basis in either the theoretical literature or the historical record (Castro, 2007). In this vein, Lockwood (2002) has highlighted the lack of rural water and sanitation provision projects in Latin America and pointed out that costs were generally covered exclusively by users. He has also advocated the need to find approaches that guarantee sustainable public financing.
Authors such as Lockwood (2002), Schouten and Moriarty (2003), or more recently Hutchings et al. (2015), stress that rural water projects, despite being well planned and managed by the communities themselves, require continuous external support, such as financing and technical and management advice, in order to to ensure the quality and success of coverage projects in the long term. In general, public bodies have had to provide this support.
The development and maintenance of public infrastructure is crucial (Sorenson et al., 2011). It is argued that, due to the existence of important economies of scale, average production costs need to be substantially reduced. On the other hand, the high fixed costs and investment requirements must be covered by a natural monopoly. This is because the physical water supply and sanitation network can not be duplicated. If this natural monopoly were privately owned and unregulated, it would charge exorbitant prices and prioritize profit maximization over equity and efficiency. On the contrary, public sector provision would assume its main objective to be universal access and, ultimately, social welfare maximization (Swaroop, 1994, Ginneken et al., 2011).
However, in most developing countries a large amount of the resources allocated to water supply and sanitation comes from users. This is a heavy burden for rural populations. High connection costs and the fact that physical access to the network is difficult have inhibited the expansion of running water and sanitation into peripheral communities. Under such circumstances, an increase in the percentage of the population with access to water and sanitation is only possible with increased public sector intervention (Wolf, 2009).
Following this line of thought, Ginnekan et al. (2011) reiterate that no country has managed to increase access to drinking water or basic sanitation without a substantial increase in public spending. They provide examples such as the cases of Senegal, Burkina Faso, Niger, Benin and Mali, where large public investment programs were the basis for significant improvements in water supply levels. They also forewarn that, although the positive impact of public spending can be accepted as fact, strong institutions are necessary to ensure efficient use of resources and, therefore, certain precautions must be taken. Factors such as governance or low corruption levels are significant determinants of greater public efficiency in water and sanitation provision (Estache and Kouassi, 2002, Hunter et al., 2009).
Ginnekan et al. (2011) find no relationship between expenditure levels and access to water or sanitation. However, they attribute this finding to the low quality of the data and to insufficient time allocated to the revision period. Undoubtedly, the usual methodological problems of investigating the social impact of public expenditure, in both small or heterogeneous samples, present themselves. There is also evidence which contradicts the idea that a country’s income level and the composition of public expenditure effect the influence public expenditure has (Bose et al., 2007).
In an attempt to overcome these methodological challenges, several empirical studies have identified variables that explain the differences in countries. The World Bank (1992) and Shafik (1994) establish a positive and significant relationship with GDP per capita, While Narayan (1995) and Prokopy (2005) conclude that participation of rural beneficiaries is a positive indicator. Years later, Hutchings et al. (2015) would modify this conclusion by specifying that this participation must occur in communities which posses a clear collective initiative, strong leadership, and a transparent institutional framework.
Anand (2006) finds GDP per capita, growth rate, and public social spending to be determinants. He highlights the legacy variable, which is when countries with low coverage rates appear to be anchored to them. Estache et al. (2006) find positive evidence regarding GDP per capita, privatization, low corruption and the size of the agricultural sector. Using Swaziland as a case study, Mwendera (2006), highlights the importance of long-term government financing for bringing existing funding levels up to the required level.
Wolf (2009) finds that there are important differences between rural and urban populations. For example, population density and decentralization have a more decisive positive effect on the rural populations than on the urban populations. In fact, the identification of profound differences between urban and rural provision is not new and in a certain sense appears even obvious. Donaldson (1972) has already highlighted how rural water programs present a completely different set of challenges from those carried out in urban areas. It is impossible to transfer the techniques used in urban provision to small, low-density populations where financial resources are limited. Community participation, financing, technical assistance, and project scale are just some of the dimensions which differentiate the process of water and sanitation provision for rural populations from urban populations. Therefore, the determinants of their coverage levels also appear to be different.
Anillo et al. (2014) highlight the role of governance, especially for rural areas. These variables are even more important than the quantity of water resources or public infrastructure. Along the same lines, Luh and Bartram (2016) speculate that the progress that has been made in rural coverage rates is related to changes in government policies and institutions’ capacity to continue to implement them efficiently and sustainably.
In regards to Latin America and using Bolivia as an example, Sara et al. (1996) stress the need for a coherent set of rules with appropriate incentives in order to ensure that beneficiaries’ targets are met. When comparing groups with similar incomes, Soares et al. (2002) find that rural populations have far more limited access to drinking water than urban population. Pacheco (2013) and LaFleur (2014) identify per capita consumption, the presence of public infrastructures, a female head of household, and a female head of household with a university degree as positive determinants of coverage. Living either in inadequate housing or in rural areas are identified as negative factors. Gómez (2016) points out that high-income urban populations are more likely to have access to water. This is especially true for populations located in the center of the country, as opposed to rural or peripheral areas. Events such as floods or landslides, or belonging to a specific race or ethnic group also reduce the likelihood of having access to drinking water.
It is in this framework that efforts are made to overcome, as far as possible, the limitations discussed and to empirically prove the effective positive relationship between increases in public social expenditure and a greater percentage of the rural population with access to drinking water and basic sanitation in Latin America. This study covers the period 1994-2014, as the existence of certain circumstances during this period make it a useful period to analyze when trying to validate the hypothesis.
Between 1990 and 2015, Latin America had to reduce the number of people without access to drinking water or sanitation by over 50% (Inter-American Development Bank, 2003). This objective was met and even surpassed, thanks to the advances that were made in rural populations (WHO-UNICEF, 2015). As Figure 1 shows, there was a clear increase in the percentage of the population with access to drinking water during the study period. Rural populations in particular benefited, with their coverage increasing from 62% to 83%, an increase of 21%. If we take into account that the combined rural populations in all the countries studied add up to nearly 113 million people for 2014, then during the study period 24 million people obtained access to water. Paraguay and Chile stand out in the country analysis, showing increases of 58% and 37%, respectively.
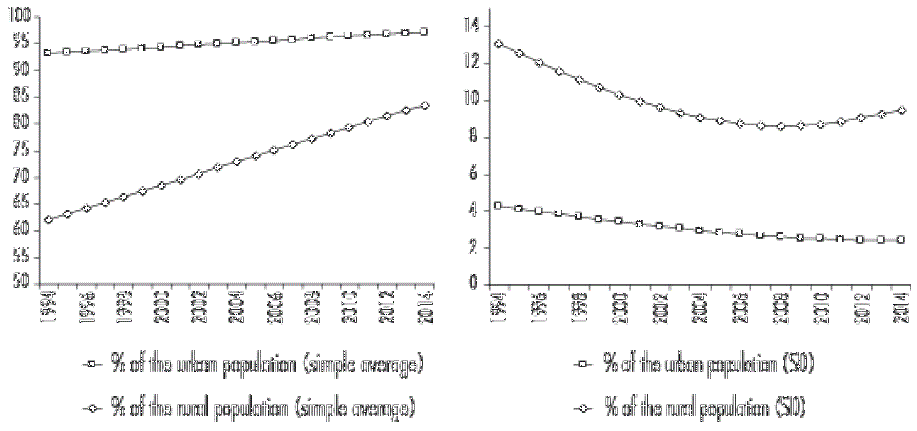
Note: SD-Standard Deviation. Source: Prepared by the authors
Figure 1 Population with Access to an Improved Source of Drinking Water (%) of Urban and Rural Population. Simple Mean and Standard Deviation (Latin America-15 Countries), 1994-2014.
This increase stands in stark contrast to the slight advances in urban populations, where increase averaged just 4% over the study period, with some countries’ coverage rates even decreasing. It is also true that urban areas already had significant coverage rates, 93% on average, when the study period began. An inverse relationship was identified between drinking water coverage and its standard deviation. This trend does not apply to rural populations during the last years of the study period: instead of seeing convergence between their respective water levels, differences between them became wider.
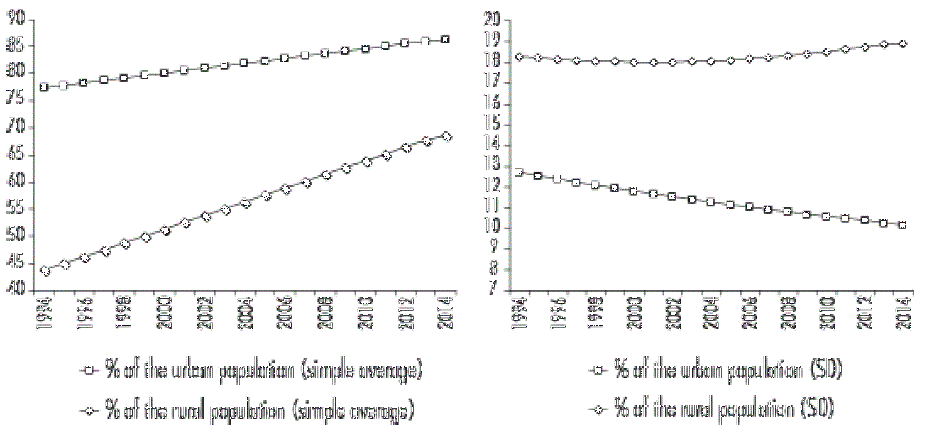
As can be seen in Figure 2, lower basic sanitation coverage rates are lower when compared with drinking water coverage rates. Nevertheless, similar progress was made during the study period. Again, the progress in the rural sector is the most remarkable, increasing 25% from 43% to 68%. This means that 28 million people, all inhabitants of rural areas, gained access to sanitation during the study period. Paraguay, with an increase of 18%, as well as Nicaragua and Honduras, with increases of almost 14% in coverage for their rural populations during the study period, stand out among the countries who made the most progress.
Source: Prepared by the authors
Figure 2 Population with Access to an Improved Source of Drinking Water (% of Urban and Rural Population) Simple Mean and Standard Deviation (Latin America-15 Countries), 1994-2014.
In terms of sanitation, countries are more heterogeneous and differences in terms of sanitation coverage for rural populations do not decrease, despite the progress in average coverage. This could be evidence of a certain endowment effect, which is when countries seem to be anchored to low rates of sanitation coverage. As Pearce-Oroz (2011) points out, despite the effort to elevate the profile of sanitation in government policies, the rural sanitation subsector is still one of the most unequal areas of Latin America in terms of enhanced solutions.
Authors such as Vos et al. (2010) suggest that although these advances were possible for most countries in the region, they would not have happened without the increase in public social spending that took place (Lora and Chaparro, 2007). During the 1990s, the revival of social spending was a deliberate and shared policy designed with a view to fulfill social rights and reduce poverty (CEPAL-UNICEF, 2002).
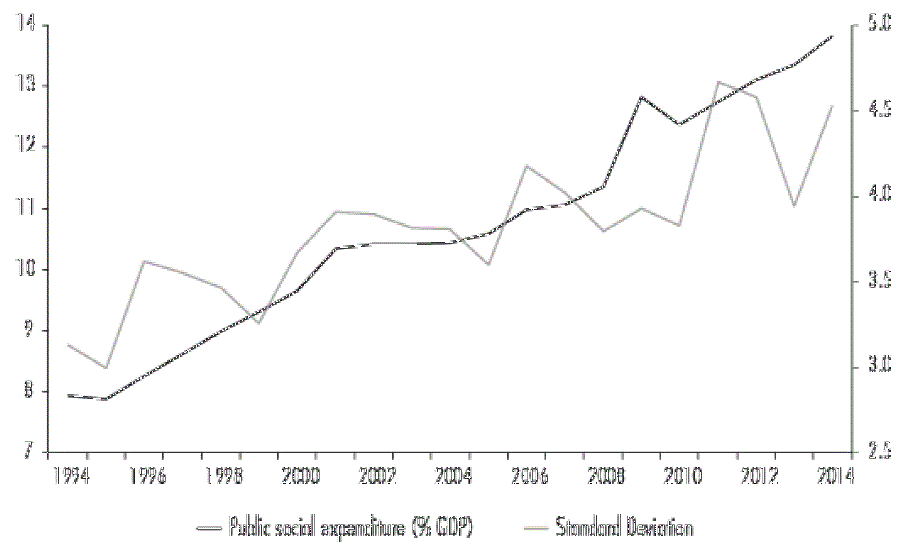
As can be seen in Figure 3, the "Latin American State" is generally far larger than it was at the beginning of 1994. The usual indicators for the size of the public sector seem to refute the belief that the rollback of the State was a fundamental part of the neoliberal program. While the remodeled political systems had tendencies towards reduction of state intervention, at the same time they also consecrated a wide range of social rights which necessitated an increase in current expenditure, especially social expenditure. Seen in this way, it is evident that general governments have increased current expenditure by an average of 7%. This increase, mainly in social spending, was made in an effort to fulfill neglected social needs and newly recognized social rights (Wiesner, 2002; Moncayo, 2006; Clements et al., 2007).
Source: Prepared by the authors
Figure 3 Social Public Expenditure as a Percentage of GDP (Simple Average and Standard Deviation). Latin America (15-Countries), 1994-2014.
As a whole, the 15-country region gave increased priority to public social expenditure, which increased from 7.93% of GDP for 1994, to 13.81% of GDP for 2014. Venezuela, El Salvador and Honduras stand out, with spending increasing by over 9% of GBP over the study period. It is hoped that the increased social participation of the public sector can be demonstrated as being positively related to a greater percentage of the rural population with access to water and sanitation.
The approach that was implemented established the extent of public participation that was a result of public social expenditure. This expanded any approach that limited public expenditure purely to housing or to the drinking water sector and urban or rural sanitation. For Wolf (2009), Ginneken et al. (2011), as well as Manghee & Van den Berg (2012), analyzing public expenditure destined exclusively for these sectors faces serious limitations. Definition, classification, and coverage may vary from country to country and make international comparison impossible. Additionally, the responsibilities of the sector are very divided, and their actors perform overlapping roles. The data is also usually incomplete or contradictory. This is aggravated by the fact that water and sanitation is not an autonomous public finance sector, something that would make it easier to draw international comparisons.
Generally, neither rural water nor rural sanitation services have specific policies, and are instead grouped together as “rural problems” (Pearce-Oroz, 2011). On the other hand, there are various expenditure items which are not strictly housing, water, or sanitation, yet contribute either directly or indirectly to improved coverage rates. For example, public expenditure aimed at environmental protection contributes to improved water and sanitation coverage rates in water yet, strictly speaking, is not a housing expenditure (UDAPE, 2010). Even international public management can play a decisive role (Barnaby, 2009).
Therefore, the objective of the current paper is to determine the nature of the relation between public social expenditure and drinking water and sanitation coverage rates for a 20-year period (1994-2014), in the 15 countries of Latin America (Argentina, Bolivia, Chile, Colombia, Costa Rica, Ecuador, El Salvador, Guatemala, Honduras, Mexico, Nicaragua, Panama, Paraguay, Peru and Venezuela). A distinction will be made between rural and urban populations and a regressive analysis will be conducted using both fixed and random general effects models. It is important to rule out the possibility of this relationship being a spurious relationship. It is also important to confirm the presence of unitary roots in the series as well as their cointegration, that is, a long-term relationship between them.
2. METHOD
Basic model
The relationship between public social expenditure and water and sanitation coverage rates is modeled using a data panel from 15 countries in Latin America (1994-2014). The percentage of population with access to drinking water and sanitation are included as dependent variables, with public social spending and GDP per capita as the main explanatory variables. The urban population percentage, the size of the agricultural sector, the area of protected wetlands, and the country’s democracy index are all included as control variables. The equation is as follows:
TCit = β0 + β1 PIBpCit + β2 GPSit + β3 Controlit + εit vit (1)
Where:
TC is the result in coverage that can adopt one of the following indicators:
Percentage of population with access to an improved source of drinking water (A), according to annual data obtained from the United Nations’ Joint Monitoring Program for Water Supply and Sanitation. An improved water source is defined as one that is protected from external contamination.
Percentage of population with access to improved sanitation (SAN) according to annual data obtained from the United Nation’s Joint Monitoring Program. An improved sanitation facility is one that hygienically prevents human contact with human excrement.
These two dependent variables can take the form of percentage of urban population (Aurb - SANurb) or rural (Arur - SANr), based on the hypothesis that the provision of these goods in rural populations presents differences and different determinants when compared to provision in urban populations (Donaldson, 1972; Wolf, 2009; Yanbing and Peng, 2011).
GDPpC is the annual per capita total gross domestic product in constant prices, given in 2010 dollars. Income levels have a recognized impact on access to water and sanitation, in addition to being an optimal proxy variable of the institutional characteristics of nations (Letelier, 2005).
PSE is the public social expenditure given as a percentage of GDP. For Martínez and Collinao (2010), this expenditure covers the resources used to generate positive social impact which is independent of the administrative entity or sector, as well as of the cost item to which they are allocated.
Control is a set of variables that are identified in the literature as determinants of the percentage of the population with access to water or sanitation. It is composed of the following indicateors:
Urban population rate (Urb).
The size of the agricultural sector (Agr), is calculated using the share of GDP made up of "agriculture, livestock, hunting, forestry and fishing." Their size and efficiency can determine the amount of water available for other urban or rural needs (Gleick, 2000, Watkins, 2006).
Percentage of protected wetland area (Pwa). Proportion of the country’s territory which is made up of wetlands is institutionally protected by the Ramsar Convention. A wetland is an area where the environment is principally composed of water. This variable is included as a proxy for the volume of available water resources in a country and for state commitment to its management and protection.
Depth and quality of democracy (Dem). Index put together by the organization Freedom House. Scores range from 1 to 7, with 1 corresponding to "free" and 7 corresponding to "not free". A greater degree of organization and cooperation in society allows for the development of and implementation of appropriate public policies (Putnam, 1993, Gellner, 1994, Solanes and Peña, 2002).
After standardization of the variables, equation (1) will be estimated using generalized least squares in order to take advantage of the cross-sectional structure which comes from the several consecutive years which fill the variables. It is assumed that countries can nest the data. These can be fixed or random effects models. This decision will be made using the Hausman test. The hypothesis that a larger public social sector promotes higher water and sanitation coverage rates will be tested. A significant and positive coefficient for the social expenditure variable is expected.
Cointegration Test
When seeking to identify significant relationships, the existence of long-term and non-spúrious relationships between them will need to be established. Note that the series in question may not be stationary and that the results of the estimates may not be reliable. It is necessary to establish long-run equilibrium relations between the dependent variables and the other explanatory variables. Doing so will involve a two-step process: 1) a panel-data unit-root contrast will be conducted using the Levin, Lin & Chu (2002), and Im, Pesaran & Shin (2003) tests, as well as the Fisher-ADF, Fisher-PP tests proposed by Maddala and Wu (1999). 2) a cointegration test will be carried out in order to estimate the long-run equilibrium relationship between the variables, using the Pedroni (1999 and 2004) and Kao (1999) contrasts, which in turn are based on the methodology Engle and Granger’s methodology (1987), and the Maddala and Wu (1999) test.
3. RESULTS AND DISCUSSION
Percentage of urban and rural population with access to water and sanitation. Public social expenditure and other determinants
Table 1 shows the regressions established in equation 1. The models’ strength becomes clear when we take into account the significance of the variables and the estimates in general. Models 1 and 2 present the percentage of population (urban and rural) with access to drinking water results. In each case, there is a positive and significant relationship with the social public spending variable. If the absolute value of the coefficients is taken into account, the two models generally show remarkable differences. For urban populations (model 1), urbanization and the size of the agricultural sector and, to a lesser extent, social expenditure, account for urban populations’ access to water. The importance of having protected water resources also begins to reveal itself. Income level is a significant variable with a high coefficient on the percentage of the rural population with access to drinking water (model 2). This, combined with the size of the agricultural sector, are the two variables with the greatest explanatory power. Next in line are the lower coefficients of public social expenditure, water source provision, and better governance. This last coefficient is a significant variable and has the expected negative sign (remember that on a scale of 1 to 7, 1 represents the highest democratic quality and 7 the worst).
Tabla 1 Percentage of Population with Access to Improved Water and Sanitation Sources (Urban and Rural), Public Social Spending and Control Variables, 1994-2014
| Model 1 | Model 2 | Model 3 | Model 4 | |
| Dependant variable | Aurb | Arur | Surb | Srur |
| Independent variable | Coefficient | |||
| GBPpC | -0.011 | 1.005*** | 0.196*** | 0.553*** |
| (-0.12) | (9.69 | (4.25 | (8.99) | |
| GPS | 0.431*** | 0.446*** | 0.219*** | 0.342*** |
| (8.59) | (8.03) | (8.55) | (9.89) | |
| Urb | 0.668*** | 0.143 | 0.371*** | 0.498*** |
| (4.32 | (0.96) | (4.42) | (4.03) | |
| Agr | 0 719*** | 1.025*** | 0.273*** | 0.419*** |
| (6.70) | (8.90) | (4.92) | (5.57) | |
| Shp | 0.073* | 0.188*** | 0.022 | -0.026 |
| (1.81) | (4.35) | (1.04) | (-0.88) | |
| Dem | -0.015 | -0.116*** | 0.028 | -0.023 |
| (-0.39) | (-2.61) | (1.42) | (-0.91) | |
| N (Observations) | 315 | 315 | 315 | 315 |
| N (Groups) | 15 | 15 | 15 | 15 |
| R2 Adjusted | ||||
| Interior | 57.71 | 69.16 | 65.15 | 74.07 |
| Between groups | 2.69 | 13.12 | 40.87 | 42.12 |
| F / Chi2 - Wald / Chi2 | 386.72*** | 611.90*** | 544.56*** | 1 39.96*** |
| Hausman Test | -19.49a | -16.19a | 3.17 | 21.03*** |
| Breusch and Pagan Test | 1438.43*** | 640.05*** | 1431.18*** | 1710.38*** |
Note: Standard errors "t" or "z" between parenthesis ***p<0,01; **p<0,05; *p<0,1. The negative should be interpreted as evidence that the systematic difference of coefficients null hypothesis can not be rejected and, therefore, variable effects are the most efficient estimator (Stata reference manual AJ, 447-2005). Source: Prepared by the authors
Models 3 and 4 present the results for the percentage of population (urban and rural) with access to improved sources of sanitation. Again, in each case there is a positive and significant relationship with the social public expenditure variable. The percentage of the urban population with access to sanitation (model 3) is mainly related to the percentage of the urban population over the total population variable. The lower coefficients are the size of the agricultural sector, public social expenditure, and income level. Access to sanitation in rural areas (model 4) depends to a large extent on populations’ income level. It is also due to the urban population level. Finally, the lowest coefficients are the size of the agricultural sector, and public social expenditure.
Findings such as the fact that the four models’ behaviour clearly varies also become visible after making a general reading. The determinants and their level of significance and elasticity change depending on which dependent variable is considered. There is no clear trend between the supply of the two goods (water and sanitation) or the two types of population (rural or urban). This corroborates the positions taken by Wolf (2009) and Yanbing & Peng (2011) regarding the important gaps that exist in water and sanitation provision between rural and urban areas, as well as the importance of acknowledging this division when carrying out studies intended to establish their determinants more effectively.
Urban areas have high coverage rates, especially drinking water coverage rates. It is doubtless that the economies of scale reduce costs and facilitate provision in urbanized areas, as opposed to the high costs incurred by the provision of the same services in remote and rural areas. Income level becomes a clear determinant in the latter (see models 2 and 4). Income level is a more imperative determinant for access to services in rural areas. As indicated by Soares et al. (2002) access to services is determined by income and location. Provision is more limited and more expensive in rural populations.
Another difference between rural and urban areas is that the provision of water to rural populations depends to a larger extent on their access to natural protected water sources. Perhaps this can be explained by the fact that rural populations often fill their water needs using facilities that require proximity to sheltered natural water sources, such as wells or protected springs, as opposed to the pipes or residential connections used by urban populations and which require larger quantities of treated water.
Rural populations’ access to drinking water depends to a large extent on better governance, or democratic quality. Therefore, organization, cooperation, and population participation are key factors in the provision of drinking water facilities in rural areas. This corroborates the work done by Anillo et al. (2014) and Luh and Bartram (2016), who highlight the role of governance as a determinant for access to drinking water in rural areas. Undoubtedly, either the most active and highly organized rural populations or effective public institutions will be the explanation for the advances in water coverage that rural sectors have experienced. Cooperative efforts, both internal and external, are also important (Barnaby, 2009; Gleick, 2000).
The size of the agricultural sector (Agr) appears to be an explanatory and positive variable in all models and for all dependent variables. It may be possible that in Latin America, there is a better management of water resources in the agricultural sector, instead of resources being extracted to meet the demands of urban or rural populations. Although it is difficult to conclusively establish the nature of this positive relationship, it is possible to make some conjectures. For example, the expansion of water infrastructure is largely due to agricultural production, especially in remote areas. This generally benefits rural populations. Additionally, a solid agricultural sector promotes the efficient use of resources, including water resources. This is conducive to better long-term water and sanitation coverage rates, especially in rural populations. Regarding sanitation, the agricultural sector makes the greatest use of waste water, using it for irrigation. This recognition of waste water as a valuable resource has a positive effect on sanitation.
Cointegration Tests
The Levin, Lin and Chu (2002); Im, Pesaran and Shin (2003) tests, as well as the Fisher-ADF and Fisher-PP tests (Maddala and Wu, 1999), confirm that all variables have unit roots I (1) of first order. The urban population percentage variable, which is stationary in its levels I (0), is an exception (see results of the tests in the Annex Table A1.1.). If these results are combined with those reported in Table 1, it is possible to establish a series of models composed exclusively of variables that have a unit root (which is necessary to be able to advance the cointegration tests) and are also significant for each of the dependent variables. The four resulting models are:
Model 1.1 Aurbit = β0 + β1 GPSit + β2 Agrit + β3 Shpit (2)
Model 2.1 Arurit = β0 + β1 PIBpCit + β2 GPSit + β3 Agrit + β4 Demit (3)
Model 3.1 Surbit = β0 + β1 PIBpCit + β2 GPSit + β3 Agrit (4)
Model 4.1 Srurit = β0 + β1 PIBpCit + β2 GPSit + β3 Agrit (5)
The majority of the 11 contrasts proposed by Pedroni (1999) establish cointegration in each of these four models. On the other hand, the contrasts proposed by Kao (1999), and Maddala & Wu (1999) demonstrate that there is an equilibrium relationship in the long-run for all models (see Annex Tables A1.2. It was therefore possible to find evidence of cointegration between the variables. It is even possible to confirm the presence of a long-term and highly-consistent relationship between them, thus ruling out the presence of spurious relationships. In other words, there is evidence of a positive, significant and highly-consistent long-term relationship between the variables of public social expenditure and the percentage of the population with access to water and sanitation in Latin America.
4. CONCLUSION
Although there are several determinants, the importance of public expenditure for achieving coverage objectives in this sector cannot be denied. The existence of a definitive causal relationship can not be taken for granted. Strong institutions which ensure the efficient use of resources are needed.
Within this framework, the relationship between the volume of public social expenditure and the percentage of the population with access to drinking water and sanitation for 15 Latin American countries was investigated empirically over a 20-year period (1994-2014). In order to achieve this, a regressive analysis was conducted on four models which link the percentage of the population with access to improved water and sanitation sources with social public expenditure, as well as other control variables. This analysis was discriminant between urban and rural populations. The presence of unit roots in the series was also confirmed, as was their cointegration, that is, the existence of a highly-consistent long-term relationship.
At first glance, the results yielded highlight the differences between the four models. The contrasts between water and sanitation, as well as the location of the population (urban or rural), are important. This also supports the literature which calls for discriminant analysis. The processes of water and sanitation provision in rural and urban areas are clearly very dissimilar when the two are compared.
Despite the differences between populations, the public social expenditure variable appears to be positively related, significant and highly-consistent in all models. There is important evidence which indicates that the State’s social size is a factor that explains the differences and advances in coverage. The increase in public social expenditure has made it possible for countries in Latin American to reach their coverage goals, mainly in rural populations. Without access to supply or sanitation infrastructures, rural populations often use labor-intensive mechanisms which incur high costs. Therefore, obtaining water and sanitation involves a greater expenditure of money, time, and energy, especially for those without access to a nearby water source and who have not developed cooperation mechanisms for resource management. With income levels constant and tariffs in place designed to guarantee service continuity and efficient use of resources, increases in coverage were only possible with increased social intervention from the public sector.
The fact that rural populations’ water coverage and sanitation increased significantly during the study period is clear. To a large extent, this increase accounts for the overall increase in coverage for the total population. Coverage rates are highest in countries that have strong agricultural sectors. A larger agricultural sector seems to impact positively on resource management and the expansion of water infrastructure. Additionally, this may also explain higher income in rural sectors, a greater concern for the protection and efficient management of water sources, and the construction of better-organized rural sectors with stronger institutions.
REFERENCES
Anand, P. B. (2006), “Millennium Development Goal 7: An Assessment of Progress with Respect to Water and Sanitation; Legacy, Synergy, Complacency or Policy?”, Research Paper No. 2006/01, UNU-WIDER, United Nations University (UNU). [ Links ]
Anillo, A., Boehm, F. y Polo-Otero, J. (2014), Governance Matters: Universal Access to Water. Recuperado de SSRN <https://ssrn.com/abstract=2393718> [ Links ]
Banco Interamericano de Desarrollo (2003), Las metas del Milenio y las necesidades de inversión en América Latina y el Caribe. Conferencia Internacional Financiación de los servicios de agua y saneamiento: opciones y condicionantes, Washington D.C., 10 y 11 de noviembre. [ Links ]
Banco Mundial (1992), World Development Report, New York, Oxford University Press. [ Links ]
Barnaby, W. (2009), “Do Nations go to War over Water?”, Nature, 458(7236), DOI <doi:10.1038/458282a> [ Links ]
Bose, N., Haque, M. E. y Osborn, D. R. (2007), “Public Expenditure and Economic Growth: A Disaggregated Analysis for Developing Countries”, The Manchester School, 75(5), DOI <10.1111/j.1467-9957.2007.01028.x> [ Links ]
Castro, J. E. (2007), “Poverty and Citizenship: Sociological Perspectives on Water Services and Public-private Participation”, Geoforum, 38(5), DOI <https://doi.org/10.1016/j.geoforum.2005.12.006> [ Links ]
Clements, B., Faircloth, C. y Verhoeben, M. (2007), “Gasto público en América Latina: tendencia y aspectos clave de política”, Revista de la cepal, núm. 93, Santiago de Chile, CEPAL, diciembre. [ Links ]
Comisión Económica para América Latina y el Caribe y Fondo de las Naciones Unidas para la Infancia (CEPAL-UNICEF) (2002), La pobreza en América y el Caribe aún tiene nombre de infancia. Documento preparado por la CEPAL y el UNICEF para la XI Conferencia de Esposas de Jefes de Estado y de Gobierno de las Américas, México, 25 al 27 de septiembre. [ Links ]
Donaldson, D. (1972), “Rural Water Supplies in developing Countries”, jawra Journal of the American Water Resources Association, 8(2), DOI <10.1111/j.1752-1688.1972.tb05149.x> [ Links ]
Engle, R. F. y Granger, C. W. (1987), “Co-integration and Error Correction: Representation, Estimation, and Testing”, Econometrica, 55(2), DOI <10.2307/1913236> [ Links ]
Estache, A., Perelman, S. y Trujillo, L. (2005), “Infrastructure Performance and Reform in Developing and Transition Economies: Evidence from a Survey of Productivity Measures”, World Bank Policy Research Working Paper 3514, Washington, DC. [ Links ]
__________, Goicoechea, A. y Trujillo, L. (2006), “Utilities Reforms and Corruption in Developing Countries”, World Bank Policy Research Working Paper No. 4081, Washington, DC. [ Links ]
__________ y Kouassi, E. (2002), “Sector Organization, Governance, and the Inefficiency of African Water Utilities”, Policy Research Working Paper 2890, World Bank. [ Links ]
Gellner, E. (1994), Conditions of Liberty: Civil Society and its Rivals, Harmondsworth, Allen Lane/Penguin Press. [ Links ]
Ginneken, V. M., Netterstrom, U. y Bennett, A. (2011), “More, better, or different spending? Trends in Public Expenditure on Water and Sanitation in Sub-Saharan Africa”, Public Expenditure Review (per), Water Papers. Washington, DC, World Bank. [ Links ]
Gleick, P. H. (2000), “A Look at Twenty-first Century Water Resources Development”, Water International, 25(1), DOI <https://doi.org/10.1080/02508060008686804> [ Links ]
Gómez Urrego, D. E. (2016), Tres ensayos sobre eficiencia, acceso al agua potable y política de control de la contaminación de los recursos hídricos en Colombia (Tesis Doctoral), Barcelona, España, Universidad Autónoma de Barcelona. [ Links ]
Gupta, S., Keen, M., Clements, B., Fletcher, K., Mello, L. D. y Mani, M. (2002), Dimensiones fiscales del desarrollo sostenible, FMI Serie de folletos, vol. 54-S, Washington, DC, Departamento de Finanzas Públicas, FMI. [ Links ]
Hunter, P. R., Zmirou-Navier, D. y Hartemann, P. (2009), “Estimating the Impact on Health of Poor Reliability of drinking Water Interventions in Developing Countries”, Science of the Total Environment, 407(8), DOI <https://doi.org/10.1016/j.scitotenv.2009.01.018> [ Links ]
Hutchings, P., Chan, M. Y., Cuadrado, L., Ezbakhe, F., Mesa, B., Tamekawa, C. y Franceys, R. (2015), “A Systematic Review of Success Factors in the Community Management of Rural Water Supplies over the Past 30 Years”, Water Policy, 17(5), DOI <10.2166/wp.2015.128> [ Links ]
Im, K. S., Pesaran, M. H. y Shin, Y. (2003), “Testing for Unit Roots in Heterogeneous Panels”, Journal of Econometrics, 115(1), DOI <https://doi.org/10.1016/S0304-4076(03)00092-7> [ Links ]
Johansen, S. (1991), “Estimation and Hypothesis testing of Cointegration Vectors in Gaussian Vector Autoregressive Models”, Econometrica , 59(6), DOI <10.2307/2938278> [ Links ]
Kao, C. (1999), “Spurious Regression and Residual-based Tests for Cointegration in Panel Data”, Journal of Econometrics , 90(1), DOI <https://doi.org/10.1016/S0304-4076(98)00023-2> [ Links ]
LaFleur, M. T. (2014), Determinantes del acceso a fuentes de agua y saneamiento mejorados y los Objetivos de Desarrollo del Milenio en Honduras. Documento de trabajo, New York, USA, Department of Economic and Social Affairs United Nations. [ Links ]
Letelier, S. L. (2005), “Explaining Fiscal Decentralization”, Public Finance Review, 33(2), DOI < https://doi.org/10.1177/1091142104270910> [ Links ]
Levin, A., Lin, C. F. y Chu, C. S. J. (2002), “Unit Root Tests in Panel Data: Asymptotic and Finite-sample Properties”, Journal of econometrics, 108(1), DOI < https://doi.org/10.1016/S0304-4076(01)00098-7> [ Links ]
Lockwood, H. (2002), Institutional Support Mechanisms for Community-managed Rural Water Supply & Sanitation Systems in Latin America, Strategic Report 6, Environmental Health Project, Washington, DC, US Agency for International Development. [ Links ]
Lora, E. y Chaparro, J. C. (2007), “Las estructuras fiscales de América Latina”, Revista Ideas para el Desarrollo en las Américas, núm. 12, Washington, Banco Interamericano de Desarrollo. [ Links ]
Luh, J. y Bartram, J. (2016), “Drinking Water and Sanitation: Progress in 73 Countries in Relation to Socioeconomic Indicators”, Bulletin of the World Health Organization, 94(2), DOI <http://dx.doi.org/10.2471/BLT.15.162974> [ Links ]
Maddala, G. S. y Wu, S. (1999), “A Comparative Study of Unit Root Tests with Panel Data and a New Simple Test”, Oxford Bulletin of Economics and Statistics, 61(S1), DOI < 10.1111/1468-0084.0610s1631> [ Links ]
Manghee, S. y Van den Berg, C. (2012), “Public Expenditure Review from the Perspective of the Water and Sanitation Sector: Guidance Note”, Water Papers, Washington, D.C., The World Bank. Recuperado de <http://documents.worldbank.org/curated/en/667911468340140917/Public-expenditure-review-from-the-perspective-of-the-water-and-sanitation-sector-guidance-note> [ Links ]
Martínez, R. y Collinao, M. (2010), “Gasto social: modelo de medición y análisis para América Latina y el Caribe”, Serie Manuales, núm. 65, Santiago de Chile, CEPAL . [ Links ]
Mehta, M., Fugelsnes, T. y Virjee, K. (2005), “Financing the Millennium Development Goals for Water and Sanitation: What will it Take?”, International Journal of Water Resources Development, 21(2). [ Links ]
Moncayo, E. (2006), “La transformación del Estado en América Latina: una perspectiva económica desde los países andinos”, Revista Opera, núm. 6, Bogotá, Colombia, Universidad Externado de Colombia. [ Links ]
Mwendera, E. J. (2006),“Rural Water Supply and Sanitation (RWSS) Coverage in Swaziland: Toward achieving Millennium Development Goals”, Physics and Chemistry of the Earth, Parts A/B/C, 31(15), DOI <https://doi.org/10.1016/j.pce.2006.08.040> [ Links ]
Narayan, D. (1995), “Contribution of People’s Participation: Evidence from 121 Rural Water Supply Projects”, Environmentally Sustainable Development Ocassional Paper Series, núm, 1, World Bank. [ Links ]
Organización Mundial de la Salud-Fondo de las Naciones Unidas para la Infancia (OMS-UNICEF) (2015), Progresos en materia de saneamiento y agua potable: informe de actualización 2015 y evaluación del ODM, Nueva York, Estados Unidos de América. [ Links ]
Pacheco, J. (2013), Determinantes socioeconómicos de la educación, la mortalidad y el acceso al agua potable y el saneamiento en Nicaragua: un análisis econométrico, Proyecto de Creación de Capacidades, PNUD Nicaragua y UN-DESA. [ Links ]
Pearce-Oroz, G. (2011), Rural Water Supply and Sanitation Challenges in Latin America for the Next Decade: Lessons from the Cusco+10 International Seminar, World Bank, Water and Sanitation Program (WSP), Lima, Perú. [ Links ]
Pedroni, P. (1999), “Critical Values for Cointegration Tests in Heterogeneous Panels with Multiple Regressors”, Oxford Bulletin of Economics and Statistics , 61(S1), DOI <10.1111/1468-0084.0610s1653> [ Links ]
__________ (2004), “Panel Cointegration: Asymptotic and Finite Sample Properties of Pooled Time Series Tests with an Application to the PPP Hypothesis”, Econometric Theory, 20(3), DOI <10+10170S0266466604203073> [ Links ]
Prokopy, L. S. (2005), “The Relationship between Participation and Project Outcomes: Evidence from Rural Water Supply Projects in India”, World Development, 33(11), DOI <https://doi.org/10.1016/j.worlddev.2005.07.002> [ Links ]
Putnam, R. D. (1993), Making Democracy Work, Princeton University Press. [ Links ]
Sara, J., Drees-Gross, A. y Van Den Berg, C. (1996), Rural Water Supply & Sanitation in Bolivia: from Pilot Project to National Program. Water and Sanitation Program, Washington, D.C., World Bank Group. Recuperado de <http://documents.worldbank.org/curated/en/557241467998182904/Rural-water-supply-sanitation-in-Bolivia-from-pilot-project-to-national-program> [ Links ]
Schouten, T. y Moriarty, P. (2003), Community Water, Community Management: From System to Service in Rural Areas, UK, ITDG, Bourton on Dunsmore. [ Links ]
Shafik, N. (1994), “Economic Development and Environmental Quality: An Econometric Analysis”, Oxford Economic Papers, 46, Special Issue on Environmental Economics. [ Links ]
Soares, L. C. R., Griesinger, M. O., Dachs, J. N. W., Bittner, M. A. y Tavares, S. (2002), “Inequities in Access to and use of drinking Water Services in Latin America and the Caribbean”, Revista Panamericana de Salud Pública, 11(5-6), Washington, D.C., Organización Panamericana de la Salud. [ Links ]
Solanes, M. y Peña, H. (2002), La gobernabilidad efectiva del agua en las Américas: un tema crítico, Global Water Partnership. [ Links ]
Sorenson, S. B., Morssink, C. y Campos, P. A. (2011), “Safe Access to Safe Water in Low income Countries: Water fetching in Current Times”, Social science & medicine, vol. 72, núm. 9. [ Links ]
Swaroop, V. (1994), “The Public Finance of Infrastructure: Issues and Options”, World Development , vol. 22, núm. 12. [ Links ]
Thoenen, R. (2007), Private Sector Participation in the Provision of Basic Infrastructure, ATPC Work in Progress No. 66, UNECA, Addis Ababa. [ Links ]
Unidad de Análisis de Políticas Sociales y Económicas (UDAPE) (2010), El gasto público social hacia el logro de los Objetivos de Desarrollo del Milenio, La Paz, Bolivia. [ Links ]
Vos, R., Sánchez, M. V. y Kaldewei, C. (2010), “Latin America and the Caribbean’s challenge to Reach the MDGs: financing Options and Trade-offs”, Public Policies for Human Development, UK, Palgrave Macmillan. [ Links ]
Watkins, K. (2006), Human Development Report 2006. Beyond Scarcity: Power, Poverty and the Global Water Crisis, Nueva York, Programa de las Naciones Unidas para el Desarrollo. [ Links ]
Wiesner, E. (2002), “La Evaluación de Resultados en la Modernización del Estado en América Latina”, Ponencia para el Seminario de Alto Nivel sobre Funciones Básicas de la Planeación, Revista de Economía Institucional, vol. 4, núm. 6. [ Links ]
Wolf, S. (2009), Water and Sanitation for all? Rural versus Urban Provision, Int. J. Services, Economics and Management, vol. 1, núm. 4. [ Links ]
Yanbing, C. A. I. y Peng, L. I. U. (2011), “The pricing Mechanism for Safety drinking Water supply in Rural Area”, Energy Procedia, vol. 5, DOI <https://doi.org/10.1016/j.egypro.2011.03.251> [ Links ]
Zhang, Y., Parker, D. y Kirkpatrick, C. (2005), “Competition, Regulation and Privatization of Electricity Generation in developing Countries: does the sequencing of the Reforms Matter?”, The Quarterly Review of Economics and Finance, 45(2), DOI < https://doi.org/10.1016/j.qref.2004.12.009> [ Links ]
Index. Cointegration Tests
Table A1 Unit Root Test for the Data Panel Series 1994-2014
| Levels | First differences | Diagnosis | |||||||
| LLC | IPC | ADF | PP | LLC | IPC | ADF | PP | 1(1) | |
| Aurb | -1.32* | 2.177 | 9.643 | 10.27 | -46.0** | -14.86** | 260.30** | 627.83** | 1(1) |
| Arur | -0.80 | 2.67 | 7.12 | 7.026 | -9.24** | -12.23** | 175.28** | 1484.45** | 1(1) |
| Surb | -1.098 | 1.525 | 15.89 | 16.58 | -6.84** | -12.63** | 346.54** | 903.15** | 1(1) |
| Srur | 1.636 | 3.486 | 9.309 | 10.659 | -8.23** | -11.56** | 217.54** | 837.21** | 1(1) |
| PIBpC | 5.703 | 8.187 | 5.088 | 4.024 | -7.61** | -6.298** | 103.21** | 102.42** | 1(1) |
| GPS | -1.36* | 1.032 | 30.88 | 22.57 | -11.6** | -11.10** | 164.57** | 300.828** | 1(1) |
| Urb | -8.64** | -2.61** | 318.901** | 721.051** | - | - | - | - | 1(0) |
| Agr | -1.008 | 0.102 | 27.935 | 20.78 | -10.4** | -11.97** | 179.51** | 462.01** | 1(1) |
| Shp | -1.48* | 1.943 | 19.634 | 28.465 | -13.7** | -10.48** | 144.53** | 154.16** | 1(1) |
| Dem | -1.086 | -0.32 | 26.007 | 37.77 | -13.3** | -12.70** | 164.18** | 151.51** | 1(1) |
Notes: llc (Levin Lin Chu); ips(lm, Pesaran and Shin); adf(Augmented Dickey-Fuller); pp(Philips-Perron). ***p<0,01; ** p<0,05; *p<0,1. Source: Prepared by the authors
Table A2 Cointegration Test in Panel Data Model 1.1
| Statistics | P - value | Weighted statistics | P-value | |
| Pedroni (1999, 2004) | ||||
| H1: coefs. Common AR | ||||
| Panel v | 3405.143 | 0.000 | 344.156 | 0.000 |
| RHO Panel | -0.647 | 0.258 | -5.123 | 0.000 |
| PP Panel | -0.038 | 0.484 | -16.078 | 0.000 |
| ADF Panel | -4.911 | 0.000 | -16.553 | 0.000 |
| H1: coefs. Individual AR | ||||
| RHO group | 0.280 | 0.610 | ||
| PP group | -12.457 | 0.000 | ||
| ADF group | -9.965 | 0.000 | ||
| Kao (1999) | ||||
| ADF | -1.888 | 0.0294 | ||
| Maddala and Wu (1999) | ||||
| Fisher - Johansen | λ (Traza) | P - value | λ (máx. autovalor) | P - value |
| N=1 | 147.0 | 0.000 | 111.2 | 0.000 |
| N=2 | 68.38 | 0.000 | 60.01 | 0.0004 |
| N=3 | 31.14 | 0.310 | 24.54 | 0.652 |
| N=4 | 40.22 | 0.063 | 40.22 | 0.063 |
Notes: null hypothesis: no cointegration
Source: Prepared by the authors
Table A3 Cointegration Test in Panel Data Model 2.1
| Statistics | P - value | Weighted statistics | P-value | |
| Pedroni (1999, 2004) | ||||
| H1: coefs. Common AR | ||||
| Panel v | 0.163 | 0.434 | -3.405 | 0.999 |
| RHO Panel | 0.547 | 0.707 | -2.595 | 0.004 |
| PP Panel | -2.568 | 0.005 | -8.707 | 0.000 |
| ADF Panel | -3.776 | 0.0001 | -9.632 | 0.000 |
| H1: coefs. Individual AR | ||||
| RHO group | 1.658 | 0.951 | ||
| PP group | -3.528 | 0.0002 | ||
| ADF group | -5.816 | 0.000 | ||
| Kao (1999) | ||||
| ADF | -1.273 | 0.101 | ||
| Maddala and Wu (1999) | ||||
| Fisher - Johansen | λ (Traza) | P - value | λ (máx. autovalor) | P - value |
| N=1 | 368.8 | 0.000 | 260.6 | 0.000 |
| N=2 | 180.6 | 0.000 | 125.7 | 0.000 |
| N=3 | 81.59 | 0.000 | 57.50 | 0.0004 |
| N=4 | 45.76 | 0.009 | 35.13 | 0.108 |
| N=5 | 47.63 | 0.006 | 47.63 | 0.006 |
Notes: null hypothesis: no cointegration
Source: Prepared by the authors
Table A4 Cointegration Test in Panel Data Model 3.1
| Statistics | P - value | Weighted statistics | P-value | |
| Pedroni (1999, 2004) | ||||
| H1: coefs. Common AR | ||||
| Panel v | 1.618 | 0.052 | 0.302 | 0.381 |
| RHO Panel | 0.850 | 0.802 | 1.145 | 0.874 |
| PP Panel | -1.229 | 0.109 | -1.260 | 0.103 |
| ADF Panel | -2.972 | 0.001 | -2.711 | 0.003 |
| H1: coefs. Individual AR | ||||
| RHO group | 2.122 | 0.983 | ||
| PP group | -3.317 | 0.0005 | ||
| ADF group | -4.406 | 0.000 | ||
| Kao (1999) | ||||
| ADF | -1.674 | 0.047 | ||
| Maddala and Wu (1999) | ||||
| Fisher - Johansen | λ (Traza) | P - value | λ (máx. autovalor) | P - value |
| N=1 | 220.5 | 0.000 | 159.3 | 0.000 |
| N=2 | 93.07 | 0.000 | 68.44 | 0.000 |
| N=3 | 48.84 | 0.008 | 34.53 | 0.183 |
| N=4 | 62.33 | 0.0002 | 62.33 | 0.0002 |
Notes: null hypothesis: no cointegration
Source: Prepared by the authors
Table A5 Cointegration Test in Panel DataModel 4.1
| Statistics | P - value | Weighted statistics | P-value | |
| Pedroni (1999, 2004) | ||||
| H1: coefs. Common AR | ||||
| Panel v | 2490.685 | 0.0000 | 838.6772 | 0.0000 |
| RHO Panel | -1.704365 | 0.0442 | -2.614978 | 0.0045 |
| PP Panel | -1.61 0869 | 0.0536 | -2.032476 | 0.0211 |
| ADF Panel | -3.773460 | 0.0001 | -0.527186 | 0.2990 |
| H1: coefs. Individual AR | ||||
| RHO group | -0.306536 | 0.3796 | ||
| PP group | -15.92765 | 0.0000 | ||
| ADF group | -6.951109 | 0.0000 | ||
| Kao (1999) | ||||
| ADF | -2.41 2866 | 0.0079 | ||
| Maddala and Wu (1999) | ||||
| Fisher - Johansen | λ (Traza) | P - value | λ (máx. autovalor) | P - value |
| N=1 | 220.8 | 0.0000 | 166.1 | 0.0000 |
| N=2 | 91.58 | 0.0000 | 67.11 | 0.0001 |
| N=3 | 50.51 | 0.0110 | 43.35 | 0.0546 |
| N=4 | 44.70 | 0.0411 | 44.70 | 0.0411 |
Notes: null hypothesis: no cointegration
Source: Prepared by the authors
Received: March 08, 2018; Accepted: August 31, 2018
 Este es un artículo publicado en acceso abierto bajo una licencia Creative Commons
