


Serviços Personalizados
Journal
Artigo
 texto em
  Inglês (pdf)
 Artigo em XML
 Referências do artigo
 Enviar este artigo por email
Indicadores
-
 Citado por SciELO
 -
 Acessos
Links relacionados
-
 Similares em
SciELO
Similares em
SciELO
Compartilhar

 Permalink
Problemas del desarrollo
versão impressa ISSN 0301-7036
Prob. Des vol.49 no.193 Ciudad de México Abr./Jun. 2018
https://doi.org/10.22201/iiec.20078951e.2018.193.61281
Articles
The Spillover Effects of Industrial Exports in Latin American Countries
1Post-doctoral Fellowship Program at the National Autonomous University of Mexico (UNAM), Fellow at the Institute for Economic Research, advised by Dr. Andrés Blancas. E-mail address: antoniomrqz@gmail.com
Against the backdrop of trade liberalization, economies in Latin America have endeavored to capitalize on their comparative advantages and join global production processes; despite the fact that industrial exports have grown, however, they have had only a modest impact in terms of boosting the product in Latin American economies. The objective of this paper is to determine the influence of industrial exports on the product in six Latin American countries, using the input-output model and the network theory. The hypothesis sets out to prove that out of an economy's total transactions, the spillover effects from the industrial sector exports in each country are more diversified the more the country trades with the United States, even if these effects are weak, due to the low structural articulation in each of them.
Key Words: Latin America; exports; industrial sector; trade; network theory; Miyazawa multipliers
En el contexto de apertura comercial, las economías de América Latina se han esforzado por explotar las ventajas comparativas e insertarse en los procesos productivos mundiales; pese a que las exportaciones de la industria muestran crecimiento, también han impactado modestamente en el aumento del producto en las economías latinas. El objetivo de este trabajo es determinar la influencia de las exportaciones industriales sobre el nivel de producto de seis países latinoamericanos con el modelo de insumo-producto y la teoría de redes. La hipótesis busca probar que en las transacciones totales de la economía, la derrama de las exportaciones del sector industrial de cada país es más diversificada cuanto más comercia con Estados Unidos, pese a que es débil debido a la poca articulación estructural de cada país.
Palabras clave: América Latina; exportaciones; sector industrial; comercio; teoría de redes; multiplicadores de Miyazawa
Clasificación JEL: F14; F15; F43; O14; O54
Dans le contexte de la libéralisation du commerce, les économies latino-américaines ont eu du mal à exploiter les avantages comparatifs et à s'insérer dans les processus de production mondiale; Bien que les exportations de l'industrie affichent une croissance, elles ont également modéré l'augmentation de la production dans les économies d'Amérique latine. Le but de cette étude est de déterminer l'influence des exportations industrielles au niveau des produits dans six pays d'Amérique latine avec le modèle d'entrée-sortie et la théorie des réseaux. L'hypothèse cherche à prouver que, dans les transactions totales de l'économie, le débordement des exportations du secteur industriel de chaque pays est plus diversifié plus il négocie avec les États-Unis, bien qu'il soit faible en raison de la faible articulation structurelle de chacun d'entre eux.
Mots clés: Amérique latine; les exportations; l'industrie; le commerce; la théorie des réseaux; des multiplicateurs de Miyazawa
No contexto de abertura comercial, as economias de América Latina se esforçaram para explorar as vantagens comparativas e se inserir nos processos produtivos mundiais; a pesar que exportações da indústria mostrem sinais de crescimento, também foram impactadas modestamente no aumento do produto nas economias latinas. O objetivo deste trabalho é determinar a influência das exportações industriais sobre o nível de produto de seis países latino-americanos com o modelo de insumo-produto e a teoria de redes. A hipótese busca provar que em todas as transações, o spillover das exportações do setor industrial de cada país é mais diversificado quanto mais se comercializa com Estados Unidos, apesar de que é fraco devido a uma baixa articulação estrutural de cada um de eles.
Palavras-chave: América Latina; exportações; setor industrial; comércio; teoria de redes; multiplicadores de Miyazawa
在贸易开放的背景下,拉美经济体努力开发自己的相对优势并融入世界生产过程。尽管工业出口有所增长,但是也对拉丁美洲经济产出的增长产生了一定的影响。本文的目的是通过投入产出模型和网格理论来确定六个拉美国家工业出口对产品水平的影响。本文试图证明在整个经济交易中,当每个国家与美国的贸易关系越密切的时候他们的工业部门的出口溢出就越多样化。
关键词 拉丁美洲; 出口; 工业部门; 贸易; 网格理论; 宫泽乘数
INTRODUCTION
One consequence of trade liberalization in Latin America is intra-industrial trade growth, thanks to foreign direct investment (FDI), trade agreements (Di Filippo, 1995) and the breadth of the international division of labor (Feenstra, 1998; Hausemann et al., 2014). The Economic Commission for Latin America and the Caribbean (ECLAC) (2013) asserted that the share of trade as a percentage of gross domestic product (GDP) rose from 28% in 1990 to 40% in 2010. Nevertheless, this external momentum has not been matched by product growth.
The aim of this paper is to determine the degree to which industrial exports in Argentina, Brazil, Chile, Colombia, Costa Rica, and Mexico spill over into each country’s respective products, as these nations belong to the Organization for Economic Cooperation and Development (OECD), and are therefore considered important for Latin America.2 Moreover, the data available for these countries are compatible for purposes of comparison. The idea is to measure the strength of industrial trade in the economic product and in each productive sector, isolating out the effect by group of sectors, in an attempt to elucidate the salience of trade, not in terms of amounts of exports, but rather looking at the role it plays in generating the product.
The hypothesis to test is that the spillover of industrial sector exports into other sectors in each country is more diversified the more the country trades with the United States; nevertheless, the impact of these exports on the product is weak due to scant structural articulation in each of them. There are a series of techniques that can test the above hypothesis. In this case, the proposal is to use the input-output model (IOM) and its extension with graph theory.
The rest of the document is structured as follows: the first section describes the methodology used, introduces the fundamentals of productive integration in economic development, the Miyazawa (1971) decomposition, and network theory; the second analyzes the product and trade in the economies chosen for the time period 1995-2015; the third offers the results, and, finally, there is a conclusions section.
1. SPILLOVER AND INTEGRATION IN THE INPUT-OUTPUT MODEL (IOM)
In the input-output model (IOM), the economy is a system of interdependent productive sectors in the market with a dual role, as they are suppliers because, on the one hand, they sell products to different sectors, and at the same time, they are demanders, because they buy products from others, which they turn into inputs to carry out productive processes; there is furthermore an indirect relationship between them when the production of inputs requires other inputs (Leontief, 1936). Productive processes are complementary and each one produces a single good with one technological good (Miller and Blair, 2009). The productive structure is considered to comprise a network of trade relationships among the sectors.
In the regional IOM, spillover has become one of the most studied factors; this is because when sectors in a certain location grow, it can stimulate sectors in other regions if they too require inputs produced outside of their own region to satisfy local demand. In turn, this spillover can spur another effect: feedback, That is to say, when the region buys external inputs, provoking internal demand for goods consumed as inputs in other zones in order to export to them. Inter-regional trade can explain growth by either track (Miller and Blair, 2009, p. 81). In the majority of cases, these phenomena have been studied in regions or in countries (Miller and Blair, 2012).
Spillover and feedback in a sector are higher the more the sector is integrated with the productive structure, namely, when it enjoys a greater capacity to influence others in economic decision-making. In effect, when activities are integrated, we are dealing with a developed economic system (Aroche, 1996), in the same way that an underdeveloped economy is less complete and is weakly articulated (Leontief, 1936): there is therefore a direct relationship between integration and development. If the productive structure is a network, then its integration indicates that each sector influences and is influenced by the rest, is an intermediary between one and the next, and has close relationships; it therefore comprises a complex structure (Hausmann et al., 2014).
One tool to measure integration is graph theory with centrality, which can be applied to both binary and valued graphs (Beaton et al., 2017; Borgatti and Everett, 2006; Freeman, 1979; Hausmann, et al., 2014; Márquez, 2016). For this study in particular, non-reciprocal binary graphs were used, measuring three aspects useful to analyzing the spillover of manufacturing exports into the economic sectors.
1.1 Spillover Based on the Miyazawa Decomposition
The Miyazawa multipliers (1971) decomposition emerged in an endeavor to demonstrate that services were not playing a secondary role in the economic system; in other words, their activity was not the consequence of transactions carried out by the industry in any given economic variable, as is the case of income, whose limitation was to “treat the services sector as a final good” (Miyazawa, 1971, p. 15). The IOM can analyze the interdependence between the manufacturing and services sectors in intermediate and final inputs; with this model, the product multipliers are broken down by group of sectors to reveal their interdependence. Miyazawa analyzed the input-output tables (IOT) for six countries, published between 1958 and 1960, and concluded that the capacity of manufacturing to induce services is greater than vice versa; nevertheless, with the assertion that such results would be truer if the tables were homogeneous in their disaggregation and mercantile values.
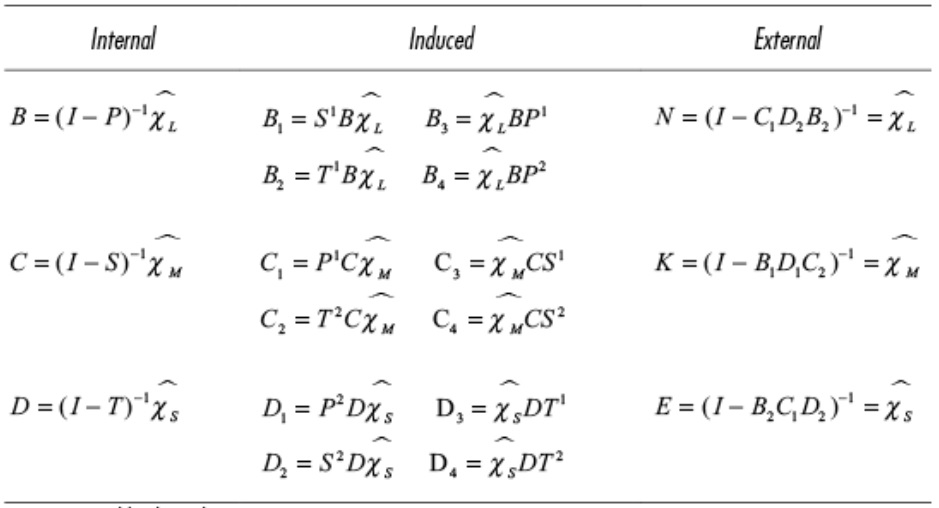
The Miyazawa decomposition highlights three effects: 1) the internal effect measuring the monetary units necessary within a group to cover variations in the product, 2) the inter-sectoral or induced effect, which in turn is broken down into two more -the internal effect of one group on the goods produced by it and consumed as an input by the others and the goods produced by another in the propagation of the internal effects of a given group-, and 3) the external effect, measuring one group’s internal activities impact on the consumption of inputs produced by others within by group (see Table 1).
The Miyazawa multipliers decomposition (1971) has been extended to income and employment multipliers (Hewings et al., 2001; Garay et al., 2016), environmental affairs (Fritz et al., 1998; Okuyama, 2004), at the methodological level, looking at the size of linkages to analyze sectors defined as key (Guilhoto et al., 2005), and even very close to inter-institutional linkages (Blancas, 2006).
Yet, no paper has yet used the Miyazawa decomposition to analyze the role of industrial exports in economic growth. The multiplier decomposition, like the regional IOM, concludes that the total effect is composed of the internal, the spillover, and the feedback. This paper measures the spillover of the export multiplier for the primary, secondary, and tertiary sector.
2. THE MODEL
As part of the IOM, the gross production value is determined as:
Where I is the identity matrix, A is the matrix of technical coefficients that shows the proportion of inputs with respect to the level of product in each sector, f is final demand, and L is the matrix of product multipliers. This definition can be used to calculate the product generated by exports, as follows:
Where χ
χ
is the product resulting from exports and χ is the export vector. If χ is substituted by a coefficient vector
Based on that, Table 1 shows the decomposition of (Lχ) . The induced effects are calculated in two senses: for example, B 1 is the spread of the inputs consumed in exporting the manufactured good on the effects of internal production of the primary good and B 2 is the spread of the internal production of the primary on the consumption of inputs in exporting the secondary; these effects measure inter-sectoral feedback in the economy (García et al., 2007, p. 168). The external effects can be understood as the spillover from one group of sectors to the others; the matrices N, K, and E in the right column of Table 1 measure such an effect. So, K refers to the spillover of manufacturing sector exports into the primary group and services production.
In the IOM qualitative analysis, it is possible to diagnose the degree of integration in the structure, going beyond the metric indicators available in the IOM (Blancas and Solís, 2005); nevertheless, networks represent a specific effect across the sectors (Aroche, 1996; Holub et al., 1985). The qualitative analysis transforms the matrix of technical coefficients into a binary arrangement associated to a graph representing a subset of inter-industrial relationships. Here, the transformation criterion depends on the coefficients of the share of the sectoral product in the total multipliers effect (Oosterhaven and Stelder, 2002) and the position of the sectors pursuant to the characteristic A and L values used in the IOM to identify the linkages held by the industries, whose results are normalized (Dietzenbacher, 1992), so the dispersion indices pertaining to the entry values in A 3 (Laumas, 1976) are used.
With the above said, the calculation of the degree of complexity of the transformation of A into the binary arrangement is as follows:
Where t is the unit column vector; W is the binary matrix with the main diagonal equal to zero; n is the number of elements in the structure, and (3) measures the outgoing influences from one sector to the rest.
Closeness is the shortest path from one node to another (geodesic), meaning that the path from point a
i
to a
j
is equal to that from a
j
to a
i
; so it is length 2, and the perfect
Finally, the degree of intermediation is also considered length 2 and is defined as follows:
Where IT
i
represents the total number of intermediations that each sector generates and
3. GROWTH AND EXPORTS
According to the ECLAC (2013), reports on the relationship between growth and exports have gone through three phases: optimistic, pessimistic, and the current state of affairs, up for debate. For example, in the case of Colombia and Mexico, the effects of export growth hardly explain the growth in product (Cáceres, 2013; Cuadros, 2000); in Brazil and Mexico, exports have had favorable effects on productivity (De Souza and García, 2015) and the terms of exchange (Fraga and Moreno, 2015). Growth in world trade has been made possible thanks to technological development, which has enabled the widespread segmentation of productive processes (Feenstra, 1998). In light of this new division of labor, economies are joining segments of the productive chains, disintegrating within and integrating abroad (Romero et al., 2009); nevertheless, such integration depends on the exported volumes and the partners with which a country is trading (Beaton et al., 2017), as there are actors that are more central in the global trade networks and allow one economy to interrelate with others.
Setting aside the Caribbean, the ECLAC estimates that Latin America has experienced a product growth rate of 2.9% between 1995 and 2015 in constant 2010 dollars; in 2015, the continent reached approximately 5.6 trillion dollars, of which Argentina, Brazil, Chile, Colombia, Costa Rica, and Mexico contributed 84.7% (Brazil and Mexico alone creating 74%).
Table 2 shows the average product growth rate, as well as foreign transactions and the coefficient of correlation between the product and exports and imports pursuant to ECLAC data for the product and OECD data for trade. The data show that, except in Chile and Mexico, export growth has not exceeded import growth, and it is only in Costa Rica where the product/export correlation coefficient is higher than that of product/imports.
Table 2 Average Product, Export, and Import Growth Rate (%) and Correlation Coefficients 1995-2015

Source: Created by the author with data from ECLAC and the OECD
Brazil displays a noteworthy average contribution to the continent’s overall product, coming at 43%, with imports growing more than exports and their correlation to the product similar. It is likely that Brazil has a stable effect of internal and total spillover of exports to the product.
Industrial exports have the greatest weight in total exports; for example, in 2015, Brazil exported 35.4 billion dollars of which 74.6% were industrial. The economies have an average industrial export share of 69.7% of the total. Only Colombia’s share was low, at 44.2% (15.7 billion dollars). At the sector level, Table 3 shows the breakdown and average export/import growth.
Table 3 Composition and Percentage Growth of Exports/Imports at 2010 Prices(1995-2015)
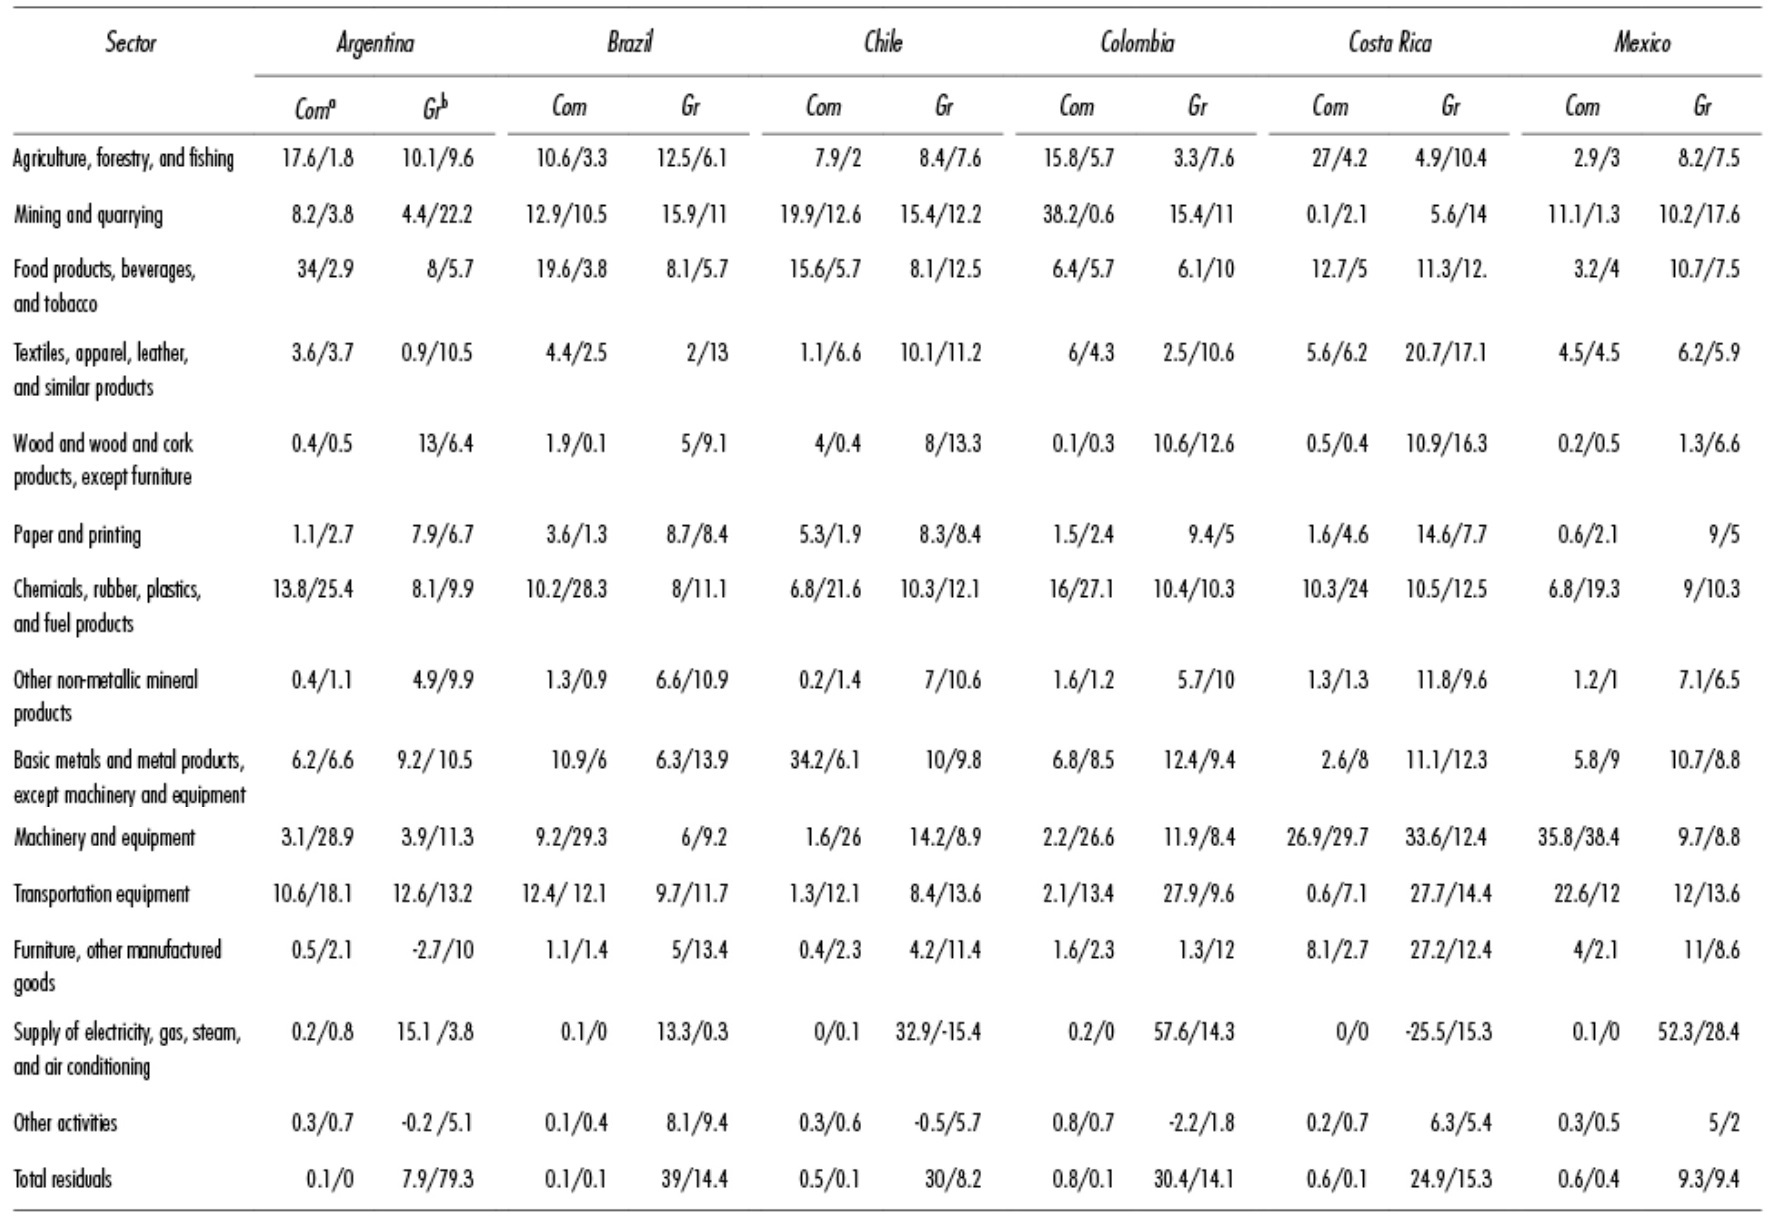
a: Com = composition, b: Gr = Growth
Source: Created with OECD data.
The industries contributing the most to exports are food products, beverages, and tobacco in the case of Argentina and Brazil (34% and 19%, respectively). In Chile, the basic metals and metal products, except machinery and equipment (34.2%); in Colombia, mining and quarry activities (38.2%); and in Costa Rica and Mexico, machinery and equipment (26.9% and 35.8%, respectively). There is no export industrial activity characterizing the group of six countries; nevertheless, the most dynamic sector is mining and quarrying in Brazil and Chile (15.6% on average); in Argentina, wood and byproducts and cork, except furniture (13%); machinery and equipment (33.6%) in Costa Rica; and in Colombia and Mexico, transportation equipment (27.9% and 12%, respectively).
Of the top five trade partners, the United States is number one, with the exception of Argentina, whose number one trade partner is Brazil. Thus, the fact that the United States is the most important trade partner for Latin America may be one reason explaining the successive decreases in the product that the region has suffered (1999, 2001, and 2008).4
Machinery and equipment imports are ranked first in five countries. In Colombia, the chemical products, rubber, plastics, and fuel products sector (27%) is first; it is the number two importer of the group, and the number one of the group is the second in Colombia. Nevertheless, in terms of growth, they are not the most dynamic sectors, and there is not even a pattern of similarity seen in this indicator across the countries as a whole; in fact, imports behave rather heterogeneously across the sectors. Specifically, Colombia and Mexico have a dynamic import sector in the service sector, electricity supply, gas, steam, and air conditioning, with growth of 14.3% and 28.4%, respectively; Brazil, Chile, and Costa Rica are industrial importers with an average growth rate of 14.8%, and in the primary sector, mining and quarrying with 22.2% in Argentina.
Of the central suppliers, the United States is at the top once again, although it is only the number two supplier to Argentina, where Brazil comes first. Several suppliers are common across the countries, like Germany, Japan, and China; however, in Mexico, there are no major amounts of imports coming from Latin America, but the rest of the countries do have at least one major regional supplier, like Brazil, in the case of Argentina, Chile, and Colombia.
Argentina, Brazil, and Chile enjoy a trade surplus, while Mexico, Costa Rica, and Colombia have a trade deficit. Is it therefore possible that the spillover from exports is more favorable in those countries that have a trade surplus versus those with a trade deficit? The answer may be that countries with a higher surplus are able to export more because their sectors are better integrated into the productive structure, but it has also been pointed out that in world trade networks (Beaton et al., 2017), Latin America's biggest economies get a leg up by linking up with the central nodes, as is the case of Mexico, which is indirectly involved in the segmentation of productive processes by way of the United States.
3.1 Results
Using the OECD IOTs from 2011, Table 4 presents the average results of the groups of sectors and the economy and the product multipliers (L), the net product multipliers (L v) and the export multipliers (L x) , the latter broken down into internal (Int), meaning those generated within the group, and spillover (Sp), which is what one group of sector spills over into another, for the total number of economic transactions, all aggregated to one decimal place.
Table 4 Average Effects of the Total Export Multiplier by Sector on the Product.

Source: Created using the OECD IOT, 2011.
The Table 4 results show that Brazil and Costa Rica are the economies with the highest L (2.21 and 2.15, respectively), while Mexico and Argentina have the lowest (1.87 and 1.99, respectively). These results show that for every pesos that final demand changes, the product grows on average of the economies by 2.05 per peso of demand; nevertheless, in the case of L x , the most noteworthy values are seen in the Chile and Mexico economies, with 0.65 and 0.52, respectively; the lowest, in Brazil and Colombia, with 0.18 and 0.29, respectively; one reason for these results is due to economic liberalization in these countries.
In countries with a trade surplus, the L x spillover is notably in the primary sector in Brazil and Argentina. In Chile, the industrial sector, with an outcome of 0.46, which means that for each unit of currency exported, the manufacturing sector generates spillovers in that amount over the level of the primary and secondary product. In the trade deficit group of countries, the biggest spillover is seen in industry in Mexico and Costa Rica (0.36 and 0.25, respectively). Top in the case of Colombia is the primary sector (0.21).
The results for L v divide the countries into three groups, by the average on the structure. Brazil has the highest L v (0.06); the second group is Argentina, Chile, Colombia, and Costa Rica (0.05); and, finally Mexico (0.04). One feature of these results is that the average L v is higher in the primary sector, followed by the services sector, and, finally, the manufacturing sector. Nevertheless, the Brazilian manufacturing L v is once again the greatest.
At the disaggregated level, the results of the multipliers are given in Table 5. Grosso modo, the highest L are found in the manufacturing group. In Argentina and Mexico, of note are the L in sector 14, computers, electronic and optical equipment; in Brazil, sector 16, motor vehicles, trailers, and semi-trailers; in Chile, sector 5, wood and wood and cork products; in Colombia, sector 17, other transport equipment; in Costa Rica, sector 7, coke, refined oil products, and nuclear fuel.

In L X , of note in Argentina is sector 17, other transport equipment; in Brazil and Colombia, sector 2, mining and quarrying; in Chile, sector 16, motor vehicles, trailers, and semi-trailers; in Costa Rica, sector 11, basic metals; and in Mexico, sector 14, computers, electronic and optical equipment. Precisely, these are the sectors that generate the most spillover. Finally, the L v point to sector 3, food products, beverages, and tobacco in Argentina, Brazil, Colombia, and Costa Rica; and in Chile and Mexico, sector 21, wholesale and retail trade, repairs.
Table 6 shows the productive sectors that have linkages and spread above the average. The table contains the sector number and origin by the initials of each country; for example, 2Ch means sector 2, mining and quarrying, Chile. The results reveal that Chile, Colombia, and Mexico have the most sectors with this characteristic. Primary activities are key in surplus countries and in Mexico. It is also shown that the sectors with the biggest spillover are key sectors.

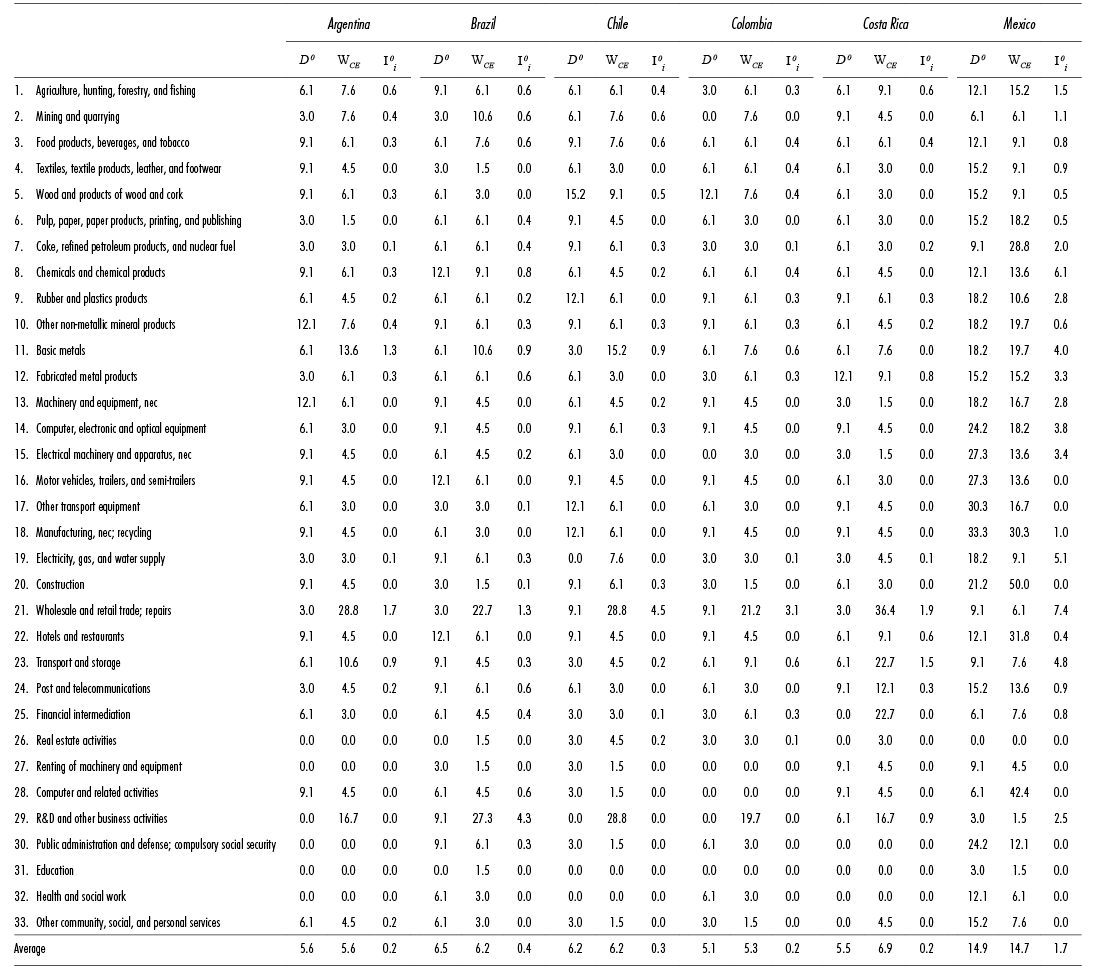
In Tables 5 and 6, the centrality of the inter-industrial networks was calculated in each country,4 the results of which are shown in Table 7; this table reveals that the average complexity of the networks is ordered as follows: Mexico (14.9%), Brazil (6.5%), Chile (6.2%), Argentina (5.6%), Costa Rica (4.2%), and Colombia (5.1%). Intermediation is the best indicator of productive integration, as it involves the emission of influence, and direct and indirect relationships between activities; the results thus confirm the findings of Benavente et al. (1996), the reorientation of the regional productive structure of industry has been toward natural resources and services. The results corroborate the sector 11, basic metals, activities display the greatest degree of integration in Argentina, Brazil, Chile, and Colombia; in Costa, Rica, it is sector 1, agriculture, hunting, forestry, and fishing; and sector 12, fabricated metal products; in Mexico, it is sector 8, chemical products and chemicals, and sector 14, computers, electronic and optical equipment. In the services group, the sector with the greatest degree of articulation across all of the countries is branch 21, wholesale and retail trade, repairs.
If in the international trade network countries are articulated around central agents, linking up with them spurs greater spillover and diversification of the economic structure, which boosts employment and income. The Mexican economy gets a bigger boost than the rest of the countries, and these benefits are shown; for example, employment has grown (Ruiz and Ordaz, 2011), but given the level of integration in each of the economic structures, the spillover from export activities expands into only a few industries, and is articulated around the service sectors, so the results are modest.
4. FINAL CONSIDERATIONS
In the debate surrounding the effects of exports in Latin American economies and the world, this paper has shown that the amount and role of the export sector only gives a small boost to an economy if the economy has weak productive integration. The assertion is that dependence on intermediate imports makes economies fragile. This weakness is due to a lack of structural articulation, which results in requiring lots of imported inputs.
The premise that the more integration an economy has the better developed it is is appropriate; nevertheless, the techniques may be challenged. The multipliers criterion for key sectors means that the farther away the average effect of these sectors from the average of the effects of the structure, the greater the degree of integration an economy experiences. This diagnostic methodology, in the cases studied, showed that the spillover of industrial exports is articulated around inter-industrial networks of the natural resources and services activities.
Specifically, in the spillovers of trade in Argentina, Brazil, Chile, and Colombia, activities pertaining to the basic metals have benefited the most from export activities; in Costa Rica, fabricated metal products, and in Mexico, chemicals, computers, and electronic and optical equipment.
The structural transformation of Latin American industry toward the services sector has been a turn toward articulating productive processes, fundamentally wholesale and retail trade, and repairs. Latin America requires another structural transformation, from using imported intermediate inputs to national inputs, placing emphasis on the suppliers of those articulating and key sectors in the economic system. This would have to be one of the pillars of industrial policy, as well as an attempt to pursue the idea that the greater the productive integration, the better the development level.
REFERENCES
Aroche, F. (1996), "Important Coefficients and Structural Change: A Multilayer Approach", Economic Systems Research, vol. 8, núm. 3, United Kingdom, julio. [ Links ]
Beaton, K., Cebotari, A., Ding, X. y Komaromi, A. (2017), "Trade Integration in Latin America: A Network Perspective", IFM Working Paper, USA, junio. [ Links ]
Benavente, J. M., Crespi, G., Katz, J. y Stump, G. (1996), "La transformación del desarrollo industrial de América Latina", Cepal, núm. 60, Chile, diciembre. [ Links ]
Blancas, A. (2006), "Interinstitutional Linkage Analysis: A Social Accounting Matrix Multiplier Approach for The Mexican Economy", Economic System Research, vol. 18, núm 1, United Kingdom, marzo. [ Links ]
Blancas, A. y Solís, V. (2005), "Pretopological Analysis on The Social Accounting Matrix for Eighteen-sector Economy: The Mexican Financial System", en J. Leskow, M. Puchet y L. Punzo (eds.), New Tools for Economic Dynamics, New York, Springer. [ Links ]
Borgatti, S. y Everett, M. (2006), "A Graph-theoretic Perspective on Centrality", Social Networks, vol. 28, núm. 4, United Kingdom, octubre. [ Links ]
Cáceres Rodríguez, W (2013), "Las exportaciones y el crecimiento económico en Colombia 1994-2010", Apuntes del CENES, vol. 32, núm. 56, Colombia, julio-diciembre. [ Links ]
Comisión Económica para América Latina y el Caribe (Cepal) (2013), Comercio internacional y desarrollo inclusivo, construyendo sinergias, Chile, Naciones Unidas. [ Links ]
Cuadros Ramos, A. M. (2000), "Exportaciones y crecimiento: Un análisis de causalidad para México", Estudios Económicos, vol. 15, núm. 001, enero-junio. [ Links ]
De Souza, A. y García, F. (2015), "Una análisis comparativo de la productividad de las industrias manufactureras del Brasil y México", Cepal , núm. 115, Chile, abril. [ Links ]
Dietzenbacher, E. (1992), "The Measurement of Interindustry linkages-key Sectors in The Netherlands", Economic Modelling, vol. 9, núm. 4, octubre. [ Links ]
Di Filippo, A. (1995), "Transnacionalización e integración productiva en América Latina", Cepal , núm. 57, Chile, diciembre. [ Links ]
Feenstra, R. (1998), "International of Trade Desentigretion of Production of Global Economy", Journal of Economic Perspective, vol. 12, núm. 4, USA, octubre-diciembre. [ Links ]
Fraga, A. y Moreno, J. (2015), "Exportaciones, términos de intercambio y ciclos económicos en Brasil y México, Econoquantum, vol. 12, núm. 1, Guadalajara, enero-junio. [ Links ]
Freeman, L. C. (1979), "Centrality in Networks Conceptual Clarification", Social Networks , vol. 1, núm. 3, United Kingdom, septiembre. [ Links ]
Fritz, O., Hewings, G. y Sonis, M. (1998), "A Miyazawa Analysis of Interactions between Polluting and Non-polluting Sectors", Structural Change and Economic Dynamics vol. 9, núm. 3, United Kingdom, septiembre. [ Links ]
Hausemann, R., Hidalgo, C. A., Bustos, S., Coscia, M., Chung, S., Jimenez, J., Simoes, A., Yildirim, M. A. (2014), "The Atlas of Economic Complexity: Mapping Paths to Prosperity", USA, Center of International Development, Harvard University. Harvard Kennedy School, Macro Connetions Media Lab MIT. [ Links ]
Hewings, G., Okuyama, Y. y Sonis, M. (2001), "Economic Interdependence within Chicago Metropolitan Area: A Miyazawa Analysis", Journal of Regional Science, vol. 41, núm. 2, USA, mayo. [ Links ]
Holub, H., Schnabl, H. y Tappeiner, G. (1985), "Qualitative Input-Output with Variable Filter", Zeitschrift für die gesamte Staatswissenschaft /Journal of Institutional and Theorical Economics, Germany, octubre. [ Links ]
Garay, M., Arioca, P. y Soza, S. (2016), "Impacto económico del sector educación en Arica, Valdivia y Punta de Arenas", Magallania, vol. 44, núm. 2, Chile, octubre. [ Links ]
García, A., Aroche, F. y Ramos, C. (2007), "Determinación de coeficientes importantes por niveles tecnológicos: una aproximación desde el modelo de Miyazawa", Investigaciones económicas, vol. XXI, núm. 1, España, enero. [ Links ]
Guilhoto, J., Sonis, M. y Hewings, G. (2005), "Linkages and Multipliers in a Multiregional Framwork: Integration of Alternative Approaches", Australasian Journal of Regional Studies, vol. 11, núm. 1, Australia, abril. [ Links ]
Laumas, P. (1976), "The Weighting Problem in Testing the Linkage Hypothesis", Quarterly Journal of Economics, vol. 90, núm. 2, USA, mayo. [ Links ]
Leontief, W (1936), "Quantitative Input and Output Relations in the Economic System and The United States,", The Review of Economics and Statistics, vol. 18, núm. 3, USA, agosto. [ Links ]
Márquez, M. A. (2016), Los sectores de Alta Tecnología en América del Norte: Un análisis de redes interindustriales, Tesis para obtener el grado de Doctor en Economía, México, UNAM. [ Links ]
Miller, R. y Blair, P. (2009), Input-Output Analysis. Foundations and Extentions, New York, Cambridge University Press. [ Links ]
Miyazawa, K. (1971), "An Analysis of The Interdependence between Service and Goods-producing Sectors", Hitotsubashi Journal of Economics, vol. 12, núm. 1, Japan, junio. [ Links ]
Okuyama, Y. (2004), "Modeling Spatial Economic Impacts of an Earthquake: Input-Output Approaches", Disaster Prevention and Management, vol. 13, núm. 4, New Zealand, noviembre. [ Links ]
Oosterhaven, J. y Stelder, D. (2002), "Net Multipliers Avid Exaggerating Impacts: with a Bi-regional Illustration for The Dutch Transportation Sector", Journal of Regional Science , vol. 42, núm. 3, USA, agosto. [ Links ]
Romero, I., Dietzenbacher, E. y Hewings, G. (2009), "Fragmentation and Complexity: Analysing Structural Change in The Chicago Regional Economy", Economía Mundial, núm. 23, España, septiembre-diciembre. [ Links ]
Ruiz, P. y Ordaz, J. (2011), "Evolución reciente del empleo y desempleo en México", Economía UNAM, vol. 8, núm. 23, México, mayo-agosto. [ Links ]
Schnabal, H. (1995), "The Subsystem -MFA: a Qualitative Method for Analizing National Innovation System- The Case of German", Economics System Research, vol. 7, núm. 4, United Kingdom, diciembre. [ Links ]
2These countries belong to the OECD Development Center but in different categories. For example, Chile and Mexico are member countries, Colombia and Costa Rica are in accession to the organization, and Brazil is a key partner.
3When the United States wields restrictive trade policy, as it seems that it will do, it affects trade on the continent.
Received: May 12, 2017; Accepted: October 26, 2017
 Este es un artículo publicado en acceso abierto bajo una licencia Creative Commons
