


Serviços Personalizados
Journal
Artigo
 texto em
  Inglês (pdf)
 Artigo em XML
 Referências do artigo
 Enviar este artigo por email
Indicadores
-
 Citado por SciELO
 -
 Acessos
Links relacionados
-
 Similares em
SciELO
Similares em
SciELO
Compartilhar

 Permalink
Problemas del desarrollo
versão impressa ISSN 0301-7036
Prob. Des vol.49 no.193 Ciudad de México Abr./Jun. 2018
https://doi.org/10.22201/iiec.20078951e.2018.193.63181
Articles
Creativity, Efficiency, and Spatial Concentration in Mexico
1Institute for Economic Research at the National Autonomous University of Mexico (UNAM) and the Acatlán Faculty for Higher Studies, UNAM. E-mail addresses: mara@unam.mx and luquinta@apolo.acatlan.unam.mx, respectively.
Regional competitiveness evolves in close parallel to productivity, which, at present, is increasingly tied to creativity and innovation. A range of studies on the theme recognize that the spatial concentration of creativity drives productivity; nevertheless, few have managed to quantify the magnitude of this relationship. Via a stochastic production frontier analysis, this paper evaluates the levels of technical efficiency and productivity found across Mexico's 59 metropolitan regions (MR) and measures the contribution of the creative activities located in each of them.
Key Words: metropolitan zones; regional competitiveness; technical efficiency; and productivity; production and efficiency frontier models
La competitividad regional cambia estrechamente con la evolución de la productividad y en la actualidad, con mayor frecuencia, se vincula con la creatividad y la innovación. En los diferentes estudios sobre el tema se reconoce que la concentración espacial de la creatividad es un motor de la productividad, sin embargo, pocas veces se logra cuantificar la dimensión de dicha relación. Mediante un análisis de frontera de producción estocástica se evalúa los niveles de eficiencia técnica y productividad de las 59 zonas metropolitanas (ZMS) de México y se mide la contribución de las actividades creativas localizadas en ellas.
Palabras clave: zonas metropolitanas; competitividad regional; eficiencia técnica y productividad; modelos de frontera de producción y de eficiencia
Clasificación JEL: C33; D24; L60; R11
La compétitivité régionale évolue en fonction de l'évolution de la productivité et, de nos jours, cela est plus souvent lié à la créativité et à l'innovation. Dans les différentes études sur le sujet, il est reconnu que la concentration spatiale de la créativité est un moteur de productivité, mais il est rarement possible de quantifier la dimension de cette relation. Grâce à une analyse des limites de la production stochastique, les niveaux d'efficacité technique et de productivité des 59 régions métropolitaines (ZMS) du Mexique sont évalués et la contribution des activités créatrices qui s'y trouvent est mesurée.
Mots clés: zones métropolitaines; compétitivité régionale; efficacité technique et productivité; modèles de frontière de production et d'efficacité
A competitividade regional muda de forma estreita com a evolução da produção e, na atualidade, com maior frequência, ela tem ligação com a criação e a inovação. Nos diferentes tipos de estudos sobre o tema, se considera a concentração espacial da criatividade como um motor da produtividade, contudo, poucas vezes se logra quantificar a dimensão desta relação. Através de uma análise de fronteira de produção estocástica, se avalia os níveis de eficiência técnica e produtividade das 59 zonas metropolitanas (ZMS) do México e se mensura a contribuição das atividades criativas localizadas nelas.
Palavras-chave: zonas metropolitanas; competitividade regional; eficiência técnica e produtividade; modelos de fronteira de produção e de eficiência
区域竞争力和生产力的发展紧密相关,当今,生产力又常常因创造和创新而提升。在关于该议题的不同研究中,都承认,创新性的空间集聚是生产力提升的引擎。 但是很少有这种关系维度的量化研究。通过对随机生产的边界分析,本文对墨西哥59个大都市区(mz)的技术效率和生产力进行了评估,并测量了其中创造性活动的贡献。
关键词 都市区; 区域竞争力; 技术效率和生产力; 生产及效率的边界模型
1. INTRODUCTION
The initial impetus for this work entailed constructing regional indicators of competitiveness in Mexico, specifically, in 59 metropolitan zones in which, pursuant to the latest census data, around 70% of the gross domestic product (GDP) is generated, and where 57% of the population lives. Analyzing the competitiveness of cities and regions has become an in-vogue topic in the field of regional studies, giving rise to numerous indices of local or regional competitiveness, which are then used to conduct draw comparisons and make rankings. Krugman (1994) called the affair a "dangerous obsession."
Despite the wide range of available indices -Berger (2011) came up with a list as of 2009 of at least 217 different competitiveness indices- it is unclear what they measure or how these measurements are bound up in a region's prosperity (Martin et al., 2004).
The idea of regional competitiveness has run up against criticism, considering that regions themselves cannot compete, at least not in the same way companies do (Krugman, 1994; Martin et al., 2004). Nevertheless, competitiveness is simply another way to speak of productivity, Krugman (1994) claimed; in our view, it makes sense to the extent that productivity can still be approached within the framework of economic theory, while competitiveness is a more open, one might venture multidisciplinary, concept. Accordingly, efforts ought to be channeled into measuring productivity and the sources or drivers of its growth.
This is a recurring problem, or at least it has been since Solow's (1957) 2 paper was published on the appearance of new methodologies revising aggregate productivity or total factor productivity (TFP) measurements and other structural aspects of an economy, such as technological change and, more recently, changes in productive efficiency. The downside of using the Solow approach is that it fails to truly identify the sources of TFP growth. It is just an accounting breakdown (Barro and Sala-i-Martin, 2003). It is unable to pinpoint whether TFP growth is coming about via technical change or improvements in efficiency.
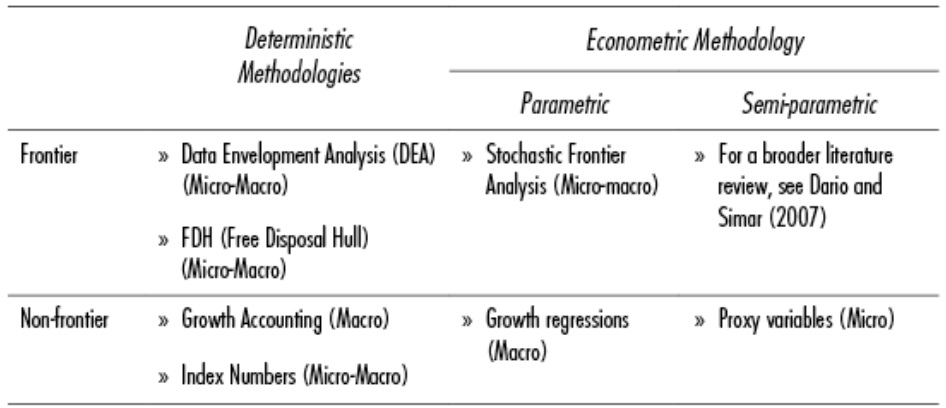
Luckily, in the production (or cost) frontiers field, many alternative methodological possibilities have emerged to measure TFP (Table 1 summarizes a brief taxonomy). Of this wide range, only those stochastic frontier models taking into account an estimate of inefficiency were considered, to the extent that if inefficiency is not reflected, the estimated measure of productivity growth could be biased, without any notion of the precision involved (Grosskop, 1993, sec. 4.3.2, p. 173).
As such, this study is interested in why these models make it possible to construct relationships between productivity and technical efficiency, which are economic concepts frequently employed to analyze the economic performance of observed economic units (states, regions), and both are directly tied to the same production theory framework (Nishimizu and Page, 1982; Kumbhakar et al., 2000; Lobo et al., 2013). With these stochastic production frontier models, it becomes possible to decompose TFP growth into its sources ("causes"): technological change, changes in technical efficiency, and change of scale. In the context of production theory, it is therefore possible to establish an analytical bridge between competiveness, productivity, and technical efficiency.
The strategy to estimate TFP requires a prior estimate of the level of efficiency and how it has changed over time, as it is one of the three components mentioned. This study makes an initial approach with this sort of methodology with a scope restricted, initially, to exploring the role played y the creative sector in driving technical efficiency in metropolitan zones.
This is an economic sector that is at present at the heart of TFP growth in several urban hubs or dynamic regions in both Mexico and across the globe. The scope of this application is also constrained by the information available. We are working with a short panel in time, and it has to restrict the specification of the basic model implemented.
As a result, this study sets out primarily to find empirical evidence for the following working hypothesis: the creative sector plays an important (significant) role in reducing productive inefficiency in metropolitan zones, as part of broader mechanisms that capture the effects of economies of agglomeration, spillover effects, or positive externalities favorable to endogenous growth in Mexico’s urban hubs. The evidence from European cities reveals that creative activities tend to have a significant impact on discrepancies in productivity, by raising the number of innovations via the creation of new products and varieties (Boix and Soler, 2014).
With that in mind, this paper conducted an analysis of technical efficiency in the 59 metropolitan regions throughout the Mexican republic, quantifying their technical efficiency levels (average), ranking them hierarchically, and estimating the effect of the creative sector on driving efficiency.
This paper is composed of six sections. The second offers an overview of fundamental contributions to the topic; the third and fourth discuss the measurement methodology and introduce the empirical model underpinning the analysis; the fifth shows the descriptive statistics and interprets the results. Finally, section six presents some final considerations.
2. LITERATURE REVIEW
Traditionally, productivity in cities has been directly tied to some type of economy of agglomeration (Fujita et al., 1999; Fujita and Thisse, 2002). Companies try to set up shop where there are already other companies. Marshall (1981, 2006) already noted that advantages of that location are to be had, via access to concentrations of inputs and specialized labor and the "spillover" of knowledge and innovation. Melo et al. (2009) contains a broad meta-analysis of 24 papers published on the relationship between economies of agglomeration and productivity, from which it emerges that the effects on productivity depend on characteristic effects (belonging to) the region, its industrial coverage, and, in general, the way economies of agglomeration are structured. In a context like that, what has come to be known as human capital, which includes aspects pertaining to the quality of the workforce, is undoubtedly a vehicle or part of a mechanism to transmit the (non-observable) impact of technological capture, location, and more (Ghosh and Mastromarco, 2013). The idea consists of building a bridge between productivity and the performance of sectors characteristic to a regional economy, as is the case of the creative sectors.
Since the nineteen-nineties, the literature on the role of the creative economy has taken off. Analysis has focused on studying creative cities (Yenken, 1988; Landry and Bianchini, 1995; Landry, 2000), the creative industries (Pratt, 1997; Higgs et al., 2008; UNCTAD, 2010; DCMS, 2015) and the creative classes (Florida, 2002, 2004, and 2008). One aspect common to these different studies and outlooks is that they agree on the fact that creative activities have gained a great deal of relevance in understanding the forces that detonate growth and economic and social development in the most dynamic regions in the world.
There is as of yet no clear and precise conceptualization as to how a creative economy or creative activities should be understand, in large part as a result of the very breadth of how creativity is understood: “a process to generate something new based on the combination of already-existing elements” (Candance et al., 2015, p. 3). Originally, the idea of the creative industries was tied to culture (DCA, 1994) and the first alternative measurement methodologies were developed for the United Kingdom, focusing on activities characterized by talent, skills, and individual creativity (DCMS, 1998 and 2001).
At present, the most significant proposal for defining and recording (measuring) creative industry activities is the formula used by the United Nations in its report on the creative economy, where these industries are defined as generators of symbolic products (UNCTAD, 2008). Table 2 summarizes the activities that UNCTAD considers to be an integral part of the creative activities or industries.

In its most recent report, UNCTAD (2015) measures the high economic impact of the creative industries at present: around the world, the cultural and creative goods and services market as of 2012 was on the order of 547 billion dollars, with a sustained annual growth rate of 8.6% between 2002 and 2012.
Analyses of the creative industries have focused on evaluating their impact on the provision of some sort of urban amenity (Florida, 2004; Glaeser, 2012), the development of new technologies, innovation, and technological change (Cunningham, 2008; Jaaniste, 2009; Lee and Rodriguez-Pose, 2014), the level and type of employment (DCMS, 2016), and productivity (Chapain et al., 2010).
Despite the diversity of the analyses piling up about the creative industries, little headway has been made to understand their role in the unequal development of cities in terms of more efficient usage of available resources by a society. Although it has been acknowledged that the concentration of creative activities drives productivity and has a differential impact on city growth, few studies address this phenomenon in the framework of a production frontier model or seek to quantify the effect of the creative sector on the level of technical efficiency (Mandula and Auci, 2013). At the urban scale, these concepts, fundamental to public policy, implicitly contain the requirement that cities need to be efficient in using resources as a whole. One way to understand this can be the production theory framework, but with the entity of analysis being the region or city.
Accordingly, it is appropriate to delve into the exploration with a sample of 59 Mexican cities in an attempt to quantify the effect of the creative sector on driving levels of technical efficiency; it is a conventional exercise just as if it were any other economic sector (for example, manufacturing). It is therefore necessary to specify that the purpose of the study is not the same as the Mundula and Auci (2013, 2016) study. To analyze creative activities and in this study, the more common classification system proposed by UNCTAD was used, adapted to the North American Industrial Classification System (NAICS). The sectors considered are listed in Table A1 (see Statistical Annex).
3. METHODOLOGY
Although the neoclassical paradigm in production theory supposes that the producers in an economy always operate efficiently (maximum possible product), in reality, they are inefficient. As similar as two companies may be, they never produce the same product, and their costs and benefits are never equal. These discrepancies can be explained in terms of efficiency and several unpredictable exogenous shocks. This is the basic idea that can be conceptually extrapolated for this case to explain differences across Mexican cities in terms of efficiency levels determined by the presence of sectors with creative activities.
Although a wide range of parametric and econometric methods have been developed to measure (in)efficiency, this paper employs the stochastic production frontier model with panel data, the technique originally developed for cross-sectional data by Aigner, Lovell, and Schmidt (1977) and Meeusen and van den Broeck (1977), which have evolved into applications with panel data. For details on the evolution of this methodology, see Kumbhakar et al. (2015), Greene (2008), Kumbhakar and Lovell (2000), and for non-parametric approaches, see Daraio and Simar (2007). In the panel data model framework, drivers of changes in efficiency are initially considered, subsequently leading to families of models, from the basic (fixed and random effects) to the more recent, which better separate the heterogeneity of persistent (or structural) inefficiency and variant inefficiency over time (Kumbhakar et al., 2015).
Generally speaking, production frontier and efficiency models are built as follows. Briefly, given a vector of variables for the input of the producer-i,3 there is a production function f (x
i
;β) , which defines the maximum product possible, meaning a technical or potential maximum, known as the production frontier. What is interesting here is that even when the input vector x
i is exactly the same for different producers, nothing guarantees that they reach the maximum product. In other words, it is very possible for there to be a difference between the observed product y
i
and the potential product, y
i
≤ f (x
i
;β), and the quotient
As an initial approach to the topic, the choice was made to use the Battese and Coelli (1995) panel data model, the first of its kind and in extremely widespread use still, which enables an estimate of the exogenous variables that alter the efficiency level, for example, those pertaining to the creative sector. The notation is direct to the case of panel data and, in practice, it is frequent to use a logarithmic transformation of the variables, so y it is the log of the product for each metropolitan zone ZM-I and time t, x it is a vector (k x 1) of producer-i input variables measured at time t, and there is a vector β of unknown parameters to estimate. A linear form is therefore assumed for f (·) as follows:
The non-observable global error has thus been decomposed into a first component v
it
, which is a random variable that is distributed pursuant to [iid N(0,
Where z it is a vector (1xp) of explanatory variables that could have an effect on the production function of a metropolitan zone and δ is a vector (px1) of parameters to estimate.
Looking at the explanatory variables in z in the inefficiency model, any variable could be included that explains the degree to which observed production falls below the stochastic frontier values.4 The estimate of the parameters defined by equations (2) and (3) is done using the maximum likelihood method. The derivation of the likelihood function expressed in terms of the variance parameters
The Battese and Coelli (1995) model, still in widespread use, does suffer from major weaknesses, one of which is that it is not possible to correct for heteroscedasticity. In the stochastic frontier models and, in particular, maximum likelihood estimates, the presence of heteroscedasticity biases the coefficients by overestimating the intercept and underestimating their slope. That is why Caudill, Ford, and Gropper (1995) extended the model by assuming a functional form for heteroscedasticity (multiplicative type) in estimating the variance, expressed as:
4. EMPIRICAL MODEL
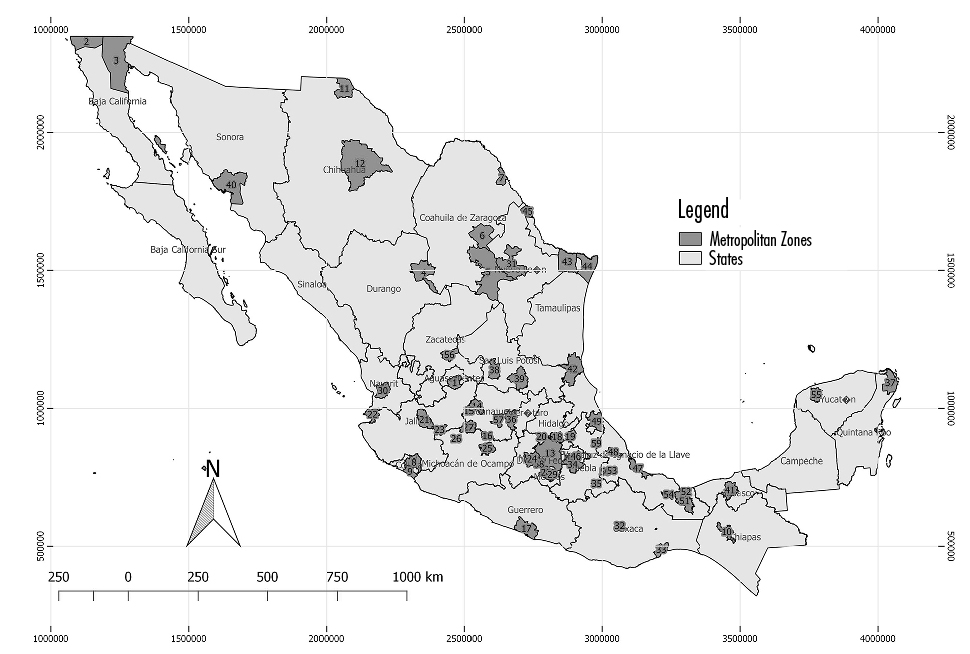
This study analyzed economic performance in terms of efficiency in 59 metropolitan zones throughout Mexico6 (see Map 1) inspired by the smart cities application in Mundula and Auci (2013). Both follow the model specified by Battese and Coelli (1995), using panel data (see Section 5).
The difference between this study and the Mundula and Auci (2013) study resides in the variables used, as the present study drew on conventional variables to measure capital stock and the labor factor as compared to houses per number of residents and length of the public transport network (km) as a measure of the capital factor, the number of employees for the labor factor, as is usual, and moreover added in human capital.
To quantify the effects of the inefficiency of smart cities, Mundula and Auci (2013) employed a set of six indicators in which they add in different observable variables. In this case, as this is a first approach, the variables of employed personnel and number of creative-sector economic units were used as variables indicative of size and concentration.
Equation (2), relativized by a scale variable as a labor factor,7 is thus estimated as an equation in terms of productivity, which is specified via a Cobb-Douglas function, linear in logs, and for our stochastic frontier model, is as follows:
Where the dependent variable is the value of the product ZM-I at time t measured by the log of the quotient between the real gross census added value (VACB) and employed people (PO) in each metropolitan zone in the years 2003, 2008, and 2013. The input variable, also in relation to labor and in logs, was calculated as the quotient of gross fixed capital stock (ABKF) relative to employed people in each metropolitan zone in the same years.
Where EC it is the number of creative economic units in the metropolitan zone i in year t; OC it is the people employed in the creative activities, pEC it is the concentration of creative activities measured by the participation of the creative units in the total productive units (as a percentage), and pOC it is the concentration of creative employment with respect to total employment (as a percentage), both for metropolitan zone i in time period t.
One sensitive aspect in these models is the incorporation of external influences driving the efficiency level. These variables are not under full control of the observed unit (firm, state, region, etc.), but do impact its performance. It is usual in practice to distinguish two types of influences of this sort: i) the characteristics of the observed unit (regional heterogeneity), which affect its potential for individual production; and ii) the factors driving efficiency, such as: characteristics of the population, geographic traits, and other institutional aspects (Kalb, 2010). For each study in particular, underpinned by the economic and statistical theory available, these variables were selected.8 Given the limited scope of this study, it is necessary to explore in this direction.
5. DESCRIPTIVE STATISTICS AND INTERPRETATION OF THE RESULTS
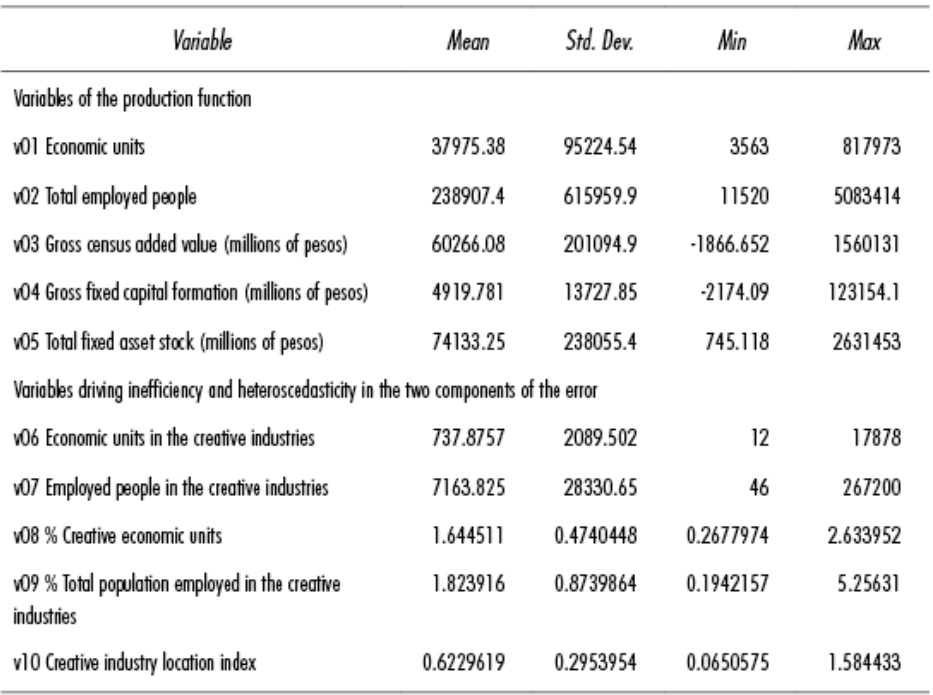
Table 3 provides the basic descriptive statistics for the census variables used in the analysis. At the detailed level, this is a (balanced) panel database consisting of 10 variables measured for each of the 59 metropolitan zones in Mexico in the years 2003, 2008, and 2013.
The estimated production frontier results are summarized in Table 4.9 As is to be expected, capital density (capital per employed man) contributes positively to increasing the product per employed man (equivalent to general labor productivity) in the metropolitan zones, and does so inelastically given that its value is less than 1. This coefficient, which is statistically significant, is interpreted as an increase of 10% in the capital density in the metropolitan zones increases the product pertaining to labor by 4.95%. Because this is a simple model (one input and one output), the sum of the elasticities implies decreasing scale yields.
Table 4 Results of the Productive Efficiency Model in Mexican Cities, 2003-2013
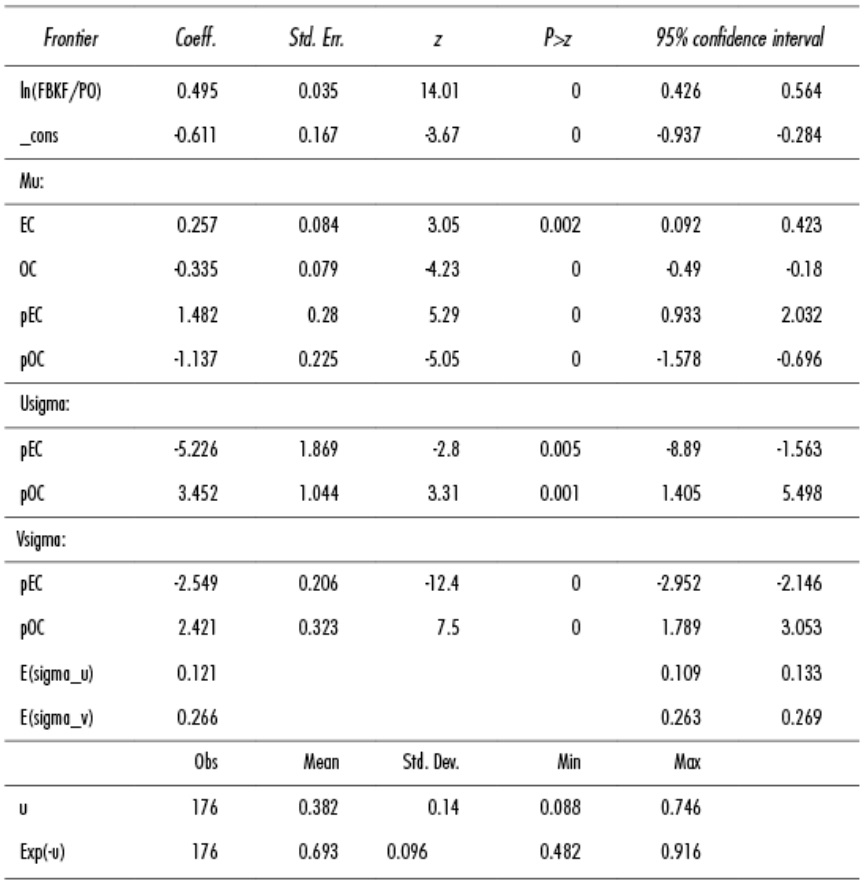
Source: Created by the authors
The coefficients of the four factors driving the technical efficiency level in the metropolitan zones, associated to variables indicating the size (measured by employed people and number of creative economic units) and concentration (measured by their relative shares in the total of the creative activity sector) are statistically significant. The OC and pOC coefficients show negative signs, indicating that both variables have a positive effect on reducing the inefficiency level (or raising efficiency). The other two variables (EC and pEC) display an effect contrary to what was expected, driving up inefficiency (or, on the flipside, diminishing efficiency). This basic, exploratory exercise does come with the inconvenience that it is a short-panel data model,10 which may make it difficult to fully capture the behavior of several variables, such as the number of companies that over time tend to change more slowly than the employed people. Nevertheless, with the information available, it is the best approximation that can be had to the problem under study. Even so, it does contribute empirical evidence to go deeper into the topic.
With these same results from estimating the model (see Table 4), it is shown that the average technical efficiency level at which production is generated in Mexican metropolitan zones is barely 69.3%, which empirically documents the existence of a margin still to be explored in order to improve efficiency in the use of production factors.
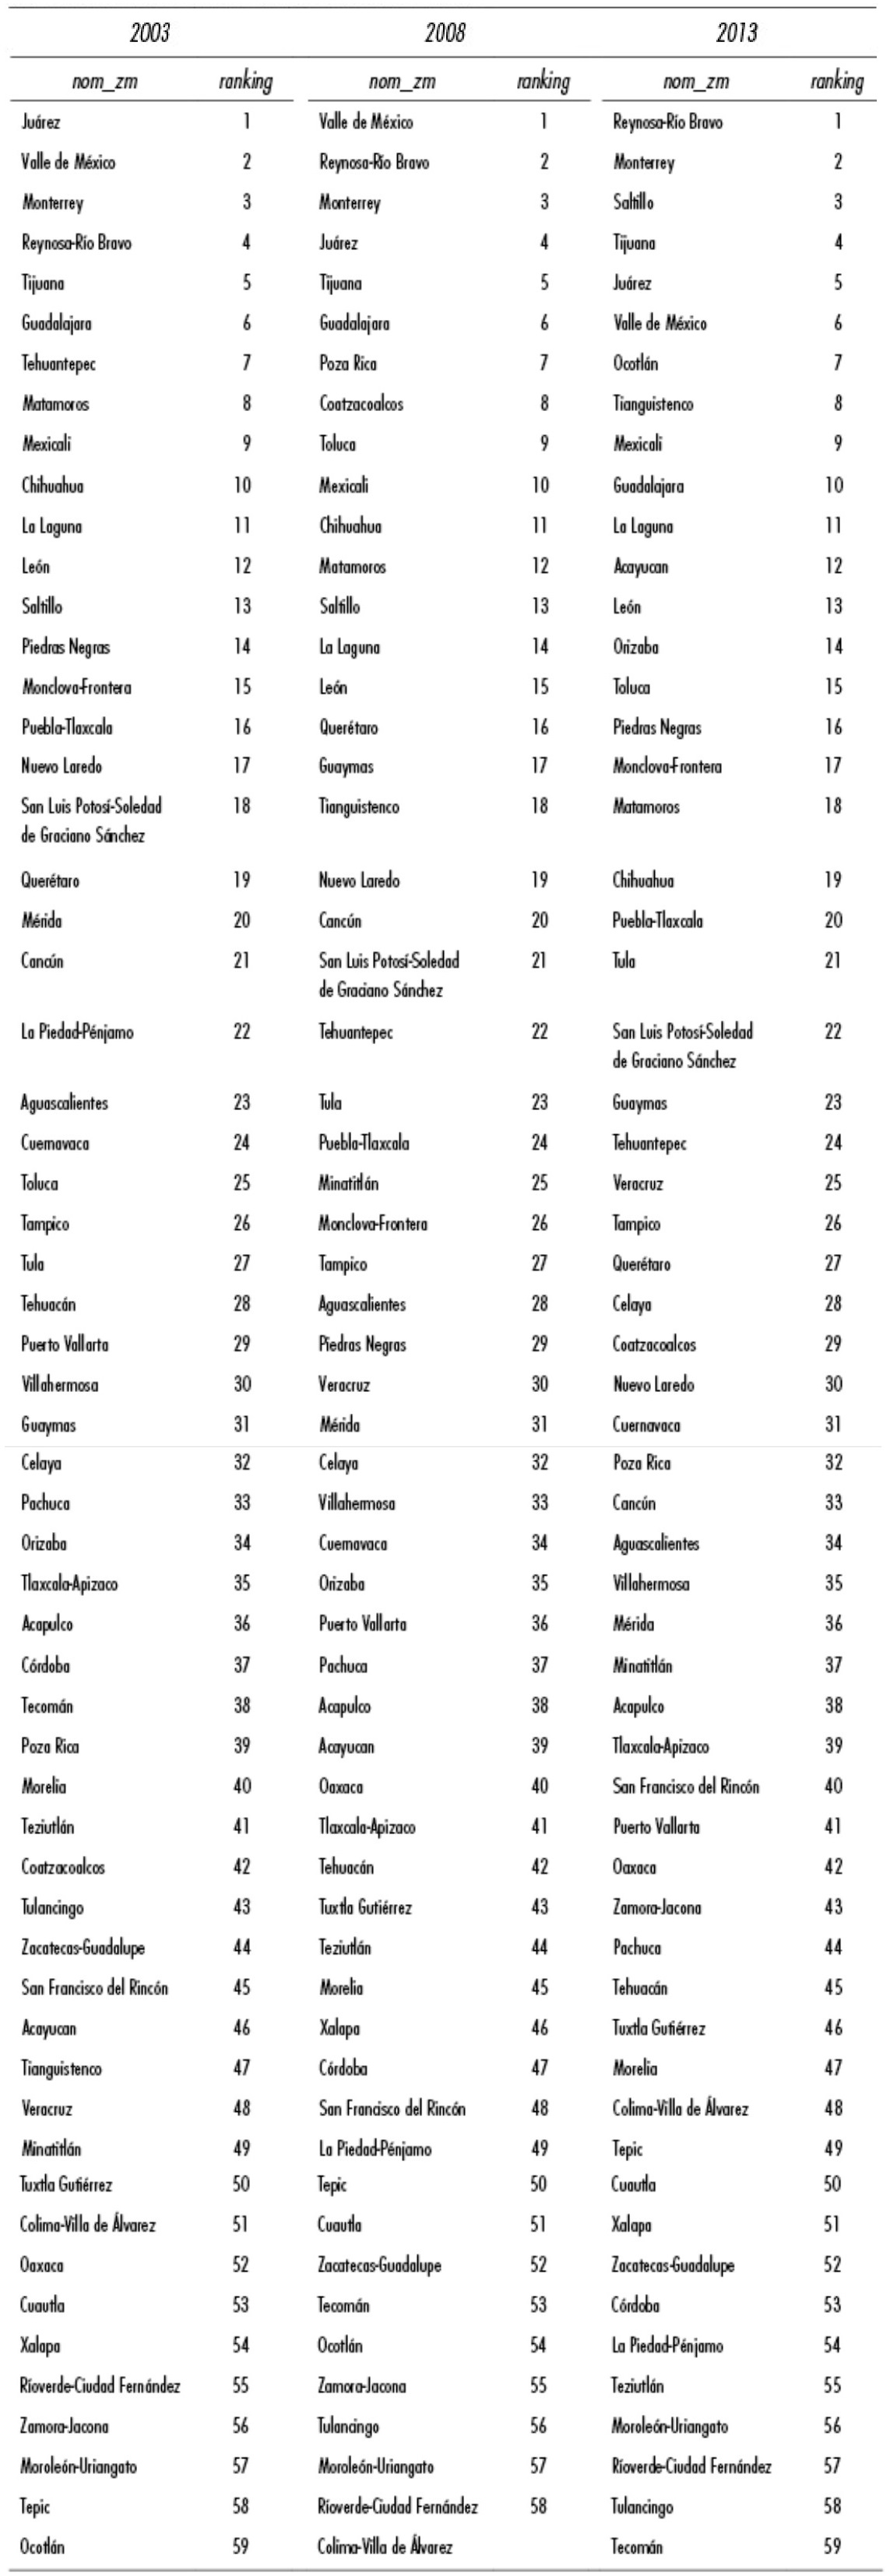
Table 5 shows the ranking of the average (in)efficiency levels over the three years for each metropolitan zone, revealing that the highest levels appear in cities along the northern border of the country; the top two are: Reynosa-Río Bravo and Monterrey; of the ten metropolitan zones with the highest productive efficiency, eight are northern cities, with the exception of Valle de México, in third place, and Guadalajara, in sixth.
Table 5 Technical Efficiency and Inefficiency by Metropolitan Zone, 2003-2013.
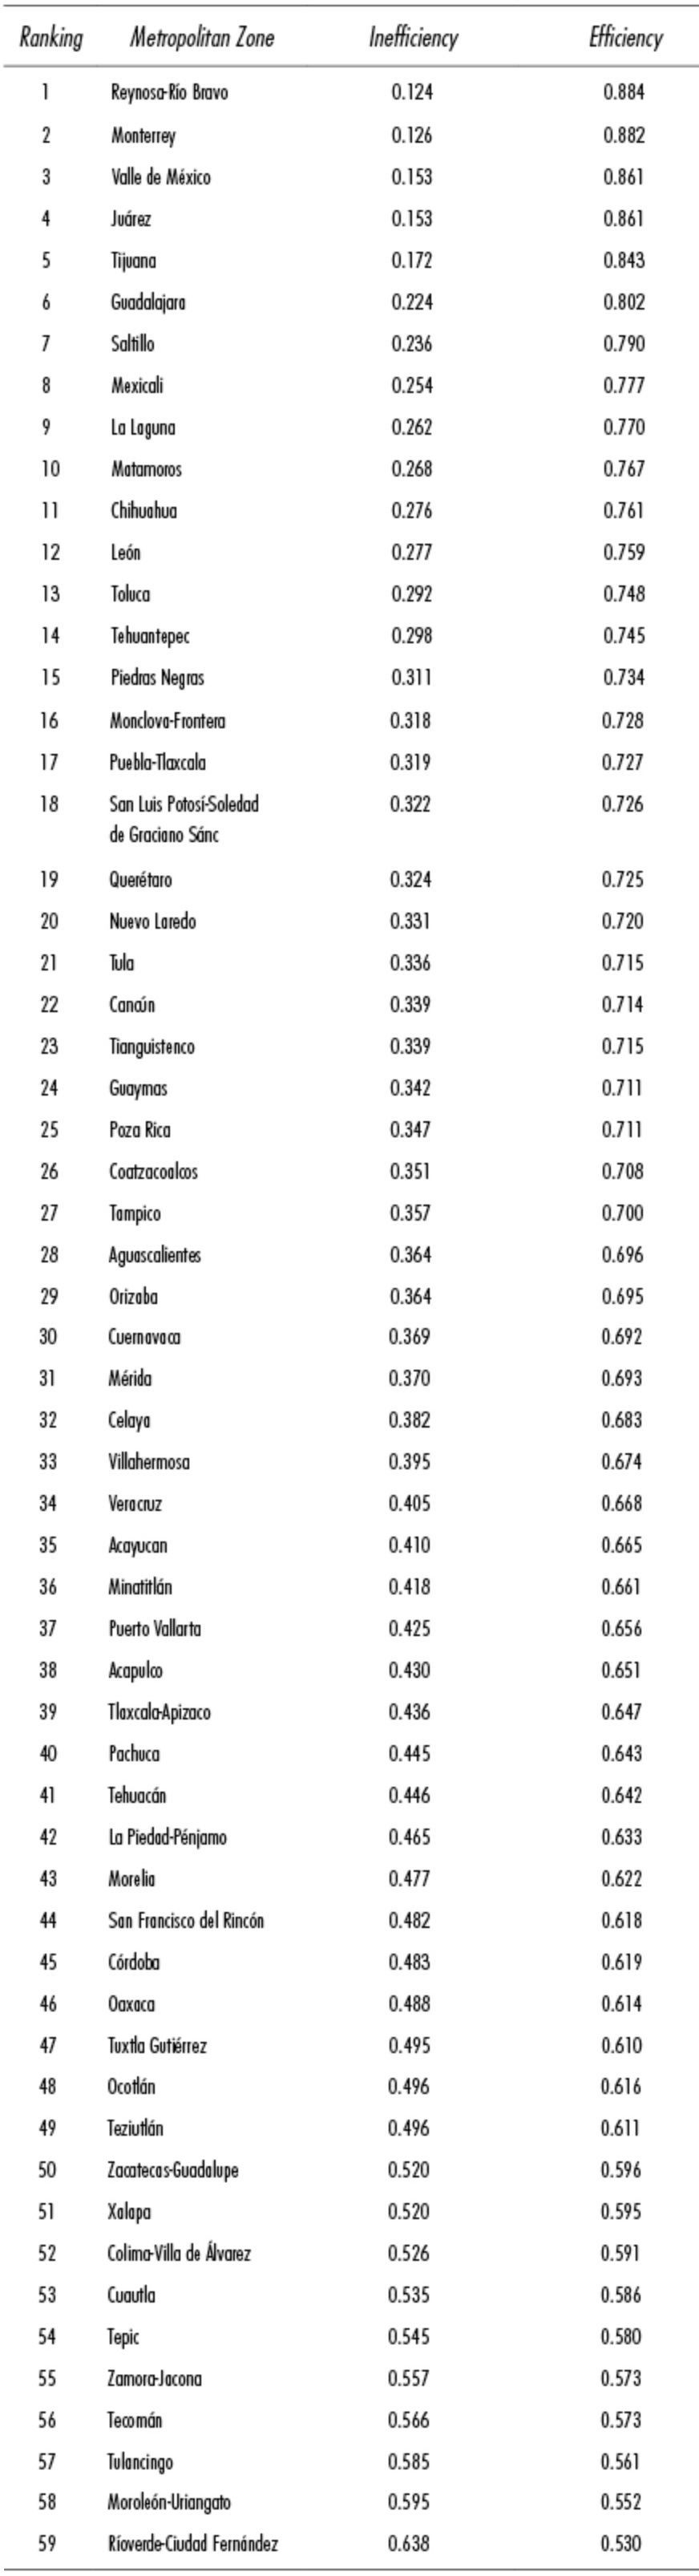
Source: Created by the authors
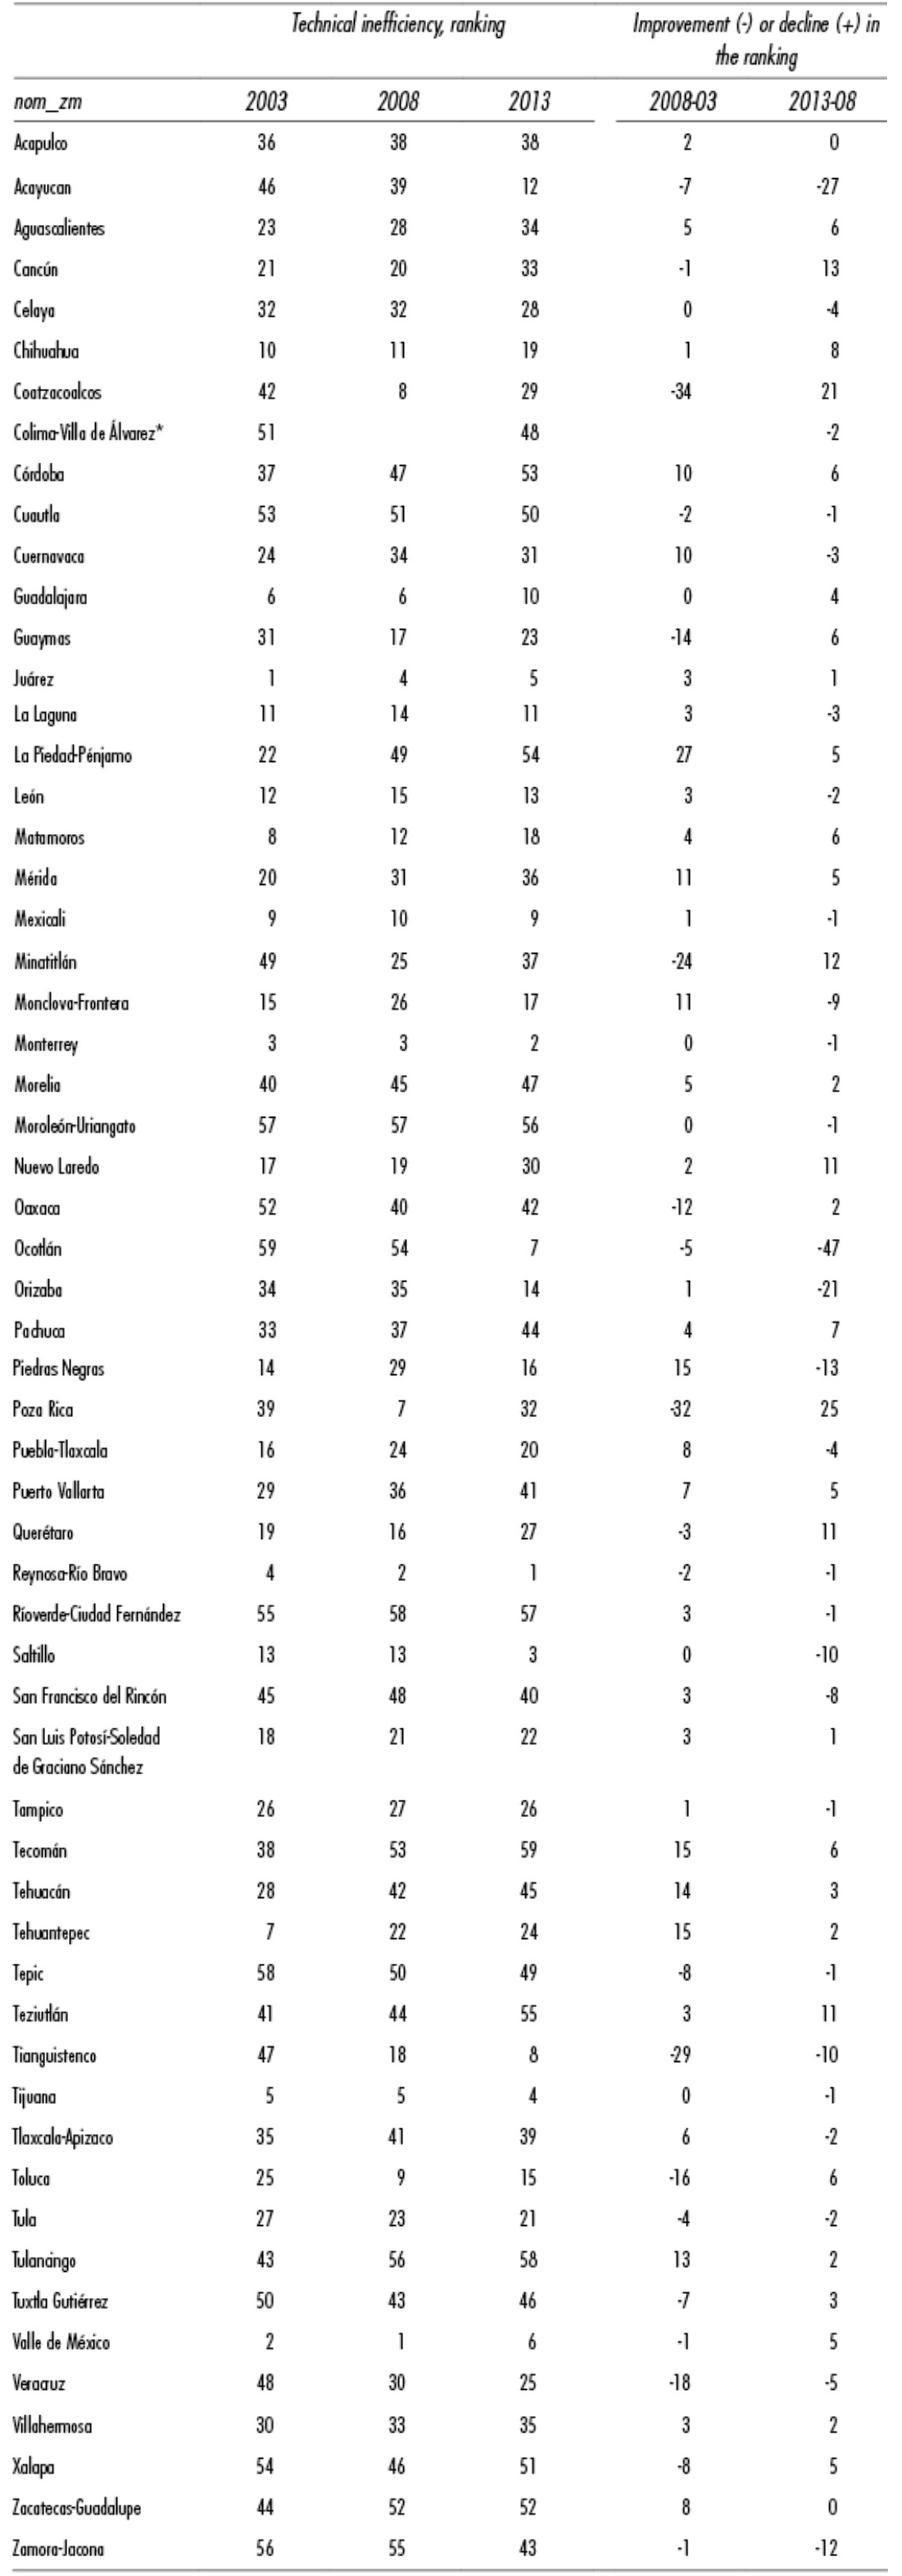
Table A2 presents the ranking of the technical inefficiency values in greater detail for each year in the sample, reinforcing the congruence of the result: the top ten lowest-inefficiency places include the metropolitan zones in the north in all three years, although their rankings among each other did change; Table A3 supplements these results, showing which metropolitan regions rose in the ranking (with negative signs) or got worse in the national ranking (see Statistical Annex).
Looking at the values in this ranking, the map in Figure 1 shows the geographic location of the metropolitan zones by percentile. It emerges clearly that the efficiency levels are not randomly distributed across the national territory, and in effect, the improvement in efficiency (reduced inefficiency) responds to a pattern associated with the most dynamic economic spaces concentrating the metropolitan zones in the meso-regions: center-north with the highest levels of efficiency and center-south with the poorest performance. Dark gray tones point to efficiency above the median. The lighter tones are those below the median. It thus appears that four border cities, Valle de México, and Guadalajara have the highest efficiency percentile (see Figure 1).
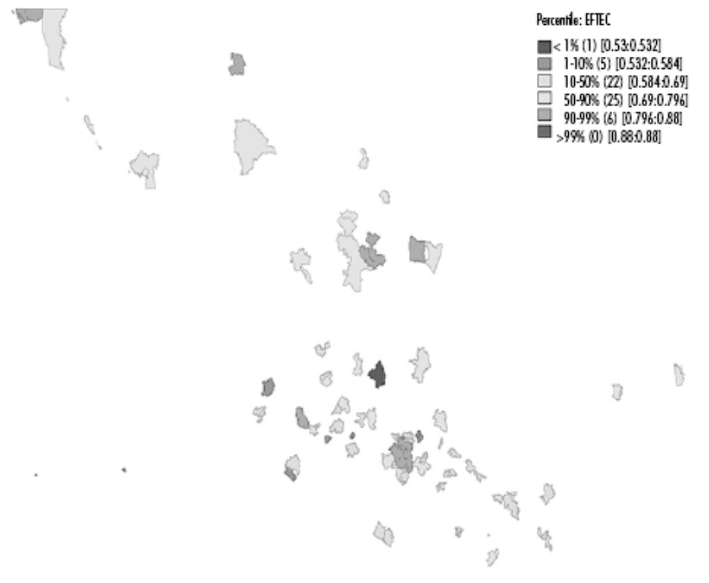
Source: Created by the authors.
Figure 1 Technical Efficiency by Percentile in the Metropolitan Zones, Average 2003-2013
They are followed in importance by a set of 25 cities located in the northern region, Bajío, and the Yucatan Peninsula. Gray tones reveal the cities with the lowest efficiency levels, where of the 28 cities in this category, most are in the southeast and in the Pacific region of the country, notably, Ríoverde, with the lowest observation in the entire sample of metropolitan zones.
The technical efficiency determined by the variables listed above in the creative sector displays a clear pattern of spatial dependence. Figure 2 shows the scatter plot of the Moran index, which resulted in a spatial dependency coefficient with a positive value of 0.32, which is evidence that there is a positive association across technical efficiency levels in the metropolitan zones.11 This situation is confirmed in the map in Figure 2 showing the values for the local Moran index, clearly revealing the formation of a cluster of cities with high levels of efficiency in the north of the country and in Cuernavaca, Morelos, another of the cities with low efficiency levels in the state of Michoacán, and a cluster of high-efficiency cities surrounded by low-efficiency cities in the Pacific zone, Guadalajara, and in Cuautla, Morelos.
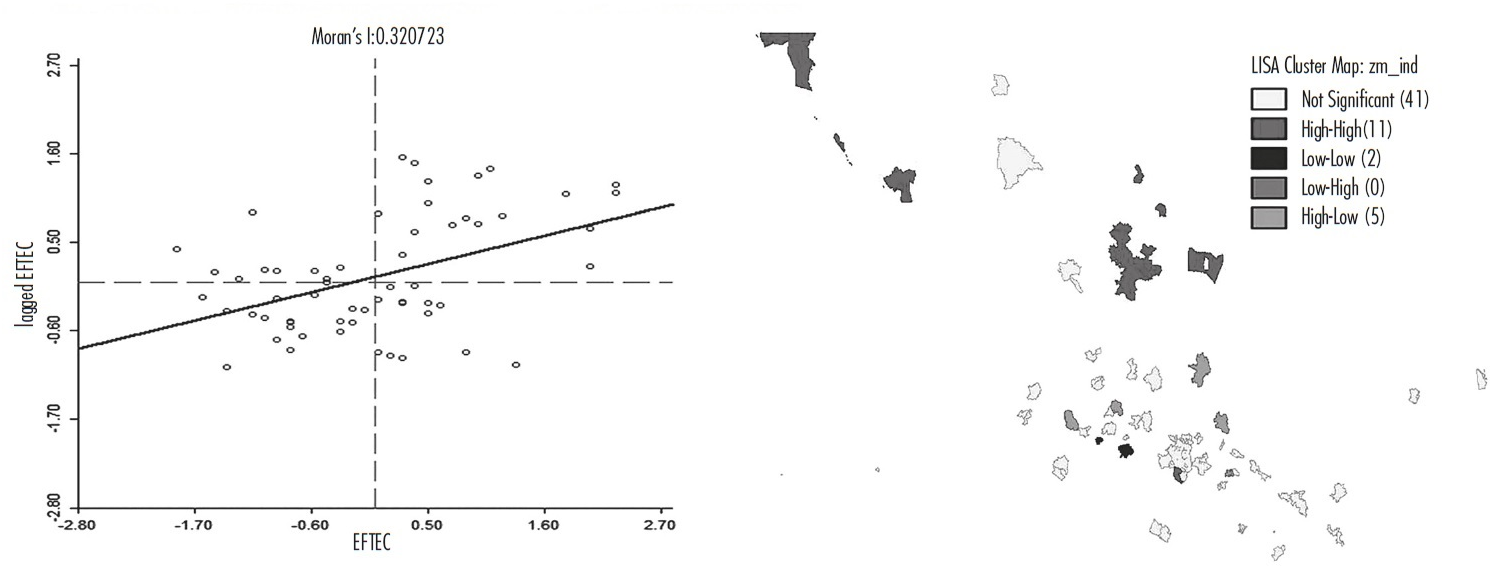
Source: Created by the authors.
Figure 2 Spatial Dependency on Efficiency Levels in the Metropolitan Zones 2003-2013
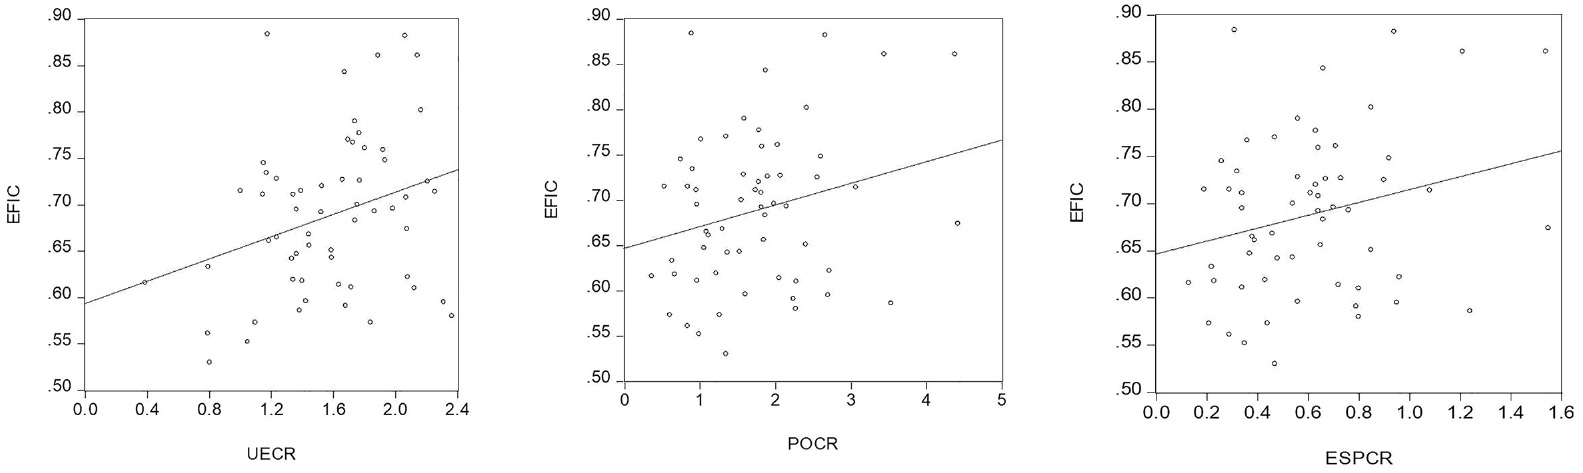
Finally, it also is clear that the efficiency levels are positively tied to the location of creative activities in Mexican metropolitan zones. Figure 3 shows a graphic panel in which technical efficiencies are positively tied with the weight of the creative economic units (UECR) in cities, with the weight of creative employment (POCR), and with regional specialization in creative activities (ESPCR).12
6. FINAL CONSIDERATIONS
Mexican metropolitan zones represent the primary spatial concentrations of economic and population activity in the country. According to the latest census data from 2010, they generate around 70% of the national GDP and are home to 57% of the population. As part of the stochastic frontier analysis, 59 delimited metropolitan zones in Mexico were sampled to determine their economic behavior measured in terms of technical efficiency levels. An initial approach to the problem explored four descriptive variables in the creative sector as drivers of inefficiency levels and estimated the effect or impact on the rise in the product.
Pursuant to the results of this work, in Mexico, the metropolitan zones generate a product with an average overall efficiency level of just 69.3%, equivalent to inefficiency of 31.7%. Nevertheless, there is considerable variation between the top performer (88.4%) in the border metropolitan zone of Reynosa-Río Bravo and the lowest performer (53%) in the Ríoverde-Ciudad Fernández zone, so the range is 21%. This is further evidence of how heterogeneity in regional development is expressed.
Strikingly, technical efficiency was higher in the northern border countries and in Valle de México in the central area of the country. By contrast, the lower values clustered in southeastern Mexico. The exploratory analysis revealed that the border-area metropolitan zones in the north of the country constitute a cluster of highly technically-efficient cities, which in turn neighbor cities that are also highly efficient. This points to the conjecture that in some way, the location of companies that are very oriented toward exporting in these zones since the early nineteen-nineties has fueled the rise in technical efficiency and, therefore, in productivity in this region of the country. Finally, although it is just a basic model with a very restricted scope, the outcome furnishes initial empirical evidence as to the need for deeper comparisons with various models, in an endeavor to find more robust results.
STATISTICAL ANNEX
Table A1 NAICS Classification of Creative Industries
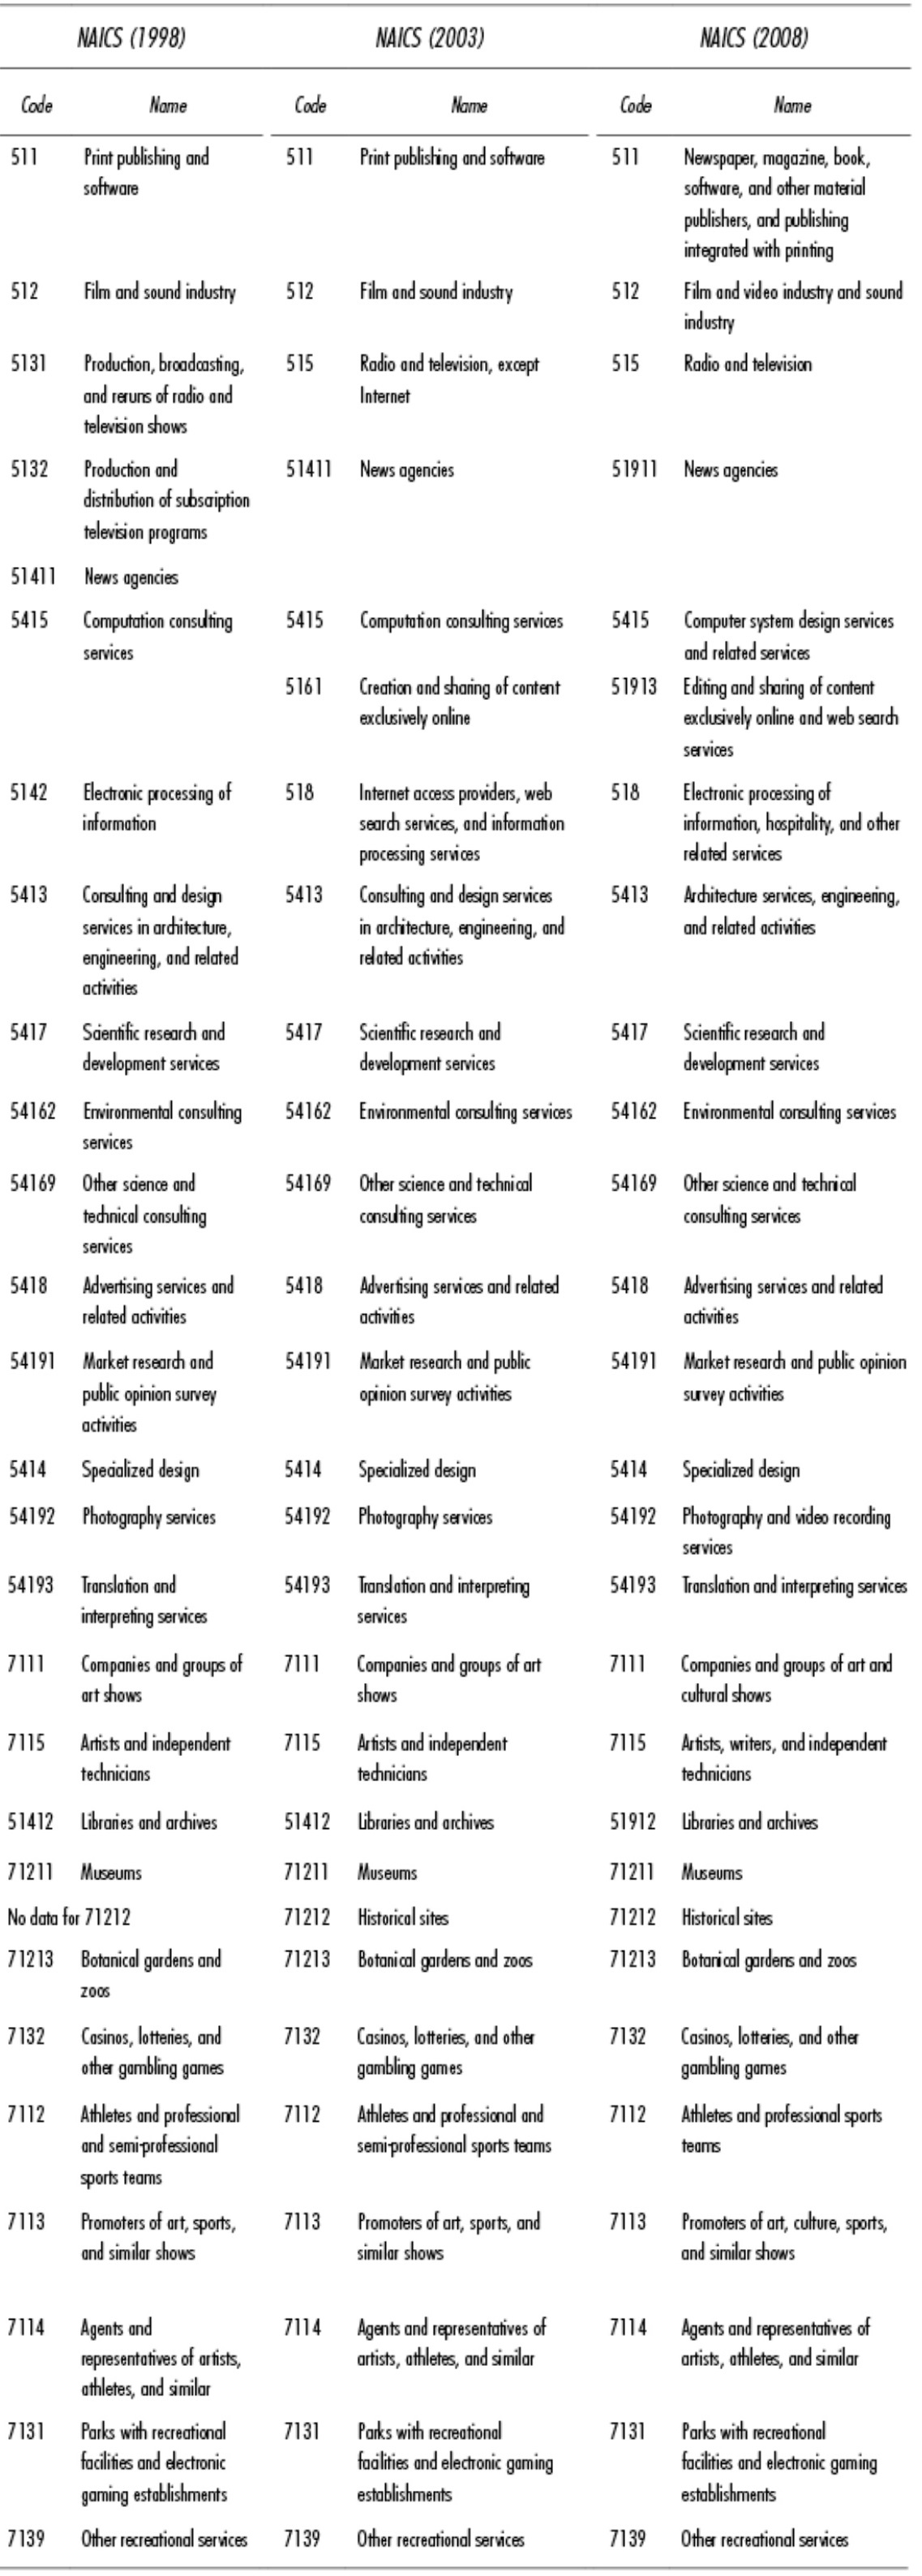
Source: Created by the authors based on UNCTAD (2015)
REFERENCES
Aigner, D., Lovell, C. A. K. y Schmidt, P. (1977), "Formulation and Estimation of 25 Stochastic Frontier Production Function Models", Journal of Economics, 6. [ Links ]
Barro, R. y Sala-i-Martin, X. (2003), "Economic Growth", The MIT Press Cambridge, Second Edition. [ Links ]
Battese, G. E. y Coelli, T. J. (1993), "A Stochastic Frontier Production Function Incorporating a Model for Technical Inefficiency Effects", Working Papers in Econometrics and Applied Statistics, núm 69, Department of Econometrics, University of New England. Disponible en <http://www. une.edu.au/_data/assets/pdf_file/0004/16087/emetwp69.pdf> [ Links ]
______ (1995), "A Model for Technical Inefficiency Effects in a Stochastic Frontier Production Function for Panel Data", Empirical Economics 20. [ Links ]
Belotti, F., Daidone, S., Ilardi, G. y Atella V. (2013), "Stochastic Frontier Analysis Using Stata", The Stata Journal 13, núm. 4. [ Links ]
Berger, T. (2011), "An Overview and Analysis on Indices of Regional Competitiveness", Review of Economics & Finance. [ Links ]
Boix, R. y Soler, V. (2014), "Creative Industries and the Productivity of the European Regions", International Conference on Regional Sciences, Universidad de Zaragoza. Disponible en: <https://www.uv.es/raboixdo/references/2014/14005.pdf> [ Links ]
Caudill, S.B., Ford, J.M. y Gropper, D.M. (1995), "Frontier Estimation and Firm-Specific Inefficiency Measures in the Presence of Heteroskedasticity", Journal of Business and Economic Statistics, 13. [ Links ]
Chapain, C., Cooke, P., Propis L. D. et al. (2010), "Creative Clusters and Innovation", NESTA Research report, London. [ Links ]
Cunningham, S. (2008), From "Creative Industries to Creative Economy", en G. Hearn y D. Rooney (eds.), Knowledge Policy: Challenges for the 21 st Century, Cheltenham, Edward Elgar. [ Links ]
Daraio, C. y Simar, L. (2007), "Advanced Robust and Nonparametric Methods in Efficiency Analysis: Methodology and Applications", Springer Science+Business Media, LLC. [ Links ]
DCA (1994), "Creative Nation: Commonwealth Cultural Policy, Department of Communications and the Arts" (DCA). Disponible en: <http://pandora.nla.gov.au/pan/21336/20031011-0000/www.nla.gov.au/creative.nation/contents.html> [ Links ]
DCMS (1998), "Creative Industries Mapping Document, Department for Culture, Media and Sport". Disponible en: < https://www.gov.uk/government/publications/creative-industries-mapping-documents-1998> [ Links ]
______ (2001), "Creative Industries Mapping Document, Department for Culture, Media and Sport". Disponible en: < https://www.gov.uk/government/publications/creative-industries-mapping-documents-2001> [ Links ]
______(2015), "Creative Industries Economic Estimates: January 2015", London Department for Culture Media and Sport. Disponible en: <https://www.gov.uk/government/statistics/creative-industries-economic-estimates-january-2015> [ Links ]
______(2016), "Creative Industry Statistics", Disponible en: < https://www.gov.uk/government/statistics/creative-industries-economic-estimates-january-2016 > [ Links ]
Del Gatto, M., Di Liberto, A. y Petraglia, C. (2011), "Measuring Productivity", Journal of Economic Surveys, vol. 25, núm. 5. [ Links ]
Florida, R. (2002), The Rise of the Creative Class, Basic Books, New York, USA. [ Links ]
______(2004), Cities and the Creative Class, Routledge, London. [ Links ]
______(2008), Who's your City? How the Creative Economy is Making Where You Live the Most Important Decision of your Life, Basic Books, New York, USA. [ Links ]
Fried, H., Knox Lovell, C. y Schmidt, S. (2008), "Efficiency and Productivity", Chapter 1, en H. Fried, C. Knox Lovell y S. Schmidt, The Measurement of Productive Efficiency and Productivity Growth, Oxford University Press. [ Links ]
Fujita, M. y Thisse J. F. (2002), Economics of Agglomeration: Cities, Industrial Location, and Regional Growth, Cambridge University Press, Cambridge. [ Links ]
Fujita, M., Krugman, P. y Venables, A. J. (1999), The Spatial Economy. Cities, Regions, and International Trade, MIT Press. [ Links ]
Ghosh, S. y Mastromarco, C. (2013), "Cross-border Economic Activities, Human Capital and Efficiency: A Stochastic Frontier Analysis for OECD Countries", The World Economy, DOI: 10.1111/twec.12010. [ Links ]
Glaeser, E. (2012), El triunfo de las ciudades, Taurus Ediciones, Madrid, España. [ Links ]
Greene, W. H. (2008), "The Econometric Approach to Efficiency Analysis", Cap. 2, en H. Fried, C. Knox Lovell y S. Schmidt, The Measurement of Productive Efficiency and Productivity Growth , Oxford University Press. [ Links ]
Grosskop, S. (1993), Efficiency and Productivity, The Measurement of Productive Efficiency : Techniques and Applications, edited by H. Fried, C. Knox Lovell y S. Schmidt, Oxford University Press. [ Links ]
Hadri, K. (1999), "Estimation of a Doubly Heteroscedastic Stochastic Frontier Cost Function", Journal of Business & Economic Statistics, vol. 17, núm. 3. [ Links ]
Hay, D. y Liu, G. (1997), "The Efficiency of Firms: what Difference does Competition Make?", The Economic Journal 107. [ Links ]
Higgs, P., Cunningham, S. y Bakhshi, H. (2008), "Beyond the Creative Industries: Mapping the Creative Economy in the United Kingdom", London Nesta. [ Links ]
Instituto Nacional de Estadística y Geografía (INEGI) (2013), Sistema de Cuentas Nacionales de México: Productividad Total de los Factores 1990-2011. [ Links ]
Jaaniste, L. (2009), "Placing the Creative Sector within Innovation: The full Gamut. Innovation", Journal Innovation Organization and Management, vol. 11, núm. 2. [ Links ]
Jondrow, J., Lovell, C. K., Materov, I. S. y Shmidt, P. (1982), "On the Estimation of Technical Inefficiency in the Stochastic Frontier Production Function Model", Journal of Econometrics, 19. [ Links ]
Kalb, A. (2010), "Public Sector Efficiency: Applications to Local Governments in German", Serie Gabler research, Gabler Verlag (ed.). Disponible en: <https://books.google.com.mx/books?id=7qseijgEoGEC> [ Links ]
Krugman, P. (1994), "Competitiveness: a Dangerous Obsession, Foreign Affairs", vol. 73, núm. 2, marzo-abril. [ Links ]
Kumbhakar, S.C., Denny, M. y Fuss, M. (2000), "Estimation and Decomposition of Productivity Change when Production is not Efficient: A Panel Data Approach", Econometric Reviews, vol. 19(4). [ Links ]
______y Knox Lovell, C. (2000), Stochastic Frontier Analysis, Cambridge University Press. [ Links ]
______, Wang, K. J. y Horncastle, A. (2015), A Practitioner's Guide to Sthochastic Frontier Analysis Using Stata, Cambridge, Cambridge University Press. [ Links ]
Landry, C. (2000), The Creative City: A Toolkit for Urban Innovators, Earths-can, London. [ Links ]
Landry, C. y Bianchini, F. (1995), The Creative City, Demos, London. [ Links ]
Lee, N. y Rodriguez-Pose, A. (2014), "Creativity, Cities, and Innovation", Environment and Planning A, 46(5). [ Links ]
Lobo, J., Bettencourt, L.M.A., Strumsky, D. y West, G.B. (2013), "Urban Scaling and the Production Function for Cities", PLoS ONE 8(3): e58407. DOI:10.1371/journal.pone.0058407. Disponible en: <http://journals.plos.org/plosone/article?id=10.1371/journal.pone.0058407> [ Links ]
Marshall, A. (2006), Principios de Economía, Editorial Síntesis, Madrid, España con base en la primera edición 1891. [ Links ]
Martin, R., Kitson, M. y Tyler, P. (2004), "Regional Competitiveness: An Elusive yet Key Concept?", Regional Studies, vol. 38:9, diciembre. [ Links ]
Meeusen, W. y van den Broeck, J. (1977), "Efficiency Estimation from Cobb-Douglas Production Functions with Composed Error", International Economic Review, 18. [ Links ]
Melo, S., Graham, D. J. y Noland, R. B. (2009), "A Meta-analysis of Estimates of Urban Agglomeration", Economies Regional Science and Urban Economics, vol. 39, núm. 3, pp. 332-342. [ Links ]
Mundula, L. y Auci, S. (2013), "Smart Cities and a Stochastic Frontier Analysis: A Comparison Among European Cities". MPRA Paper No. 51586, 1-40, posted 20. November 2013 15:57 UTC, disponible en <http://mpra.ub.uni-muenchen.de/51586/> [ Links ]
______, Auci, S. y Vignani, D. (2016), "Defining Smart Cities: a Relative and Dynamic Approach". Disponible en <http://www.corp.at/archive/CORP2016_10.pdf> [ Links ]
Nishimizu, M. y Page, JM. (1982), "Total Factor Productivity Growth, Technological Progress and Technical Efficiency Change: Dimensions of Productivity Change in Yugoslavia, 1965-78", Economic Journal, 92. [ Links ]
OECD (2001), Measuring Productivity, Measurement of Aggregate and Industry-level Productivity Growth (Manual). [ Links ]
Pratt, A. C. (1997), "The Cultural Industries Production System: a Case Study of Employment Change in Britain, 1984-91", Environment and Planning A 29. [ Links ]
Sedesol (2010), "Delimitación de las zonas metropolitanas". Disponible en <http://internet.contenidos.inegi.org.mx/contenidos/productos/prod_serv/contenidos/espanol/bvinegi/productos/geografia/publicaciones/delimex10/DZM20101.pdf> [ Links ]
Solow, R. M. (1957), "Technical Change and the Aggregate Production Function", Review of Economics and Statistics, 39. [ Links ]
UNCTAD (2008), "Creative Economy, United Nations" UNCTAD. Disponible en <http://unctad.org/es/docs/ditc20082cer_en.pdf> [ Links ]
______(2010), "Creative Economy Report 2010". Disponible en <http://unctad.org/es/Docs/ditctab20103_en.pdf > [ Links ]
______(2015), "Creative Economy Outlook and Country Profiles: Trends in International Trade in Creative Industries". Disponible en <http://unctad.org/en/PublicationsLibrary/webditcted2016d5_en.pdf> [ Links ]
Yencken, D. (1988), The Creative City [online]. Meanjin, vol. 47, núm. 4, Summer. Disponible en https://search.informit.com.au/documentSummar y;dn=582212487737872;res=IELLCC [ Links ]
2Works have abounded in the Solow vein under the term growth accounting, which is the methodology the OECD (2001) and INEGI (2013) use. In their framework, productivity is determined by total factor productivity (TFP) and is measured as a residual term not explained by the growth of production factors (inputs). The term is moreover associated with technical progress (incorporated and otherwise).
3In general, we’re talking about the ith unit under observation, which may be: individual, company, economic activity sector, country, region, state, municipality, city, or metropolitan zone.
4The vectors may include: i) the first element equal to one, ii) include some input variable required for the production function, and/or iii) interactions between variables specific to the metropolitan zone and input variables; whatever the case may be (See Battese and Coelli, 1993, p. 5).
5Because γ provides asymptotically efficient estimates, it is necessary to have a significance test for this parameter; a significance test of the specification of the stochastic frontier where accepting the null hypothesis that the true value of the parameter is equal to zero implies that the non-random component of the residual of the production function () is zero.
6In Mexico, the metropolitan zones are delimited by the Secretariat of Social Development (Sedesol). At present, there are 59, defined as “…a set of two or more municipalities where a city of 50,000 inhabitants or more is located, whose urban area, functions, and activities exceed the borders of the municipality originally containing them, incorporating as part of itself or as its area of direct influence its neighboring municipalities, predominantly urban, thereby maintaining a high degree of socioeconomic integration. It also includes any municipalities which, due to their unique characteristics, are relevant to urban planning and policy in the metropolitan zones in question. Additionally, metropolitan zones are defined as any municipality containing a city of one million or more inhabitants, or those cities with 250,000 or more inhabitants sharing conurbation processes with cities in the United States" (Sedesol, 2010).
7In an attempt to eliminate or ameliorate the potential problems pertaining to heteroscedasticity, multicollinearity, and product measurements (Hay and Liu, 1997).
8When the information is not a limiting factor, in general, this type of stochastic frontier model linked to an inefficiency model is structured with a set of different types of variables: variables pertaining to the productive structure (conventional inputs and outputs for the production function), variables driving the level of technical inefficiency, institutional and location variables, and, when the panel is long, the variables of control due to effects from the economic cycle or other sorts of external shocks.
9The calculations were performed in STATA with the Belotti et al. (2013) software.
10Bear in mind that, for example, the fixed effects model requires estimating as many α_i parameters as cross-section units present in the data (i=1,…, N) and they go up with the size of N, which emerges as the problem of incidental parameters and in this situation, consistency cannot be guaranteed and the estimate is biased, so long panel databases are needed, T>10 (Parmeter and Kumbhakar, 2014; Belotti et al., 2013; Greene, 2005). We believe that this is the case here, our data panel is short: N (=59) is relatively big with respect to the periods T(=3). Nevertheless, the standard random and fixed effects models were run, but with the latter, no solution was reached.
11The Moran index was calculated using the GeoDa program and a matrix of spatial weights considering the four closest neighbors. For details about how it is calculated, see Yencken and Mendoza (2009).
Received: November 07, 2017; Accepted: February 06, 2018
 Este es un artículo publicado en acceso abierto bajo una licencia Creative Commons
