


Servicios Personalizados
Revista
Articulo
 texto en
  Inglés (pdf)
 Artículo en XML
 Referencias del artículo
 Enviar artículo por email
Indicadores
-
 Citado por SciELO
 -
 Accesos
Links relacionados
-
 Similares en
SciELO
Similares en
SciELO
Compartir

 Permalink
Problemas del desarrollo
versión impresa ISSN 0301-7036
Prob. Des vol.49 no.192 Ciudad de México ene./mar. 2018
Articles
The Physical Oil and Oil Futures Markets: Transmission of the Mean and Volatility
1Autonomous University of the State of Mexico. E-mail address: rjg2005mx@yahoo.com.mx
This paper sets out to use the bivariate VEC-EGARCH model with constant correlations to analyze the process by which the mean and volatility are transmitted between the crude futures markets and physical oil markets in Mexico. The results point to the existence of bilateral performance information transmission patterns with stronger effects from the futures markets to the physical markets, while the evidence for the effects of bilateral volatility transmission only exists between the oil futures and physical oil markets in Olmeca. The empirical findings are relevant to governmental authorities and consumers because they aid in designing cross-hedging strategies that mitigate exposure to the price risk in Mexican oil.
Keywords: Mexico; oil; futures markets; physical market; volatility; bivariate VEC-EGARCH model
Este trabajo propone el modelo VEC-EGARCH bivariado con correlaciones constantes para analizar el proceso de transmisión de la media y volatilidad entre mercados de futuros de crudo y mercados físicos del petróleo mexicano. Los resultados revelan la existencia de patrones de transmisión de información de rendimientos bilaterales con efectos más fuertes de los mercados de futuros hacia los mercados físicos. En tanto que la evidencia de efectos de transmisión de volatilidad bilateral, sólo existe entre los mercados de futuros y el mercado físico del petróleo Olmeca. Los hallazgos empíricos son relevantes para las autoridades gubernamentales y consumidores porque coadyuvan en el diseño de estrategias de cobertura cruzada, que mitigan la exposición al riesgo de precios en el petróleo mexicano.
Palabras clave: México; petróleo; mercados de futuros; mercados físicos; volatilidad; modelo VEC-EGARCH bivariado
Clasificación JEL: C32; G14; Q11; Q41
Ce travail présente le modèle bivarié VEC-EGARCH avec des corrélations constantes afin d’analyser le processus de transmission de la moyenne et de la volatilité entre les marchés à terme de l’hydrocarbure et les marchés au comptant du pétrole mexicain. Les résultats montrent l’existence de schémas de transmission de l’information sur les rendements bilatéraux et les effets des marchés à terme sur les marchés au comptant du pétrole, alors que la transmission bilatérale de la volatilité ne se présente que dans les marchés du pétrole « olmeca ». On souligne l’importance des constatations empiriques pour les autorités gouvernementales comme pour les consommateurs parce qu’elles contribuent à la conception de stratégies de couverture croisée qui atténuent le risque lié aux prix du pétrole mexicain.
Mots clés: Mexique; pétrole; marché à terme; marché au comptant; volatilité; modèle bivarié VEC-EGARCH
Este artigo propõe o modelo VEC-EGARCH bivariado com correlações constantes para analisar o processo de transmissão da média e volatilidade entre os mercados de futuros de petróleo e os mercados físicos do petróleo mexicano. Os resultados revelam a existência de padrões de transmissão de informação de rendimentos bilaterais com efeitos mais fortes dos mercados de futuros em relação aos mercados físicos. Embora haja evidência dos efeitos da transmissão da volatilidade bilateral, ela só existe entre os mercados de futuros e o mercado de petróleo físico Olmeca. Os resultados empíricos são relevantes para as autoridades governamentais e os consumidores porque contribuem no desenho de estratégias de cobertura cruzada, que atenuam a exposição ao risco de preços no petróleo mexicano.
Palavras-chave: México; petróleo; mercados de futuros; mercados físicos; volatilidade; modelo VEC-EGARCH bivariado
本文提出具有常熟相关性的二元VEC-EGARCH模型,分析墨西哥石油期货市场与实体市场之间均值和波动的传导过程。结果表明,二者之间存在着收益信息的互递模式,其中期货市场对实体市场的影响较强。此外,双边波动传导效应只存在于期货市场和奥尔梅卡实体市场之间。上述实证结果对政府当局和消费者有着重大的意义,因为这一发现有助于制定交叉覆盖策略以减少墨西哥石油价格波动的风险。.
关键词: 墨西哥; 石油; 期货市场; 实体市场; 波动; 二元VEC-EGARCH模型
1. INTRODUCTION
In recent decades, oil has served as the main source of energy fueling global economic growth, regional trade cycles, and the advent of modern society; its daily use plays an essential role in the industrial production, distribution, and creation of electrical power and refined products. As a result, the international physical oil market has undergone rapid growth in liquidity, to such a degree that it has become a full-fledged, sophisticated financial market.
Nevertheless, as globalization has taken off and the fossil fuel energy markets have evolved toward integration, their non-linear and complex structure has proved to be extremely volatile,2 thanks to the simultaneous and irregular roller coaster of oil prices. The severe oil price swings and high volatility have only been exacerbated over time in response to large-magnitude information shocks derived from the expansion of futures transactions and the marked degree of integration emerging across global oil markets.
This trait has been amply documented in the literature. It has been noted more in the raw materials energy markets than in the agricultural and mining markets, as well as in some foreign exchange and stock markets (Kroner et al., 1995; Plourde and Watkins, 1998; Reigner, 2007; Cheng and Hung, 2011). Another important factor that has transformed the fossil fuels markets into complex and volatile negotiating platforms is the rapid securitization or trading of oil through futures markets, ever since institutional investors and speculators began to show interest in oil as an investment alternative to diversify their portfolios3 and hedge against exposure to risk (German and Kharoubi, 2008; Brooks and Prokopczuk, 2013).
The futures markets were created principally to provide protection against unexpected changes in the prices of the underlying assets or curb exposure to risk for investors and shareholders. Another important aspect is the role information on futures pricing plays in shaping prices. This process consists of the capacity of the futures market to rapidly assimilate information flows, which will be immediately reflected in the price of the underlying asset for its forecast. Likewise, the function of price formation maintains a long-term equilibrium between current and future prices in a market, and if there are temporary deviations in the balance of the futures prices in one or both markets, they will have to adjust through the error correction mechanism.
Oil futures are generally negotiated in international markets, like the New York stock exchange (NYMEX) or the London stock exchange4 (IPE). These brokerage platforms play a key role in setting the WTI and Brent oil prices, as well as in market frictions, in terms of transaction costs, regulation, and liquidity. This means that the price formation process in the physical oil market will be affected not only by its owner information, but also by information generated in the international oil futures markets. Studies on the effects of information transmission have documented that the dynamics of volatility depend on the arrival of new information to the market. In this regard, information in the futures market can fuel the volatility of the physical oil market (Zhong et al., 2004; Liu, et al., 2008; Han et al., 2013).
On another note, volatility transmission patterns occur in the moment that a futures market is experiencing changes in volatility, and this delayed impact therefore produces volatility in another market, leading to unexpected shocks that destabilize oil prices. As the physical markets for oil with differing degrees of quality and density have become highly integrated, interest in understanding and analyzing the magnitude of the effects of information transmission on yields and volatility over time and the in the markets has grown in the economic and financial literature. At present, studying the mechanisms by which volatility spreads across markets brings with it serious consequences for the producers, consumers, and designers of energy policy and investors, as it lays the groundwork for developing the models to value assets and byproducts, predict futures prices, and design hedging strategies.
The objective of this paper is to identify the patterns through which information flows across the physical and oil futures market using the transmission of the mean and volatility. This study sets out to answer the following questions. Can the mean and volatility transmission mechanism help us better understand how the physical and futures markets exchange information flows? Could the volatility of a highly liquid international market drive the volatility of a less liquid market?
The study also contributes the literature as follows: studies on information on the mean and volatility spreading across internationally-referenced oil markets and the physical market for low-quality oil is still quite scant, so daily data was taken on the Maya, Istmo, and Olmeca oil prices, as well as futures prices for WTI and Brent oil during the time period January 3, 2000 to December 31, 2015. The study also posits a bivariate VEC-EGARCH model, because the one of the advantages of this model is that it is a new way of analyzing how information shocks spread5 through first and second conditional moments. Likewise, the study captures the asymmetrical effects of volatility, generally left out of GARCH-BEKK models.
Similarly, the empirical results reveal the existence of bilateral mean information transmission effects across the physical and futures oil markets, as well as evidence for the effects of bilateral volatility transmission across futures markets and the Olmeca physical oil market, although the effect running from WTI to Olmeca and from Olmeca to Brent is even greater. In this sense, the oil futures markets do have destabilizing effects on the physical Mexican oil markets, which governmental authorities and consumers could harness to create optimal cross-hedging strategies to help reduce exposure to the Mexican oil price risk.
The rest of this paper is structured as follows. Section 2 discusses salient literature. Section 3 explains the methodology used in this paper. Section 4 describes and analyzes the data. Section 5 introduces the empirical evidence, and, finally, there is a conclusions section.
2. LITERATURE REVIEW
Up until now, most of the literature studying volatility transmission patterns has been restricted to the foreign exchange and stock markets. Nevertheless, as globalization has taken off and the physical oil markets have evolved to become more integrated, scholars, institutional investors, and energy policymakers have shown renewed interest in understanding the effects of information transmission on performance and volatility in the markets.
With that in mind, Lin and Tamvakis (2001) estimated ARCH and GARCH models using standard WTI and Brent oil futures contracts with the closest maturity. Their findings point to conclusive evidence for the effects of information transmission when the markets operate simultaneously. Oil prices in the London market are affected by the closing prices in the New York market.
Ewing et al. (2002) analyzed volatility transmission patterns between the oil and natural gas markets from April 1, 1996 to October 29, 1999 using a BEKK parameterization for the multivariate GARCH (1,1) model. The results demonstrate vestiges of volatility directly and indirectly transmitted from one market to another. In a study of five national and international energy markets in the United States of America, Hammoudeh et al. (2003) found evidence that volatility transmission tends to be more frequent and significant between the physical and futures markets using contracts with maturities of one to three months and the GARCH model, unlike the VEC mean transmission model.
Using high-frequency data, Lin and Tamvakis (2004) reinforced their previous findings, confirming that the New York stock exchange is the primary setter of prices in the light and sweet oil futures market, and its dominant effect has repercussions for contracts negotiated on the London exchange.
Using a structural GARCH-BEKK model, Spargoli and Zagaglia (2007) analyzed the correlations between the light and sweet oil futures markets in the time period April 26, 1993 to April 26, 2007. The results of the study underscore how the New York exchange reacts rapidly to the arrival of new information as compared to the Europe Intercontinental (ICE) exchange.
Similarly, Chang et al. (2009) studied the relations between volatility and conditional correlation between the performance of current, forward, and future prices for the principal oil setters (WTI, Brent, and Dubai). The findings point to volatility transmission and asymmetry effects on the conditional volatility for each of the markets analyzed.
In a study including Malaysian Tapis oil, Chang et al. (2010) found evidence for the transmission of volatility from the Brent futures market to the physical and forward markets, from the Brent physical market to the WTI physical market, and from the WTI futures market to the Brent physical market. Moreover, the presence of volatility transmission effects from the WTI and Brent oil markets to the physical, forward, and futures markets for Dubai and Tapis oils. This finding reaffirms that the light and sweet oil markets are the principal international markets for setting the price of low-quality crude.
Kang et al. (2011) analyzed the effects of structure changes on volatility, incorporating them into a GARCH-BEKK structure in order to better understand how volatility spreads and information is exchanged across the WTI and Brent physical markets. The results reveal that the relaxing of structural changes can alter the direction of information flow and the volatility transmission mechanism across the internationally-benchmarked oil markets.
Using a VAR-GARCH-BEKK model estimate, Jin et al. (2012) found empirical evidence for how volatility is transmitted through the principal WTI, Brent, and Dubai oil futures markets from July 2005 to February 2011. Moreover, the findings point to important information transmission patterns, where Brent is the most sensitive to market shocks due to its important position as a measuring stick for setting oil prices.
In a recent study, Sehgal et al. (2013) analyzed the effects of volatility transmission between physical and futures prices and across WTI futures prices negotiated on the NYMEX, ICE, and MCX platforms.6 Their results confirm the presence of volatility transmission in the long term from ICE to MCX and from MCX to NYMEX. But the effect seems to be stronger from NYMEX to ICE and MCX, which confirms its dominant standing in the oil market. Both ICE and MCX are equally competitive in the global WTI market.
Finally, Soucek and Todorova (2014) posited a multivariate heterogeneous autoregressive model to analyze volatility transmission patterns in the energy futures markets (ICE). The results point to short-term shocks in the volatility of the Brent futures, with a significant impact on diesel futures. Moreover, the principal source of oil and diesel volatility transmission toward natural gas is the long-term volatility component.
3. ECONOMETRIC METHODOLOGY
This section proceeds to describe the bivariate VEC-EGARCH model that explains the mean and volatility transmission effect.
3.1 Bivariate EGARCH Model with Error Correction Term
Pursuant to the literature, the presence of asymmetrical effects in volatility has been amply confirmed in the stock markets of industrialized and emerging countries. However, the evidence for the oil markets needs to be verified. For that reason, this study extends the Nelson (1991) EGARCH model to a multivariate structure to analyze the nature of mean and volatility transmission mechanisms between oil markets.
To analyze the price information transmission patterns and the performance of the physical and futures oil markets, the model considered whether they are affected by their own terms and the terms of other performances, with delay, as well as an error correction term.
The conditional mean equations are specified using error correction vector models as follows:
where RS,t and RF,t are the yields of the physical oil and oil futures markets, meaning S= Maya, Istmo, Olmeca and F= WTI, Brent PS,t and PF,t are the logarithmic prices of S and F on date t, respectively. Moreover,  and
and  are the coefficients of the own effects of the delayed yields.
  and
and  measure the indirect effects of the mean on physical and futures yields.
  and
and  are the coefficients measuring the speed of price adjustment across the physical oil and oil futures market or the speed at which the difference in the long-term balance is corrected. Ψ
t-1
is the set of information available at time t-1 ε
t
= (ε
S,t
, ε
F,t
) are the residuals of the conditional means, such that ε
t
׀ Ψ
t-1
~N(0,H
t
) H
t
{h
s,t
, h
F,t
, h
SF,t
} is defined as the conditional variance-covariance matrix.
are the coefficients measuring the speed of price adjustment across the physical oil and oil futures market or the speed at which the difference in the long-term balance is corrected. Ψ
t-1
is the set of information available at time t-1 ε
t
= (ε
S,t
, ε
F,t
) are the residuals of the conditional means, such that ε
t
׀ Ψ
t-1
~N(0,H
t
) H
t
{h
s,t
, h
F,t
, h
SF,t
} is defined as the conditional variance-covariance matrix.
Given that volatility is important to better understanding the information transmission process between the physical oil and oil futures markets when there are asymmetry effects, the conditional variance equations are defined as follows:
where j = S,F and ξ j,t-1 = ε j,t-1 = ε j,t-1 ׀h j,t-1 are standardized residuals. Moreover, ϕ S1 y ϕ F1 measure the short-term persistence or own direct effects of shock transmission. The parameters ϕ S3 and ϕ F3 measure the short-term cross-market volatility transmission effects on the yields of physical oil and oil futures prices, respectively. As such, the conditional volatility will not only be affected by shocks in the past residuals of the own market, but also by shocks from other markets. ϕ S2 ϕ F2 and quantify the degree of long-term persistence in the volatility. A value close to one indicates that high volatility is followed by even stronger volatility in the same direction.
For their part, ϕ S4 and ϕ F4 measure the long-term cross-market volatility transmission effects on each of the physical and futures markets. The parameters β S0 and β F0 represent the effects of temporary deviations from the equilibrium, which affect the conditional variance because an increase in the differential between the two variables generates uncertainty and drives up volatility (Lee, 1994).
The presence of the asymmetry effect in conditional volatility is determined by equation (5) when the parameter δ j is significantly different from 0. If the partial derivatives of the function g(ξ j,t ) are taken with respect to ξ j,t , the following results:
The terms  and δ
j
ξ
j,t
measure the size and sign effects, respectively. If δ
j
< 0, negative innovation7 strengthens the size effect, but the size effect is neutralized when δ
j
< 0. This means that negative innovations increase the volatility more than positive innovations of the same magnitude. Likewise, the evaluation of the importance of asymmetry or leveraging factors is measured by
and δ
j
ξ
j,t
measure the size and sign effects, respectively. If δ
j
< 0, negative innovation7 strengthens the size effect, but the size effect is neutralized when δ
j
< 0. This means that negative innovations increase the volatility more than positive innovations of the same magnitude. Likewise, the evaluation of the importance of asymmetry or leveraging factors is measured by  .
.
The covariances are determined as follows:
where ρ is the constant conditional correlation.
Finally, the quasi-maximum likelihood method is used to estimate the parameters of the logarithmic likelihood function:
where θ is the vector of model parameters and T indicates the number of observations.
4. DATA AND PRELIMINARY ANALYSIS FOR EACH OIL MARKET
The information used for this study consisted of the series of daily physical prices from the basket of Mexican crudes: Maya, Istmo, and Olmeca.8 The daily closing prices for oil futures of international reference (WTI and Brent) trading on the New York and London stock exchanges were used, despite the fact that the delivery dates for the futures contracts are set in monthly cycles; this does not mean they are continuous. As such, in constructing the series of futures prices, the customary rule in the literature consisting of using the futures contract with the closest maturity was used. Likewise, the avoid the effects of volatile prices derived from the expiration of the contract and lack of liquidity in the market,9 the transition process to the second futures contract with the closest upcoming maturity takes place one week before the last day of operation for the current future contract.
The sample for the analysis is drawn from the time period January 3, 2000 to December 31, 2015, totaling 4,114 observations. To standardize the series of physical and futures prices, the Lagrange interpolation method was used, estimating the data unavailable due to holidays or non-business days in a given market. It is important to bear in mind that all of the financial series were obtained from the Bloomberg database.
For purposes of this analysis, both price series were transformed into continuous yield series as follows: Rt= In(Pt)-In(Pt-1). Table 1 summarizes the basic statistics on yields and outcomes of the unit root, autocorrelation, and cointegration tests. As shown in Panel A, all of the mean values are positive, but small, with respect to the standard deviations, which amounted to between 2.19% and 2.49%. This indicates a positive yield-risk relationship and greater exposure to risk for the participants in the oil market, in particular for the Istmo and Maya crudes. Likewise, all of the yield series showed negative skewness and excess kurtosis, which prompts a rejection of the assumption of normality due to the presence of outlier observations and the high value of the Jarque-Bera statistic.
Table 1 Basic Statics and Unit Root and Cointegration Test

Note: Jarque-Bera is the test of the null hypothesis of normality in the yield distribution; Q(20) and indicate the Ljung-Box test statics for simple and squared yields with 20 lags; the term * indicates rejection of the null hypothesis at a significance level of 1%. Values in parentheses are the standard error of the parameters estimated from the cointegration test.
Source: Created by the author with information from the Bloomber database.
The results of the Ljung-Box test, Q(20) confirmed the strong presence of serial correlation in each of the series of oil yields. This finding suggests that the conditional mean equation is the better specification to capture the phenomenon. With respect to the behavior of volatility, the results of the Q2(20) statistic provide convincing evidence of conditional heteroscedasticity in the squared yields of the five oil markets and the need to estimate a GARCH model for its appropriate modeling.
The conditions of stationarity in the pricing and yield series were validated using Dickey-Fuller and Phillips-Peron unit root tests, whose results are reported in Panel B of Table 1. The negative values close to zero and non-significant of the statistics are too weak to reject the null hypothesis at 1%, indicating that all of the series of the logarithmic prices have a unit root or are integrated on order one I(1). This finding could confirm the existence of a linear stationary relationship between the two non-stationary series, meaning, between physical and futures prices. In the case of first differences, large negative values reject the null hypothesis of the unit root, confirming that the series of yields behave like a stationary process.
To investigate the existence of the cointegration relationship, the two-step Engle-Granger methodology was used.10 Panel C shows the results of the long-term equilibrium relationship between the logs of physical and oil futures prices. The parameters estimated from the cointegration test are statistically significant and are above 1 for λ1 with small standard errors. Moreover, the cointegration for each pair of logarithmic price series is confirmed by the statistical value of the Dickey-Fuller and Phillips-Perron tests at a significance level of 1%, indicating that the series of residuals are stationary or zero-order integrated, I(0). These findings are important to the study because they demonstrate close informational ties between physical and future oil prices through different negotiating platforms. In this way, it is important to incorporate the error correction term into the equations for means and conditional variances in the bivariate EGARCH model.
5. EMPIRICAL EVIDENCE
5.1 Transmission of Information Through Yields and Volatility
Using the physical prices yields series and the future prices yields series, this study estimated 12 bivariate VEC-EGARCH specifications to analyze the information on the mean and volatility transmission mechanisms across the Mexican physical oil and oil futures markets.
In Table 2, pursuant to the specification of the conditional mean, the statistical significance of the estimated parameters  reveals that the current yields on Maya, Istmo, and Olmeca oil are directly affected by their own performance delayed on period. The number of lags in the mean equation was chosen pursuant to the Akaike information criterion.
Table 2 Parameters Estimated from the Bivariate VEC-EGARCH Model

Note: Q(18) and Q2(18) indicate the Ljung-Box test statistics for simple and squared residuals with 18 lags and p-values in parentheses. The terms *,**, and *** indicate significance at levels 1,5 and 10%, respectively. Standard errors reported in parentheses.
Source: Created by the author with information from the Bloomber database.
In terms of the transmission of information on the indirect effects of the mean, the Mexican oil yields were positively affected by the futures yields of the WTI and Brent, except where the WTI → Olmeca relationship was concerned. The strongest market reaction to a change in futures prices was found in the WTI→Istmo, WTI→Maya, and Brent→Istmo relationships with values of 0.7824, 0.7605, and 0.5258, respectively. The weakest factor was in the WTI→Olmeca relationship with a value of -0.1847. The results indicate that the information generated in the WTI and Brent futures markets is rapidly transmitted to the Mexican oil markets. This is fueled by the major role the futures markets play in assimilating market expectations and reflecting them efficiently in the formation and prediction of futures prices. Moreover, the inefficiency and lack of liquidity in the Mexican oil market obliges it to act as a taker of prices rather than a setter, prompting rising dependency on the international markets to set the prices from abroad, despite being an oil producing country with high production capacity.
The estimated  coefficients in the VEC model determine the speed of price adjustment to reach the long-term equilibrium relationship between the physical oil and oil futures markets. The lack of significance in the results reveals the absence of adjustment between the Maya and Istmo prices and the deviations from the long-term equilibrium relationship, except for the Brent→Olmeca (1.0214) and WTI→Olmeca (1.0159) relationships at a level of 1% and 5%, respectively. The reason for this finding rests on the similar physical and chemical traits of the Olmeca crude and the international reference oils, because Olmeca prices are adjusted and react to imbalances in the physical and futures prices when the price system exhibits narrow differentials. On another note, the Istmo and Maya oil prices generally do not react to the presence of temporary deviations in the long-term equilibrium relationship in the period prior when the coefficients of the error correction term are negative or close to zero, because physical prices require a significant increase to maintain market equilibrium.
For the case of the conditional variance equation estimates reported in Panel B, the significance of the estimated parameters  reveal the existence of ARCH effects in the Mexican oil markets. This result means that past innovations have a positive and significant effect on current volatility of Mexican oil prices. For the cross-effects of short-term volatility transmission, the significance of the
  parameters only indicates volatility propagation effects in the WTI→Maya, WTI→Olmeca, and Brent→Olmeca relationships at 1 and 5%, with strong positive impacts running from WTI and Brent to Olmeca. This result shows that the Maya and Olmeca oil markets are evidently vulnerable, not only due to news in the own market, but also due to unexpected shocks in the international oil futures markets. This finding can be attributed to the mechanism adopted by the governmental authorities to set regulated Mexican oil prices, because Mexico as a producer of oil is a taker of prices by nature rather than the position of setter.
With respect to the direct long-term effects, all of the estimated  coefficients are statistically significant at 1%, showing strong evidence for persistence in the volatility. The past volatility of the physical oil markets has a significant effect on the current volatility and requires a lot of time to decay. This fact is reflected most in the Brent→Maya (0.9973) and WTI→Maya (0.9942) relationships, and can be attributed to the different physical and chemical properties between Maya (22 API degrees and 3.3% sulfur) and the WTI (40 API degrees and 0.2% sulfur) and Brent (38 API degrees and 0.4% sulfur). So the highest prices are found in the international markets and the price differentials are widest there, too.
Looking at the long-term cross-market effects, the significance of the estimated  coefficients at conventional levels reveals the existence of volatility transmission from the WTI and Brent futures markets to the Maya and Olmeca physical markets. In absolute terms, the strongest effects run from WTI and Brent to Olmeca, followed by the Brent→Maya relationship. This finding reveals the presence of high volatility in combination with the short- and long-term cross-market effects, prompting burgeoning uncertainty in current physical oil prices, especially for Olmeca crude, despite the fact that the sign of the coefficient is negative. This is because the value of the coefficient of the short-term cross-market effects is relatively larger than that of the coefficient of the long-term cross-market effects in the respective oil markets, meaning that the indirect ARCH effects are more important for predicting the future volatility of physical prices than the indirect GARCH effects.
Likewise, the direct asymmetry effect and that of the futures markets toward the physical oil markets, measured by the parameters δ
S
and  is significantly different than zero. This finding means that negative news will have a greater impact on volatility than good news. The asymmetry effect of bad news from the WTI futures market is 1.86, 3.77, and 3.11 times stronger than the impact of good news on the Maya, Istmo, and Olmeca oil markets, respectively. The effects of leveraging from the Brent futures market on the physical oil markets amounts to values of 1.67, 1.87, and 1.62 in the same order. This finding explains why energy policy designers in Mexico are concerned when the positive price trend does a drastic about-face in the short term.
Pursuant to the magnitude and statistical significance of the  parameters, which measure the effects of short-term deviations in the equilibrium on the conditional variance of the physical oil markets, the error correction term only has a significant negative effect for the WTI→Olmeca relationship at a level of 10%. The negative value of the coefficient indicates that as the deviations between physical and futures prices climb to high values, volatility in the Olmeca oil market will decline at a slow pace and price behavior will be slightly less volatile over time.
Looking at the results estimated for the futures markets reported in Table 3, it appears that just as in the case of the physical markets, the current yields on WTI and Brent oil are affected by their own yields delayed by one period. In the case of the mean information transmission mechanism, the majority of the  coefficients are positive and significant at 1%, indicating the existence of bilateral effects between the physical oil and oil futures markets. Comparing their coefficients, it emerges that
  . For example, the coefficient of the WTI→Istmo reltionship is 0.7824 compared to 0.4346 for the Istmo→WTI relationship. This is evidence of stronger and faster effects flowing from the futures markets to the Istmo and Maya physical markets, so they provide more information, which is transmitted from one market to the other. By contrast, changes in the Olmeca oil market have a stronger effect on the futures market pursuant to the size of their estimated coefficient, meaning more information for setting futures prices in the respective markets.
Table 3 Parameters Estimated from the Bivariate VEC-EGARCH Model
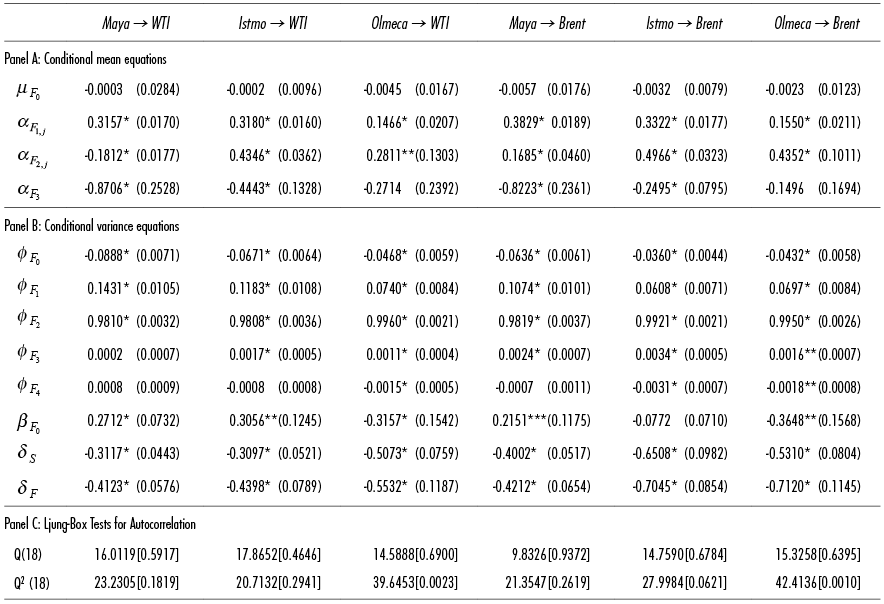
Note: Q(18) and Q2(18) indicate the Ljung-Box test statistics for simple and squared residuals with 18 lags and p-values in parentheses. The terms *,**, and *** indicate significance at levels 1,5 and 10%, respectively. Standard errors reported in parentheses.
Source: Created by the author with information from the Bloomber database.
There are two external factors that could explain these results. The first is that Mexico was ranked twelfth in oil production worldwide in 2015, with a volume of approximately 2.3 billion barrels a day pursuant to the global ranking published by the Organization of Petroleum Exporting Countries (OPEC). The second justification is that Mexican oil exports rose to 427.9 million barrels with a customs value of 18.524 billion dollars approximately, placing Mexico in fourth place as a net supplier of crude to the United States measured in volume, after Canada, Saudi Arabia, and Venezuela. These figures are relevant to domestic economic growth because Mexico exercises some degree of control over international oil prices, at least in the short term, and, at the same time, has the ability to directly and significantly influence lower-quality oil prices.
The coefficient  of the error correction term is negative and statistically significant at 1% for all futures yields with the exception of the Olmeca→WTI and Olmeca→Brent relationships. The reason for these results is attributed to the far-reaching difference in the physical and chemical characteristics of Maya and Istmo and international reference crudes. In this context, the WTI and Brent oil futures prices are adjusted and react to imbalances between physical and futures prices when the price system displays a big gap, because the futures prices are overvalued and require a significant increase to keep the long-term equilibrium.
Likewise, the findings do not support the hypothesis that the physical oil and oil futures markets following a progressive integration trend. There are various causes that could explain this outcome, such as the small transaction volumes in the Mexican oil market, transaction costs, and the price differential. Other important domestic factors relate to the fact that the structure of the Mexican oil industry market is completely monopolized by Petróleos Mexicanos (Pemex) and there is no futures and options market that could serve as a transparent hedging mechanism against exposure to the Mexican oil price risk.
The results of the conditional variance equations for the WTI and Brent futures yields are outlined in Panel B of Table 3. The  estimators of the ARCH effects are all significant at 1% and positive, meaning that past innovations have a positive and significant effect on the current volatility of futures prices. Likewise, the statistical significance of the
  estimators reveals the presence of a high degree of persistence in volatility. The justification for this finding is in line with the high volumes moving in the respective futures markets. These financial instruments have not only been added to investment portfolios as an option diversify risk, but have also been added for speculative purposes, which has spurred increasing volatility in recent years.
In terms of the short-term cross-market effect, the results or the  coefficients reveal that unexpected shocks from the physical oil markets can have a positive impact on the evolution of the current volatility in the futures markets, which can prompt price instability for the futures, in particular in the Istmo→WTI, Maya→Brent, and Istmo→Brent relationships. The existence of bilateral volatility transmission effects is only attained in the WTI↔Olmeca and Brent↔Olmeca relationships with stronger spillover effects, in terms of value, running from WTI and Brent to Olmeca, although the results are weak due to the specification error in the conditional variance of the futures yields. These findings are explained by the capacity of the futures markets to assimilate rapidly information from external events related to the Mexican energy reform.
Looking at the long-term cross-market effects, the  coefficients indicate that the bilateral volatility transmission effect only occurs in the WTI↔Olmeca and Brent↔Olmeca relationships. In absolute terms, the volatility transmission process is strongest in the WTI→Olmeca and Olmeca→Brent relationships than the opposite effect. This fact confirms the significant function of the futures markets in the area of information transparency in the oil market, as well as the integration of the Olmeca oil market via platforms to negotiate futures on international reference crude. The explanation for these findings can be found in the liberalization of the energy sector approved by the Mexican congress to allow foreign investment in to explore deepwater and ultra-deepwater wells in the Gulf of Mexico; Mexico's joining to the International Energy Agency in 2015, in an attempt to initiate the process to improve the oil and tax regime for extraction.
Just as in the physical oil markets, the direct and indirect asymmetry effects on the volatility of futures yields are statistically significant at 1%. The leverage effects of the physical markets Maya, Istmo, and Olmeca on the futures markets amount to 1.91, 1.90, and 3.06 for the WTI and 2.33, 4.73, and 3.26 for the Brent, respectively, pursuant to the magnitude and statistical significance of the  parameters of the error correction term in the conditional variance of the futures markets. The results reveal a mixed effect. For example, it is positive for the WTI→Maya, WTI→Istmo, and Brent→Maya relationships and negative for the WTI→Olmeca and Brent→Olmeca relationships. The positive value of the coefficients indicates that as the deviations between the physical and futures oil prices become smaller, volatility in the futures markets will rise at an accelerated pace, meaning that price behavior will become more volatile over time, and, as a result, it will be more difficult to predict, and vice versa.
The findings may hold relevance for the federal government and industrial consumers of Mexican oil, as they provide important information or develop cross-hedging strategies to help mitigate exposure to the oil price risk in times of extreme volatility. Moreover, these financial transactions will be more transparent and performed at lower transaction costs than hedging with sales options, characterized for having a riskier structure exacerbated by the risk of default from the counterparties. Likewise, the analysis of price and volatility transmission patterns may offer useful information for energy policy, in terms better understanding the vulnerability of the market to the opening of the oil sector to foreign investment. The availability of this information could also help energy policy designers to enact effective policies and a solid regulatory framework that guarantees the security of production and net exports in the Mexican crude basket, and, therefore, fosters competitiveness and sustainability in the country by ramping up its presence in international markets.
However, stakeholders in the futures and physical oil markets should be careful, because the results are too weak to explain the cross-market short- and long-term volatility effects. This is because several of the conditional variances did not manage to eliminate the autocorrelation in the standardized squared residuals as shown in Panel C in Tables 2 and 3. The Ljung-Box statistics with 18 lags indicate the presence of non-linear dependence on standardized squared innovations for the Brent→Maya, Brent→Istmo, Olmeca→WTI, and Olmeca→Brent relationships. This phenomenon characteristic of the financial series could be perhaps relaxed if structural changes were made to the bivariate VEC-EGARCH model.
CONCLUSIONS
This paper analyzed the process by which information on the mean and volatility is transmitted across the Mexican physical oil and international futures markets (WTI and Brent), using daily data from January 3, 2000 to December 31, 2015. The implementation of the bivariate VEC-EGARCH model with constant correlations proved insufficient to explain the process of bilateral volatility transmission in the physical oil and oil futures markets. According to the statistical significance of the estimates, the evidence for transmission of information related to the mean is bilateral with stronger and faster effects from the futures market toward the Istmo and Maya oil markets, although there are also strong and significant effects flowing from Olmeca oil to the WTI and Brent futures markets.
The reaction response to the temporary deviations from the long-term equilibrium is faster on the part of the Olmeca physical oil market than it is for the futures markets. Looking at the short- and long-term cross-market effects, the evidence for bilateral volatility transmission only exists for the WTI↔Olmeca and Brent↔Olmeca relationships, with the strongest and fastest effects flowing from WTI to Olmeca in the long term and from Olmeca to Brent. Moreover, the presence of deviations in the long-term equilibrium relationship intensifies volatility in the futures markets more than in the physical oil markets, meaning that the error correction term contains important information for predicting conditional volatility. The empirical findings carry significant economic and financial implications for the government, consumers, and energy policymakers. Knowledge of the direction of information flow and the intensification of volatility can help mitigate exposure to the Mexican oil price risk via cross-hedging strategies and the enactment of carefully designed and effective policies that drive economic growth and improve quality of life for the Mexican people. In this study, the VEC-EGARCH was unable to estimate changing correlations over time. This sort of problem will be dealt with in future research.
REFERENCES
Brooks, C. y Prokopczuk, M. (2013), “The Dynamics of Commodity Prices”, Quantitative Finance, vol. 13, núm. 4. [ Links ]
Chang, C.L., McAleer, M. y Tansuchat, R. (2009), “Modeling Conditional Correlations for Risk Diversification in Crude Oil Markets”, Journal of Energy Markets, vol. 2, núm. 4. [ Links ]
______ McAleer, M. y Tansuchat, R. (2010), “Analyzing and Forecasting Spillovers and Asymmetries in Mayor Crude Oil Spot, Forward and Futures Markets”, Working Paper No. 19/2010. [ Links ]
Cheng, W.H. y Hung, J.C. (2011), “Skewness and Leptokurtosis in GARCH-typed VaR Estimation of Petroleum and Metal Asset Returns”, Journal of Empirical Finance, vol. 18, núm. 1. [ Links ]
Engle, R. y Granger, C. (1987), “Co-integration and Error Correction: Representation, Estimation and Testing”, Econometrica, vol. 55, núm. 2. [ Links ]
Ewing, B., Malik, F. y Ozfiden, O. (2002), “Volatility Transmission in The Oil and Natural Gas Markets”, Energy Economics, vol. 24, núm. 6. [ Links ]
Geman, H. y Kharoubi, C. (2008), “WTI Crude Oil Futures in Portfolio Diversification: The Time-to-maturity Effect”, Journal of Banking & Finance, vol. 32, núm. 12. [ Links ]
Han, L., Liang, R. y Tang, K.E. (2013), “Cross-market Soybean Futures Price Discovery: does The Dalian Commodity Exchange Affect The Chicago Board of Trade?”, Quantitative Finance , vol. 13, núm. 4. [ Links ]
Hammoudeh, S., Li, H. y Jeon, B. (2003), “Causality and Volatility Spillovers Among Petroleum Prices of WTI, Gasoline and Heating Oil in Different Locations”, The North American Journal of Economics and Finance, vol. 14, núm. 1. [ Links ]
Jin, X., Xiaowen, S. y Tamvakis, M. (2012), “Volatility Transmission and Volatility Impulse Response Functions in Crude Oil Markets”, Energy Economics, vol. 34, núm. 6. [ Links ]
Kang, S.H., Cheong, C., y Yoon, S.M. (2011), “Structural Changes and Volatility Transmission in Crude Oil Markets”, Physica A, vol. 390, núm. 23-24. [ Links ]
Kroner, K.F., Kneafsey, K.P. y Claessens, S. (1995), “Forecasting Volatility in Commodity Markets”, Journal of Forecasting, vol. 14, núm. 2. [ Links ]
Lee, T.H. (1994), “Spread and Volatility in Spot and Forward Exchange Rates”, Journal of International Money and Finance, vol. 13, núm. 3. [ Links ]
Lin, S.X. y Tamvakis, M.N. (2001), “Spillovers Effects in Energy Futures Markets”, Energy Economics, vol. 23, núm. 1. [ Links ]
______ y Tamvakis, M.N. (2004), “Effects of NYMEX trading on IPE Brent Crude Futures Markets: a Duration Analysis”, Energy Policy, vol. 32, núm. 1. [ Links ]
Liu, X., Cheng, S., Wang, S., Hong, Y. y Li, Y. (2008), “An Empirical Study on Information Spillover Effects between The Chinese Copper Futures Market and Spot Market”, Physica A , vol. 387, núm. 4. [ Links ]
Nelson, D.B. (1991), “Conditional Heteroscedasticity in Asset Returns: a New Approach”, Econometrica, vol. 59, núm. 2. [ Links ]
Plourde, A. y Watkins, G.C. (1998), “Crude Oil Prices between 1985 and 1994: How Volatile in Relation to other Commodities?”, Resources andEnergy Economics, vol. 20, núm. 3. [ Links ]
Reigner, E. (2007), “Oil and Energy Price Volatility”, Energy Economics , vol. 29, núm. 3. [ Links ]
Sehgal, S., Berlia, N. y Ahmad, W. (2013), “An Examination of Price Discovery and Vlatility Spillovers of Crude Oil in Global linked Commodity Markets”, International Journal of Economics and Finance, vol. 5, núm. 5. [ Links ]
Spargoli, F. y Zagaglia, P. (2007), “The co-movements between Futures Markets for Crude Oil: Evidence from a Structural GARCH Model”, Working Paper 2007-15. [ Links ]
Soucek, M. y Todorova, N. (2014), “Volatility Transmission in Energy Futures Markets”, Journal of Energy Markets , vol. 7, núm. 3. [ Links ]
Zhong, M., Darrat, A.F. y Otero, R. (2004), “Price Discovery and Volatility Spillovers in Index Futures Markets: Some Evidence from Mexico”, Journal of Banking & Finance , vol. 28, núm. 12. [ Links ]
2In this context, volatility is defined as the variation of prices in the oil market, measured with autoregressive conditional heteroscedasticity models when the volatility changes over time.
3Attracted by sharply rising oil prices and the negative correlation between the energy and stock markets, institutional investors like pension funds and moderate- and high-risk hedge funds have started to use oil futures contracts in their portfolios to diversify risk.
4Due to the high-density and low-sulfur content of oil, it is important to remember that these stock exchanges trade in futures contracts for internationally-referenced oil, like the West Texas Intermediate in the United States (WTI) and the North Sea Brent of London.
5An information shock is any event that could have a significant impact on prices or volatility in the energy markets.
7The term innovation is another way to express the existence of positive and negative shocks on yields. Moreover, positive and negative shocks of the same magnitude have different effects on volatility.
8This basket of crudes serves as the principal watermark for setting prices in the Mexican Export Mix.
9As futures contracts approach their expiration dates, the concentration of market activity moves immediately to the second futures contract with the closest upcoming maturity, which automatically raises the transaction volume and interest open.
10For a more detailed technical description of the cointegration method, see Engle and Granger (1987).
Received: January 17, 2017; Accepted: June 10, 2017
 Este es un artículo publicado en acceso abierto bajo una licencia Creative Commons
