


Services on Demand
Journal
Article
 text in
  English (pdf)
 Article in xml format
 Article references
 Send this article by e-mail
Indicators
-
 Cited by SciELO
 -
 Access statistics
Related links
-
 Similars in
SciELO
Similars in
SciELO
Share

 Permalink
Problemas del desarrollo
Print version ISSN 0301-7036
Prob. Des vol.48 n.190 Ciudad de México Jul./Sep. 2017
Articles
Technology Companies and Public Policy for Regional Development in Brazil
1Extremadura University, Spain. E-mail addresses: marmiralles@unex.es, miralles@unex.es, juliodaza@unex.es, respectively.
This study aims to analyze the growth of technology companies in Brazil in 2002-2013. To do so, we use Gibrat’s law, otherwise known as the Law of Proportionate Effect (LPE) and the panel data model, which allows us to control unobservable heterogeneity. However, unlike the previous empirical evidence, this study takes into account the effect of the recent financial crisis and profitability on business growth. The main results show that in times of crisis, public policies could a lot some resources available to help some of the smaller, more profitable, and least indebted technology companies to boost economic growth.
Keywords: Gibrat's law; panel data; business growth; economic crisis; technology companies; public policy
El objetivo del presente estudio consiste en analizar el crecimiento empresarial del sector tecnológico de Brasil en el periodo 2002-2013. Para ello, se basa en la Ley de Gibrat o Ley del Efecto Proporcional (LEP) y en la metodología de datos de panel, ya que permite controlar la heterogeneidad inobservable. Sin embargo, a diferencia de la evidencia empírica previa, se tomaron en cuenta el efecto de la reciente crisis financiera y de la rentabilidad sobre el crecimiento empresarial. Los principales resultados obtenidos indican que en épocas de crisis, las políticas públicas podrían dedicar parte de sus recursos disponibles en ayudar a las empresas tecnológicas pequeñas, rentables y menos endeudadas para favorecer el crecimiento económico.
Palabras clave: Ley de Gibrat; datos de panel; crecimiento empresarial; crisis económica; empresas tecnológicas; políticas públicas
JEL: C23; C33; E32; G38; R11
Le but de cette étude consiste à analyser la croissance entrepreneuriale du secteur technologique au Brésil dans la période 2002-2013. Pour cela, nous nous appuyons sur la Ley de Gibrat ou Ley del Efecto Proporcional (LEP) et sur la méthodologie du panneau de données car elle nous permet de contrôler l’hétérogénéité inobservée. Néanmoins, on a pris en compte l’effet de la crise financière récente et les rendements sur la croissance entrepreneuriale ; contrairement à l’évidence empirique préalable. Les principaux résultats obtenus nous montrent qu’aux temps de crise les politiques publiques peuvent consacrer partie de ses propres ressources disponibles pour soutenir aux petites entreprises technologiques, rentables et moins endettées pour favoriser la croissance économique.
Mots clés: Ley de Gibrat; panneau de données; croissance entrepreneurial; crise économique; entreprises technologiques; politiques publiques
O objetivo deste estudo é analisar o crescimento dos empresarial do setor tecnológico no Brasil no período 2002-2013. Para isso, tomamos como base a Lei de Gibrat ou Lei do Efeito Proporcional (LEP) e na metodologia de dados em painel, já que nos permite controlar a heterogeneidade não observável. No entanto, ao contrário da evidência empírica anterior, foi tido em conta o efeito da recente crise financeira e da rentabilidade sobre o crescimento empresarial. Os principais resultados obtidos indicam que em tempos de crise as políticas públicas poderiam dedicar parte dos seus recursos disponíveis para ajudar as empresas tecnológicas pequenas, rentáveis e menos endividadas para incentivar o crescimento econômico.
Palavras-chave: Lei Gibrat; dados de painel; crescimento empresarial; crise econômica; empresas de tecnologia; políticas públicas
本文旨在分析2002-2013年间巴西技术部门的商务增长。此分析基于吉布莱特法律或相称法律(LEP)和数据面板这一研究方法以便于我们控制不可观测的异质性。不过,不同于以往的经验证明,在此次分析中我们考虑了近年来金融危机及商务增长收益的影响。分析结果显示,在危机时期,公共政策能够将其部分可利用资源用于帮助小型可盈利技术公司以促进经济增长。
关键词 吉布莱特法律; 数据面板; 商务增长; 经济危机; 技术公司; 公共政策
1. INTRODUCTION
Studies about business growth abound at present. And yet the ample empirical evidence is almost exclusively based on studies of growth in developed economies. However, the recent financial crisis has spurred interest in emerging countries, which have grown at faster rates than developing countries. Moreover, the business fabric in emerging countries is becoming increasingly relevant to international trade and markets. As such, now, more than ever, studying business growth in these economies is pertinent.
Concretely, Brazil stands out from the pack of emerging countries, fundamentally due to three reasons. First, because it harbors a wealth of raw materials. Second, because it is home to a nascent middle class whose demand for manufactured goods is on the rise. And third, because the country has undertaken numerous structural reforms in recent years that have opened the floodgates to foreign capital and led many foreign companies to set up shop in Brazil (Xia & Walker, 2015).
The presence of foreign companies in Brazil has boosted competition, which is why this paper analyzes the growth of the technology sector in the country, keeping in mind that it is a young sector with growth potential where barriers to entry are lower than in other sectors, all of which are circumstances favorable to business opportunities and drive business dynamics. The results of this analysis could serve to design economic and social policies for regional development.
This paper analyzes the growth of 91 companies in the Brazilian technology sector in the time period 2002-2013 using Gibrat’s Law or the Law of Proportionate Effect (LPE). There are two important reasons to study growth using the LPE. First, because the LPE models growth by making it resemble a known log-normal function, and second, because the results of an LPE study can be used to design public policy.
The LPE is the most widely used method to empirically analyze firm growth. This law serves to empirically study growth and add in explanatory variables, which is its main advantage over other growth analysis techniques. Gibrat (1931) understood growth to be the outcome of a random process of factors internal and external to the company, which varies as a function of the company’s capacity to leverage investment opportunities. Most striking about his work is his description of the LPE, expressing that all growth is independent from company size, such that all companies are equally likely to grow, rejecting the existence of an optimal company size. However, it is this very fact that facilitates the empirical study of company growth.
The LPE examines this lack of a relationship between growth and company size, revealing which types of companies grow the most as a function of their size. The results can be useful in adopting the right measures to boost development, invigorate the company, and create jobs. If a negative relationship is found between growth and size, then public institutions should design strategies to help smaller companies via subsidies, advising, and low-cost financing. Nevertheless, if there is a positive relationship, then institutions should encourage large companies to relocate to the region by offering them more favorable conditions than other regions so that they can become more competitive (Coad, Segarra & Teruel, 2016; Daunfeldt, Elert & Johansson, 2014; Wagner, 1992).
The results of this study lead us to reject the LPE, given that a negative relationship between growth and firm size was found, meaning that social and economic development strategies should focus on public policies to promote and develop small enterprises. Even so, the LPE that we examine here does allow additional variables to be added in order to explore other more specific criteria to formulate public policy.
This paper is structured as follows: the second section contains an overview of the growth study in relation to Gibrat’s Law. The third section presents the methodology used with panel data. The fourth provides the database of technology companies. The fifth describes the results obtained. Finally, the sixth offers conclusions from the entire work.
2. PRIOR EMPIRICAL EVIDENCE
Ample literature has been published studying growth using Gibrat’s (1931) LPE. We have divided these manifold papers into three phrases that elucidate how growth studies have evolved over the years. We refer to them as the industrial stage (1945-1974), the expansion stage (1975-1999), and the value-creation stage (2000-2015). Below are the main features of the growth studies in each of these stages.
Industrial Stage (1945-1974)
What most defines this stage is that the majority of the samples chosen contain large industrial companies, as can be seen in Table 1. Most of the research conducted in this stage is focused principally on challenging the validity of the LPE for different types of companies, especially European and American firms (Hart & Prais, 1956; Hymer & Pashigian, 1959; Mansfield, 1962; Simon & Bonini, 1958). On the other hand, several papers do not challenge the validity of the law, but rather offer proposals to mathematically improve the LPE (Aitchison & Brown, 1957; Kalecki, 1945).

In a study to improve the LPE, industrial concentration and sample selection were identified as explanatory factors underlying the acceptance or rejection of Gibrat’s law. With that said, Hart & Prais (1956) analyzed monopolistic markets for companies trading in the United Kingdom, accepting the LPE. Also, Simon & Bonini (1958) accepted the LPE in an examination of the growth of 500 large companies in the United States. Accepting this law signals that all companies are equally as likely to grow, giving rise to monopolistic market concentration.
On the other hand, sample selection was a driver of robust results from the LPE, mainly due to the difficulty of obtaining information about firms. This problem made it impossible to carry out the basic hypothesis for any classic regression model, due to the challenges involved in obtaining a random sample that is truly representative of the target population. Accordingly, Mansfield (1962) analyzed nearly all North American industrial companies in the time period 1917 to 1957, rejecting the LPE and detailing that the sample was selected to exclude companies that did not survive the period of study.
Expansion Stage (1975-1999)
A wide variety of papers were written during the economic expansion phase in the final quarter of the twentieth century, as can be seen in Table 2. The reason behind this prolific scientific activity was the significant business growth derived from industrialization in the United States and in most Western European countries.

This stage is characterized as a time not only when researchers devised solutions to the problems of the industrial stage, including issues related to sample selection and methodological constraints (Acs & Audretsch, 1990; Mata, 1994), but also collected the information necessary to design public policies that foster regional economic and social development (Wagner, 1992). As such, potential results of the Gibrat's Law contrast can be used to determine which companies, depending on size, grow the fastest and, therefore, are the greatest drivers of business dynamics and job creation.
Papers in this era tended to analyze firm growth in developed countries, primarily in the United States (Acs & Audretsch, 1990; Dunne, Roberts & Samuelson, 1989; Philips & Kirchhoff, 1989; Sing & Whittington, 1975) and European countries, like the United Kingdom (Chesher, 1979; Kumar, 1985), Germany (Wagner, 1992), Italy (Santarelli, 1997), Portugal (Mata, 1994) and Greece (Bourlakis, 1990). Most of these works reject the LPE, with the exception of research by Acs & Audretsch (1990) and Santarelli (1997), which accept the LPE, finding no relationship between firm size and growth.
Value-Creation Stage (2000-2015)
More recently, the empirical papers published in this phase have tended to use panel data and look at the influence of profitability on growth. Traditionally, papers using LPE contrasts have been written using conventional cross-section data samples or time series, but the introduction and advent of new techniques (especially panel data econometric models) have improved estimates in studies conducted to verify the LPE.
Concretely, in this stage, we see the rise of business profitability as a study variable, as shown in Table 3. Accordingly, Goddard, Molyneux & Wilson (2004) analyzed the influence of profitability on growth via panel data using the Ordinary Least Squares (OLS) method and the Generalized Method of Moments (GMM). This latter methodology considers and controls for unobservable heterogeneity and controls the fixed effects of each company throughout the time period analyzed using error term modeling. Other papers, like those by Jang & Park (2011), and Homma, Tsutsui & Uchida (2014) use solely the GMM.

Moreover, in this phase, there is a series of papers analyzing the growth-profitability ratio (Coad, Rao & Tamagni, 2011; Cowling, 2004; Goodard, Molyneux & Wilson, 2004; Jang & Park, 2011; Lee, 2014; Shezhad, De Haan & Sholtens, 2013). This research analyzes the influence not only of profitability on growth, but also of growth on profitability. A positive ratio between the two is underpinned by the advantages of the economies of scale that larger companies enjoy and the importance of earning profits to commit to investment projects. However, management theories hold that there is a negative ratio between the two variables, due to issues of agency and project selection criteria. Thus, Steffens, Davidsson & Fitzsimmons (2009) asserted that companies first undertake more profitable projects and later continue to grow with less profitable projects, prioritizing one objective to the detriment of the other.
Moreover, this phase is characterized by the emergence of papers analyzing firm growth in diverse economic sectors, principally in developed countries, as can be seen in Table 3. Likewise, Table 3 shows that nearly all of the papers analyzed mature sectors with little growth potential, such as education (Cowling, 2004), the service sectors (Oliveira & Fortunato, 2008), hospitality (Jang & Park, 2011), and even the banking sector (Goddard, McKillop & Wilson, 2014).
It is important to note that research in this phase has also begun to analyze technology firm growth in developed countries, given that the technology sector is young and has a lot of growth potential (Audretsch, Coad & Segarra, 2014; Botazzi, Dosi Lippi, Pammolli & Riccaboni, 2001; Coad & Rao, 2008, 2011; Pagano & Schivardi, 2003; Santarelli & Vivarelli, 2002). For that reason, it is interesting to analyze technology company growth in emerging countries, because a country’s economic growth is closely tied to technological changes (Pagano & Schivardi, 2003) and, moreover, there is a positive relationship between technology sector growth and job creation (Coad & Rao, 2011).
3. METHODOLOGY
This paper analyzes Brazilian technology company growth with an LPE contrast. Concretely, the influence of company size and profitability on growth will be contrasted, which are two of the factors paid a great deal of attention in the value-creation stage in which this paper fits. Moreover, we analyze how the financial crisis has affected the growth of technology companies and the growth-profitability ratio.
Below are the models and the methodology used to conduct the aforementioned analysis. Consequently, applying the LPE and the literature described in the preceding review, the following model for firm growth is proposed, expressed as follows:
Where CREC it , following Coad et al. (2011), firm growth, has been calculated by taking the difference of the logs of company size between the two consecutive periods. In this case, firm size, represented by TAM it-1 , has been measured in sales figures, like in the paper by Audretsch, Klomp, Santarelli & Thurik (2004), because this criterion is the most widely used to contrast the LPE for each of the enterprises i=1,…,91 in each time period t=2003,…,2013. Thus, growth is explained also as a function of financial profitability, expressed by way of 〖RENT〗_(i,t), in keeping with Goddard et al.'s (2004) work, and represents the profitability of own resources or financial profitability.
On the other hand, debt (END it ) has been incorporated as a control variable in keeping with papers published by Oliveira and Fortunato (2006) and Jang & Park (2011). Concretely, in accordance with Jang & Park (2011), long-term debt is calculated as the ratio of long-term debt to total assets. Billett, King & Mauer (2007) found empirical evidence for a negative relationship between the growth rate and the most indebted companies, therefore supporting the idea that leverage can have a negative influence on growth.
Additionally, this paper contrasts the LPE in the time period 2002-2013, during which time there was a major global financial crisis. For that reason, aiming to analyze the effect of the financial crisis on the validity of the LPE in the Brazilian technology sector, a dummy variable for the crisis was included in the basic model, given the value of 1 for the 2009-2013 crisis time period and 0 for all other years, expressed in the following way:
On the other hand, as has been mentioned before, in the value-creation stage, in recent years, company profitability has been contrasted with the LPE in Brazil. As such, the choice was made to analyze this effect, including in the base growth model a variable for profitability conditioned by the crisis, expressed as follows:
Where the variable RENTCRISIS is the product of the variable profitability multiplied by the crisis dummy variable. This model can be used to analyze the influence of profitability in the crisis period, checking whether the change in economic circumstances makes growth dependent on economic and financial factors. By including this variable, we are able to analyze the effect of the crisis on a young sector with growth potential, like the technology sector.
One aspect of growth studies that has received a good deal of attention is how the methodology has evolved. Accordingly, the studies analyzed above have drawn on a wide range of different methodologies, such as the least ordinary squares model with fixed effects, and the GMM, using panel data.
This methodology makes it possible to model the unobservable heterogeneity that exists across different countries by decomposing the error term into three components, while also making it possible to increase the number of observations and degrees of freedom in the models and, therefore, the consistency of results.
As such, μ i,t is the error term that is decomposed into three pieces, such that μ i,t = ηi + λt + v k , where ŋ i is the part of the specific error of the individual (unobservable heterogeneity) that reflects those unobservable effects that affect only company t, ʎ t represents those shocks that happen at time t and affect all individuals equally, and v k is a random disturbance. Likewise, the statistic used to measure the goodness-of-fit for the fixed effects model is coefficient R 2 . Moreover, for the fixed effects model and the generalized method of moments, the Wald test expressed through an F was used, representing the joint significance of the explanatory variables.
In terms of the generalized method of moments, the Arellano & Bond (1991) test provides some information, contrasting the null hypothesis of auto-correlation of the instruments on the second order, expressed by way of m 2 . It also represents the result of the Sargan test which makes it possible to contrast the overidentification of the instruments. As such, in this case, the instruments used in the GMM are adequate because they are not auto-correlated with each other and are not overidentified.
4. DATABASE
This paper contrasts the LPE in large technology companies in Brazil. The data were taken from the Exame journal’s database of 91 companies with activities in the country from 2002 to 2013. The year 2002 was chosen as the first year of the analysis as this is the year when the stock market crisis hit technology companies, and it is also the year when Brazil undertook profound structural reforms, such as sectoral liberalization and financial market deregulation, spawning an entirely new business environment in Brazil and encouraging foreign companies to enter the country, making the market more competitive.
In this LPE contrast, firm growth is analyzed by way of technology firm size and other control variables like profitability and debt. Table 4 summarizes how each of the variables used was measured.

Furthermore, Table 5 summarizes the descriptive statistics for the variables of growth, company size, profitability, and debt. In Panel A of Table 5, it appears that growth for the entire set of technology companies varied by 22.52%, with mean profitability of 11.01% and a mean debt level of 18.52%. Moreover, Panel B of Table 5 reveals that the set of variables used are positively correlated with each other with the exception of debt and profitability. Finally, the sample is an imbalanced panel data set.
Table 5 Descriptive Statics

The table depisc the descriptive statics for the dependent variable growth (CREC) the independendent variables, like company size (TAM), profitability (RENT), and debt (ENT). Panel A presents the descriptive statics, including minimun, median, maximun and mean, standard deviation and number of observations. Panel B shows the correlation matrix between the variables used.
Source: Created by the authors
5. RESULTS
This section introduces the results of the company growth study in the Brazilian technology sector. This study was conducted using an LPE contrast pursuant to the methodology described above. First, Table 6 summarizes the results of the model proposed to contrast the LPE estimated with fixed effects and the generalized method of moments.
Table 6 Analyzing Growth in the Techology Sector

This table summarizes the results of estimating firm growth through the least ordinary fixed effects method and the generalized method of moments (GMM) method, as a function of size in the period prior (TAMi-t-1), profitability in the period prior (RENT i-t-1), and debt in the period prior (END i-t-1). The statistics used to measure the goodness-of-fit included the coefficient R2 and the Wald test expressed by F. The results of the Arellano & Bond (1991) second-order autocorrelation test represented by way of m2 and the Sargan overidentification test for the instrument are shown . The number of observations used in each estimate expressed by N in also given.
***represent coefficient that are signficant at level of 1%.
Source: Created by the authors.
The results reveal that the LPE is rejected, because growth is explained negatively and significantly by company size. This means that the smallest companies are those that grow the most. As such, public institutions should design and enforce strategies designed to help small enterprises emerge and stimulate their development to boost business momentum and create jobs (Coad et al., 2016; Daunfeldt et al., 2014; Wagner, 1992).
Moreover, the results of the model show that technology sector company growth is independent from business profitability. However, debt has a negative and significant influence on the growth of the technology sector as a whole in the time period analyzed. This means that in the technology sector, which is a young sector, debt does not have the positive effect desired on the growth of companies, as is the case in more mature sectors.
Looking at the statistics used, in the estimate using the fixed effects method an adequate coefficient was obtained for the goodness-of-fit test on the model (R 2 ), and the Wald test was applied for the joint significance of the explanatory variables using the Snedecor F. Similarly, the statistics for the GMM indicate that the instruments used are the right instruments, because they are not correlated on the second order, as can be seen in the results of the Arellano & Bond (1991) test. Nor are they overidentified, as seen in the Sargan test.
The timespan during which company growth is analyzed is very long. It encompasses an initial stage of economic prosperity and a second phase of recession following the subprime mortgage crisis that began in the United States. Table 7 summarizes the results of the effects of the financial crisis on company growth.
Table 7 The Effect of he Crisis on the Analys of Technology Sector Growth
This table summarizes the results of estimating firm growth through the least ordinary fixed effects method and the generalized method of moments (GMM) method, as a function of size in the period prior (TAM i-t-1 ), profitability in the period prior (RENT i-t-1 ), and debt in the period prior (END i-t-1 ) of the dummy variable of crisis in the period prior (CRISIS i-t-1 ). The statistics used to measure the goodness-of-fit included the coefficient R2 and the Wald test expressed by F. The results of the Arellano & Bond (1991) second-order autocorrelation test represented by way of m 2 and the Sargan overidentification test for the instrument are shown . The number of observations used in each estimate expressed by N in also given.
***represent coefficient that are signficant at level of 1%.
Source: Created by the authors.
The results show how the financial crisis had a significant and negative effect on the growth of technology companies, regardless of the sort of estimate used, with the influence of the rest of the explanatory variables remaining constant. As such, the time period 2009-2013 had a negative influence on the growth of Brazilian technology companies.
Table 8 summarizes the results of the profitability effect on growth, conditioned by the crisis period. The results show use that a change in the economic circumstances worldwide spurred nuances or features that began to set companies apart from one another in terms of their growth potential. Such is the concrete case of firm profitability, because the most profitable companies have better growth potential, which is logical, because a company earning more profit has greater financial capacity to undertake new investment projects and, therefore, to grow.
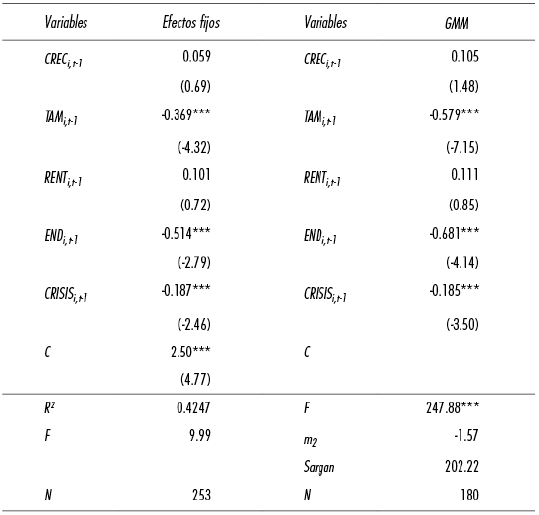
Table 8 Effect of Profibility and Crisis on Growth Analysis

This table summarizes the results of estimating firm growth through the least ordinary fixed effects method and the generalized method of moments (GMM) method, as a function of size in the period prior (TAMi-t-1), profitability in the period prior (RENT i-t-1 ), and debt in the period prior (END i-t-1 ) of the dummy variable of crisis in the period prior (CRISIS i-t-1 ) and the variable of profibility conditioned by crisis (RENTCRISIS i-t-1 )The statistics used to measure the goodness-of-fit included the coefficient R2 and the Wald test expressed by F. The results of the Arellano & Bond (1991) second-order autocorrelation test represented by way of m 2 and the Sargan overidentification test for the instrument are shown . The number of observations used in each estimate expressed by N in also given.
***, **, * represent coefficient that are signficant at a level of 1,5, and 10, respectively.
Source: Created by the authors.
The results in Table 8 show us that in times of financial crisis, the small, most profitable, and least indebted companies in the technology sector are those companies best able to leverage public policy aid and efforts to breathe life into the economy and job creation.
In summary, the LPE is rejected because growth is not a random process, and it emerged that size, debt, and the financial crisis period have a negative and significant influence on firm growth. Even so, it also appears that financial profitability in a time of crisis is a necessary requirement in the technology sector in order to finance business opportunities that arise.
6. CONCLUSIONS
This paper analyzed Brazilian technology sector growth using the LPE. First, a review of the empirical literature was conducted to explore papers that researched business growth using the LPE, because it can have significant implications for designing regional development policies to invigorate business growth and job creation.
At the moment, the recent financial crisis has sparked interest in studying growth in Brazil. Furthermore, deregulation and market liberalization in these markets have brought more foreign companies in looking for opportunities in the region. This has in turn made competition tighter between the companies and in the development of the industrial sector.
As such, in a globalized context marked by mature productive sectors, growth was analyzed in the Brazilian technology sector, which is considered to be a high growth potential sector, with lower barriers to entry than in other sectors, meaning that growth will not be affected by aspects such as the age of companies or degree of concentration.
Moreover, it was also found that the evolution of growth has been tied to evolving progress made in the methodology to study it and in econometric models. Principally, the evolution of methodologies for panel data methods is particularly striking and, as a result, the fixed effects least ordinary squares method and the generalized method of moments, which are considered the most suitable for studying growth.
Looking at the results obtained, it is demonstrated that the LPE is rejected, because business growth is explained negatively and significantly by company size. Moreover, the crisis and firm growth are inversely related to one another. But the results also show how profitability has a positive and significant influence on growth in times of crisis. This means that business profitability is an important aspect with respect to business growth when there are obstacles to financing and the economic scenario is adverse.
The results obtained are useful in designing economic and business policy in order to make more efficient use of resources to invigorate the business sector and job creation. In this sense, public policies could allot a portion of their resources to helping the smaller and least-indebted technology companies and, in times of crisis, channel efforts towards those that are most profitable, because it is these companies that will spur the most growth.
ACKNOWLEDGEMENTS
We would like to acknowledge the Extremadura Board for the financial support provided to the GIMAF Research Group (reference GR15027) through the 5th Regional Technology Development and Innovation Research Plan (2014-2017).
REFERENCES
Acs, Z. & Audretsch, D. (1990), Innovation and Small Firms, Cambridge, Massachusetts, The MIT Press. [ Links ]
Aitchison, J. & Brown, J.A.C. (1957), The Lognormal Distribution, Cambridge, Cambridge, University Press. [ Links ]
Arellano, M. & Bond, S. (1991), Some Tests of Specification for Panel Data. Monte Carlo Evidence and an Application to Employment Equations, Review of Economic Studies, 58(2), 277-297, recuperado de <http://www.jstor.org/stable/2297968> [ Links ]
Audretsch, D., Coad, A. & Segarra, A. (2014), Firm Growth and Innovation, Small Business Economics, 43, 743-749, DOI <http://dx.doi.org/10.1007/s11187-014-9560-x> [ Links ]
Audretsch, D.B., Klomp, L., Santarelli, E. & Thurik, A.R. (2004), Gibrat’s Law. Are The Services Different?, Review of Industrial Organization, 24(3), 301-324, DOI <http://dx.doi.org/10.1023/B:REIO.0000038273.50622.ec> [ Links ]
Billett, M., King, T. & Mauer, D. (2007), Growth Opportunities and The Choice of Leverage, Debt Maturity and Covenants, Journal of Finance, 62, 533-575, DOI <http://dx.doi.org/10.1111/j.1540-6261.2007.01221.x> [ Links ]
Bottazzi, G., Dosi, G., Lippi, M., Pammolli, F. & Riccaboni, M. (2001), Innovation and Corporate Growth in The Evolution of The Drug Industry, International Journal of Industrial Organization, 19, 1161-1187, DOI <http://dx.doi.org/10.1016/S0167-7187(01)00068-6> [ Links ]
Bourlakis, C. A. (1990), Probability of Survival & Firm Growth in Greek Manufacturing Industries, European Association for Research in Industrial Economics (EAIRE), University of Leeds. [ Links ]
Chesher, A. (1979), Testing the Law of Proportionate Effect, Journal of Industrial Economics, 27(4), 403-411, DOI <http://dx.doi.org/10.2307/2097961> [ Links ]
Coad, A. & Rao, R. (2008), Innovation and Firm Growth in High-tech Sectors. A Quantile Regression Approach, Research Policy, 37, 633-648, DOI <http://dx.doi.org/10.1016/j.respol.2008.01.003> [ Links ]
______ & Rao, R. (2011), The Firm-level Employment Effects of Innovations in High-tech US manufacturing Industries, Journal of Evolutionary Economics, 21(2), 255-283, DOI <http://dx.doi.org/10.1007/s00191-010-0209-x> [ Links ]
______, Rao, R. & Tamagni, F. (2011), Growth Processes of Italian manufacturing Firms, Structural Change and Economic Dynamics, 22(1), 54-70, DOI <http://dx.doi.org/10.1016/j.strueco.2010.09.001> [ Links ]
______, Segarra, A. & Teruel, M. (2016), Innovation and Firm Growth: Does Firm Age Play a Role?, Research Policy, 45, 387-400, DOI <http://dx.doi.org/10.1016/j.respol.2015.10.015> [ Links ]
Cowling, M. (2004), The Growth-profit Nexus, Small Business Economics , 22 (1), 1-9, DOI <http://dx.doi.org/110.1023/B:SBEJ.0000011568.42714.c9> [ Links ]
Daunfeldt, S. O., Elert, N. & Johansson, D. (2014), The Economic Contribution of High-Growth Firms: Do Policy Implications Depend on The Choice of Growth Indicator?, Journal of Industry, Competition and Trade, 14, 337-365, DOI <http://dx.doi.org/10.1007/s10842-013-0168-7> [ Links ]
Dunne, T., Roberts, M. & Samuelson, T. (1989), The Growth and Failure of US manufacturing Plants, Quarterly Journal of Economics, 104, 671-698, recuperado de <http://www.jstor.org/stable/2937862> [ Links ]
Gibrat, R. (1931), Les Inegalites Economiques, Paris, Francia, Librairie du Recueil Sirey. [ Links ]
Goddard, J., McKillop, D. & Wilson, J. O. S. (2014), U.S. Credit Unions: Survival, Consolidation and Growth, Economic Inquiry, 52 (1), 304-319, DOI <http://dx.doi.org/10.1111/ecin.12032> [ Links ]
______, Molyneux, P. & Wilson, J. O. S. (2004), Dynamics of Growth and Profitability in Banking, Journal of Money, Credit & Banking, 36(6), 1069-1090, recuperado de <http://www.jstor.org/stable/3839101> [ Links ]
Hart, P. E. & Prais, S. J. (1956), The Analysis of Business Concentration. A Statistical Approach, Journal of the Royal Statistical Society, 119, 150-191, recuperado en <http://www.jstor.org/stable/2342882> [ Links ]
Homma, T., Tsutsui, Y. & Uchida, H. (2014), Firm Growth and Efficiency in The Banking Industry. A New Test of The Efficient Structure Hypothesis, Journal of Banking and Finance, 40, 143-153, DOI < http://dx.doi.org/10.1016/j.jbankfin.2013.11.031> [ Links ]
Hymer, S. & Pashigian, P. (1959), Firm Size and Rate of Growth, Econometrica, 27, 556-569, recuperado en <http://www.jstor.org/stable/1828779> [ Links ]
Jang, S. & Park, K. (2011), Inter-relationship between Firm Growth and Profitability, International Journal of Hospitality Management, 30(4), 1027-1035, DOI <http://dx.doi.org/10.1016/j.ijhm.2011.03.009> [ Links ]
Kalecki, M. (1945), On The Gibrat Distribution, Econometrica , 13(2), 161-170, recuperado en <http://www.jstor.org/stable/1907013> [ Links ]
Kumar, M. S. (1985), Growth, Acquisition Activity and Firm Size. Evidence from the United Kingdom, Journal of Industrial Economics , 33, 327-338, recuperado en <http://www.jstor.org/stable/2098540> [ Links ]
Lee, S. (2014), The Relationship between Growth and Profit. Evidence from Firm-level Panel Data, Structural Change and Economic Dynamics , 28, 1-11, DOI < http://dx.doi.org/10.1016/j.strueco.2013.08.002> [ Links ]
Mata, J. (1994), Firm Growth during Infancy, Small Business Economics , 6(1), 27-39, DOI <http://dx.doi.org/10.1007/BF01066110> [ Links ]
Mansfield, E. (1962), Entry, Gibrat’s Law, Innovation, and the Growth of Firms, American Economic Review, 52(5), 1023-1051, recuperado en <http://www.jstor.org/stable/1812180> [ Links ]
Oliveira, B. & Fortunato, A. (2006), Testing Gibrat’s Law. Empirical Evidence from A Panel of Portuguese manufacturing Firms, International Journal of the Economics of Business, 13(1), 65-81, DOI <http://dx.doi.org/10.1080/13571510500519996> [ Links ]
______ (2008), The Dynamics of the Growth of Firms. Evidence from the Services Sector, Empirica, 35(3), 293-312, DOI <http://dx.doi.org/10.1007/s10663-008-9065-4> [ Links ]
Pagano, P. & Schivardi, F. (2003), Firm Size Distribution and Growth, Scandinavian Journal of Economics, 105, 255-274, recuperado en <http://www.jstor.org/stable/3441044> [ Links ]
Phillips, B. D. & Kirchhoff, B. A. (1989), Formation, Growth and Survival; Small Firm Dynamics in the U.S. Economy, Small Business Economics , 1(1), 65-74, DOI <http://dx.doi.org/10.1007/BF00389917> [ Links ]
Santarelli, E. (1997), La relazione tra dimensione iniziale, sopravivenza e crescita delle imprese nel settore turístico in Italia, Statistica, 57, 125-138. [ Links ]
Santarelli, E. & Vivarelli, M. (2002), Is subsidizing Entry An Optimal Policy?, Industrial and Corporate Change, 11(1), 39-52, DOI <https://doi.org/10.1093/icc/11.1.39> [ Links ]
Shehzad, C. T., De Haan, J. & Sholtens, B. (2013), The Relationship between size, Growth and Profitability of Commercial Banks, Applied Economics, 45, 1751-1765, DOI <http://dx.doi.org/10.1080/00036846.2011.637896>. [ Links ]
Simon, H. A. & Bonini, C. P. (1958), The Size Distribution of Business Firms, American Economic Review , 48, 607-617, recuperado en <http://www.jstor.org/stable/1808270> [ Links ]
Singh, A. & Whittington, G. (1975), The Size and Growth of Firms, Review of Economic Studies , 42 (1), 15-26, DOI <http://www.jstor.org/stable/2296816> [ Links ]
Steffens, P., Davidsson, P. & Fitzsimmons, J. (2009), Performance Configurations Over Time: Implications for Growth and Profit oriented Strategies, Entrepreneurship Theory and Practice, 33(1), 125-148, DOI <http://dx.doi.org/10.1111/j.1540-6520.2008.00283.x> [ Links ]
Wagner, J. (1992), Firm Size, Firm Growth, and Persistence of Chance. Testing Gibrat’s Law with Establishment Data from Lower Saxony, 1978-1989, Small Business Economics , 4(2), 125-131, DOI <http://dx.doi.org/10.1007/BF00389853> [ Links ]
Xia, F. & Walker, G. (2015), How Much does Owner Type Matter For Firm Performance? Manufacturing Firms in China 1998-2007, Strategic Management Journal, 36(4), 576-585, DOI <http://dx.doi.org/10.1002/smj.2233> [ Links ]
Received: November 07, 2016; Accepted: March 09, 2017
 Este es un artículo publicado en acceso abierto bajo una licencia Creative Commons
