


Services on Demand
Journal
Article
 text in
  English (pdf)
 Article in xml format
 Article references
 Send this article by e-mail
Indicators
-
 Cited by SciELO
 -
 Access statistics
Related links
-
 Similars in
SciELO
Similars in
SciELO
Share

 Permalink
Problemas del desarrollo
Print version ISSN 0301-7036
Prob. Des vol.48 n.188 Ciudad de México Jan./Mar. 2017
Articles
Challenges in the Economic and Sociodemographic Transition of Mexico and Vietnam
1Faculty of Political and Social Sciences at the National Autonomous University of Mexico (UNAM), Mexico. E-mail address: lukasz@comunidad.unam.mx
What are the impacts of neoliberalism on the political and sociodemographic transition taking place in Mexico and the Socialist Republic of Vietnam, taking into account the similarities and differences between the two countries? The transformation of the State and society in Mexico and Vietnam took off when the countries began to implement neoliberal policies in the 1980s, the modus operandi being a reduced role for the State and a weaker relationship with the economy in both countries. Neoliberalism has also had an impact on the social sphere, evident in an analysis of the demographic transition, creating sociodemographic gaps between population groups, as well as in the realm of education and labor, and even more so for the indigenous population.
Key Words: Neoliberal policies; State crisis; sociodemographic transition; education; indigenous population
¿Cuáles son los impactos del neoliberalismo en la transición política y sociodemográfica en México y la República Socialista de Vietnam, tomando en cuenta similitudes y diferencias entre ambos países? La dinámica de la transformación del Estado y la sociedad en México y Vietnam se aceleró con el proceso de la implementación de las políticas neoliberales a partir de los años ochenta, modus operandi de la disminución del papel del Estado y su relación con la economía de ambos países. El neoliberalismo también tuvo impacto en la esfera social, al analizar la transición demográfica, creando brechas sociodemográficas entre grupos poblacionales, asimismo en la esfera educativa y laboral, aún más en la población indígena.
Palabras clave: políticas neoliberales; crisis del Estado; transición sociodemográfica; educación; población indígena
Quels sont les impacts du néolibéralisme sur la transition politique et socio-démogra phiques du Mexique et la République socialiste du Vietnam, en tenant compte des similitudes et des différences entre les deux pays? La dynamique de la transformation de l’Etat et de la société mexicaine et vietnamienne ont accéléré le processus de la mise en oeuvre des politiques néolibérales au cours des années quatre-vingt; le modus operandi de l’affaiblissement du rôle de l’Etat et sa relation avec l’économie des deux pays. L’analyse de la transition démographique montre que le Néolibéralisme a également eu un impact sur le domaine social, en particulier la création d’écarts démographiques entre les groupes de population, et aussi dans le domaine de l’éducation et du travail, spécialement dans la population indigène.
Mots clés: les politiques néolibérales; la crise de l’Etat; la transition démographiques; l’éducation; la population indigène
Quais são os impactos do neoliberalismo na transição política e sócio-demográfica do México e da República Socialista do Vietnã, tendo em conta as semelhanças e diferenças entre os dois países? A dinâmica da transformação do Estado e da sociedade no México e no Vietnã acelerou o processo de implementação das políticas neoliberais a partir da década de oitenta, modus operandi da diminuição do papel do Estado e sua relação com a economia de ambos países. O neoliberalismo também teve um impacto sobre a esfera social, ao analisar a transição demográfica, criando vazios demográficos entre grupos populacionais, também na esfera educacional e de trabalho, especialmente na população indígena.
Palavras-chave: políticas neoliberais; crise de Estado; transição sócio-demográfica; educação; população indígena
本文综合考虑墨西哥和越南两国的相似性及差异, 探讨新自由主义在政治和社会人口转型中的影响。随着上世纪80年代新自由主义政策的实施, 墨西哥和越南两国的国家及社会转型快速发展。新自由主义政策减少了政府在经济中的作用。新自由主义在社会领域也有影响, 本文在分析人口转型时发现新自由主义导致了不同社会群体之间的社会及人口差距。此外, 新自由主义在教育和劳动领域, 甚至在土著居民人口方面也有影响。
关键词: 新自由主义政策; 国家危机; 社会人口转型; 教育; 土著居民
The people of Vietnam have come to occupy a prominent place in contemporary history, and their battles continue without ceasing. To these heroic, brave, and revolutionary people, building a socialist society in difficult conditions, but with the enthusiasm of those who have an unbreakable faith in the future, I dedicate these modest pages, the fruit of an unforgettable and fruitful journey.
Introduction
At the end of the 1980s, the transformation of the state and society in Mexico and Vietnam began to take off with implementation of neoliberal policies. In Mexico, structural adjustments and market reforms were introduced during the administration of President Miguel de la Madrid (1982-1988). It was in the same decade when reforms designed to open the market were implemented in Vietnam, known as the Đổi Mới policy, a term meaning “renewal,” related to the internal critique of the VI National Congress of the Communist Party held in December 1986.
The objective of this paper is to analyze, on the one hand, the impact of neoliberalism on political transformation, in other words, the position of the State with respect to market forces, and, on the other, the impact of neoliberalism on society, analyzing the sociodemographic transitions, as well as education and labor relations in the two countries.
The common denominator for the two nations consists of the negative processes that accompanied the sociodemographic transformations they have undergone throughout the decades of neoliberalism, including: social exclusion, inequalities, labor precariousness, and widening gaps between population groups, especially with the indigenous people. As if that were not enough, the impact of neoliberalism can be observed in the social sphere: in the sociodemographic transition, in education, and in labor relations. The State does not intervene in support of excluded groups, does not act to mitigate educational inequalities, and maintains precarious conditions for a working life of misery for many.
This paper is divided into five parts. In addition to an introduction and final reflections, the political transformation is analyzed, followed by an approach to the impact of neoliberalism on the sociodemographic transition, and, finally, a section on the impact of neoliberalism on the indigenous population.
The State and the Process of Neolberal Transformation
In Mexico and Vietnam, the period of neoliberal transformation began in the 1980s. This change had an impact such that the concept of the State was reflected in the constitutional reforms of the two countries. In the case of Mexico, after three centuries of the Viceroyalty and relations of dependency on the Spanish Crown, in the nineteenth century it entered into, essentially asymmetrically, an inevitable partnership with the United States (Smith, 2000). The impact of the two influences, viceroyal and American, is reflected in the Political Constitution of 1917. Besides the influences on the way in which the Executive, Legislative, and Judicial powers were set up, the Constitution also established a regime to protect social rights. These include the right to a secular education (Article 2), the right to health (Article 5), land ownership (Article 27), and the right to work (Article 123), primarily.
Thus was established the visible framework of a strong State presence at the heart of society and the economy. The spirit of the Constitution demarcates a central role for the State. According to Article 25: "The Federal State shall give rise to national development that shall be comprehensive and sustainable […]. Taking into account social equity and productivity as its guidelines, the public sector shall aid and promote companies, both in the private sector and the social sector of the economy."
Article 3 was the most disputed during the Constituent Assembly of 1916-1917. It is worth noting that then-President Venustiano Carranza was only present at the debate once, precisely at the session held on December 13, 1916 when Article 3 was discussed, establishing the principle of free and lay education as conducts of the State. As seen in Article 27, the matter of land was one of the most important during the Revolution and afterwards at the Constitutional Congress. Marván Laborde finds five fundamental points in this article:
First, the definition of land and water ownership corresponds to the Nation; second, among the assets of the Nation are included minerals in the subsoil, whose antecedent is found in the Royal Ordinances of New Spain of 1783; third, these subsoil assets shall not belong to any individual owner and exploitation shall be subject to concession; fourth, specific restrictions and prohibitions were established on acquiring land; fifth, agrarian decisions were defined in terms of distribution to the people (D.D., 2005: 1002-1005).
Based on Article 27, land distribution began. The strong presence of the State marked the steps towards distribution. Article 123, establishing the right to work, and the right to strike for workers, also spoke of a decent minimum wage.
Throughout the neoliberal transformation process, the articles related to social rights changed. It is worth noting that the Mexican Constitution, with over 600 amendments, is one of the oldest constitutions in Latin America and the Caribbean.
The transformation of the State, from a central role to a fading role, began in the 1980s and culminated in the 1990s. The reform to Article 27 of the Constitution commenced under the administration of President Carlos Salinas de Gortari (1989-1994) in 1992. This amendment put an end to the ejido system and allowed collective land owners to sell their plots. The second phase is related to the constitutional changes enacted under the administration of current President Enrique Peña Nieto (2013-2018). The right to grant concessions for the exploitation and extraction of hydrocarbons was introduced, "the use or harnessing of the resources in question, by individuals or companies incorporated under Mexican law, shall not be done except by through concessions" (Article 27). Its purpose, as indicated, is to boost State revenue:
With the purpose of obtaining income for the State that contributes to the long-term development of the Nation, the Nation shall carry out the activities of exploration and production of oil and other hydrocarbons through entitlements to State productive companies or through contracts with them or with private parties, under the terms of the Regulatory Law. To achieve the purpose of such entitlements or contracts, State productive companies may contract with private parties (Article 27, paragraph added December 20, 2013).
The Socialist Republic of Vietnam, just like Mexico, unveiled a transformation of the legal order starting in the 1980s. Historically, Vietnam was formed as a State in the shadow of its relations with its big neighbor, China. Vietnamese relationships with the Chinese feudal dynasties were based on investiture beseeching, which began in the tenth century. According to My Hanh: "For Vietnam, whose border was adjacent to Great Feudal China and who used to be invaded by China for thousands of years, investiture beseeching was always used as a diplomatic way to maintain friendship with this strong neighbor” (My Hanh, 2016: 17).
The nineteenth century ushered in the advent of the French conquest, which would last until the second half of the twentieth century. In this way, "Vietnam's struggle was an offensive struggle. This characteristic makes the Vietnamese different from those who had to confront the Spanish conquerors in Latin America" (Czarnecki, 2011: 208). Bassols Batalla asserted that "when we speak of Vietnam, we should therefore consider it a socialist country that has all of the possibilities given by the creation of socioeconomic structures, as well as an underdeveloped country, with everything that entails in terms of difficulties, survival, and obstacles” (1981: 58).
In 1946, the first Constitution of the Socialist Republic of Vietnam was established. However, war and the confrontation against imperialist France and subsequently against the United States would last well into the 1970s.
Besides the 1946 Constitution, Vietnam enacted four other constitutions, in 1959, 1980, 1992, and 2013. As in the case of Mexico, the constitutional changes made starting in the 1980s entailed opening up the system to the free market (the Đổi Mới policy, the “renewal”).
In 1986, at the VI National Congress of the Communist Party of Vietnam, “serious errors” in the State policy were recognized and the party pledged to implement reforms to change, among other areas, the sphere of agroindustry: “the right to work and access capital, as well as use land in the long term (including forests and water surfaces) by rural communities" (Xuan Nam, 2001: 103). Rural farmers were no longer obliged to sell their products to the State at prices set by the State, but rather were allowed to sell them in the free market.
In the Preamble to the 1992 Constitution, it says that “since 1986, our people have carried out a process of all-round reform and renewal initiated by the Sixth party Congress and achieved very important initial accomplishments. The National Assembly has decided to revise the 1980 Constitution so as to meet the exigencies of the new circumstances and tasks." Later on, in 2001, the important amendments related to the free market were enacted, as shown in Article 15:
The State adopts consistent policies on development of a socialist-oriented market economy. The multi-sectoral structure of the economy with diversified types of production ad business organization is based on ownership of the entire people along with collective and private ownership, of which the first two and the second are the cornerstone.
Starting in 2013, the Vietnamese Constitution became assigned the State a hybrid role in the economy. These interactions between the free market and the economy of the socialist State have played a crucial role in modern times. According to Article 51 of its Magna Carta: "1. The Vietnamese economy is a socialist-oriented market economy with multi-forms of ownership and multi-sectors of economic structure; the state economic sector plays the leading role."
On the one hand, the State has a dominant position, but on the other, according to Article 51, Point 3, "The State encourages and provides favorable conditions for entrepreneurs, enterprises, and individuals and other organizations to invest, produce, and do business; contribute to the stable development of the economic sectors and national construction.” In Article 52, the Constitution stipulates: "The State constructs and perfects economic institutions, coordinates the economy on the basis of respecting market values."
In conclusion, both Mexico and Vietnam have undergone political and legal changes since the 1980s. The neoliberal transformation has had an impact in terms of reducing the role of the state, making way for liberalization, privatization, and the opening of the free market, principally. Neoliberalism weakened the State in both countries. We must therefore ask: did neoliberalism also weaken society?
Neoliberalism and the Sociodemographic Transformation
According to national sources, in the case of Mexico, the National Institute for Statistics and Geography (INEGI), the nation was home to 118,395,054 inhabitants (INEGI, 2016) in 2013. According to the General Office for Statistics of Vietnam, by 2013, there were 89,759,500 people living in the country (GSO, 2016). It is worth underscoring that national and international sources differ significantly in their estimates. According to data from the United Nations (Profiles of Aging, 2015), in 2013, Mexico’s population was 127,017,000 inhabitants against 93,448,000 in Vietnam (see Figure 1). In the case of Mexico, the gap is quite wide, nearly 10 million people, while it is 4 million for Vietnam. These are the discrepancies between national and international statistics about the populations of the two countries.

*Years 2030 and 2050 are forecasts.
Source: Created by the author based on Profiles of Aging 2015, United Nations.
Figure 1. The Populations of Mexico and Vietnam According to United Nations Data
In the populations aged 0-14 years and over 60 years, changes can be observed in the shrinking young population and the growth of the group of people aged 60 years or older, as shown in Tables 1 and 2, according to national sources. By the year 2009, the percentage of the population aged 0-14 years had fallen over the past decades, from 36.3 in 1989 to 29.8 in 2010, for Mexico, and from 35 in 1989 to 23.2 in 2009, for Vietnam (see Table 1).
Table 1. Percentage of the Population Aged 0-14 Years in Mexico and Vietnam
| Mexico | 1990 | 2000 | 2010 |
| 0-14 | 36.3 | 33.2 | 29.8 |
| Vietnam | 1989 | 1999 | 2009 |
| 0-14 | 35 | 29.6 | 23.2 |
Source: Created by the author with data from IPUMS. Minnesota Population Center. Minneapolis: University of Minnesota, 2015.
Table 2. Percentage of the Population Aged 60 Years or Older in Mexico and Vietnam
| Mexico | 1990 | 2000 | 2010 |
| 60 and older | 6.1 | 7.1 | 9.2 |
| Vietnam | 1989 | 1999 | 2009 |
| 60 and older | 6.2 | 7.4 | 8.6 |
Source: Created by the author with data from IPUMS. Minnesota Population Center. Minneapolis: University of Minnesota, 2015.
At the same time, the elderly population aged 60 years or older grew in both countries. By 2010, the percentage of the population aged 60 years or older was higher in Mexico (9.2%) than in Vietnam (8.6%), as seen in Table 2.
Table 3 displays how the population aged 0-14 years old and 65 years or older changed based on the United Nations figures. While in 1980, in Mexico, the group aged 0-14 accounted for 45.3% of the population, by 2013 this figure had fallen to 27.6%.
Table 3. Percentage of the Population Aged 0-14 and 65 and Older for Mexico and Vietnam According to United Nations Data
| Age/Year | 1980 | 2013 | 2030* | 2050* |
| 0-14 Mexico | 45.3 | 27.6 | 22.1 | 16.9 |
| 65+ Mexico | 3.2 | 6.5 | 10.4 | 18.9 |
| 0-14 Vietnam | 40.9 | 23.1 | 20.2 | 17.2 |
| 65+ Vietnam | 4.6 | 6.7 | 12.4 | 21 |
*Years 2030 and 2050 are forecasts.
Source: Created by the author based on Profiles of Aging 2015, United Nations.
In Vietnam, similarly, in 1980, the population aged 0-14 represented 40.9%. By 2013, it was 23.1%.
For the population of adults aged 65 or older, Vietnam's statistic was slightly higher than that of Mexico: 3.2% and 4.6% in 1980, for Mexico and Vietnam, respectively, and 6.5% and 6.7% in 2013, respectively.
Figure 2 shows the aging index that represents the number of elderly adults aged 65 years or older for every 100 children or young people; the index is calculated by dividing the number of people aged 65 years or older by the number of people aged 0-14 years.

Source: Created by the author based on Profiles of Aging 2015, United Nations.
Figure 2. Aging Index for Mexico and Vietnam
Both countries have a similar aging index, but by 2013, Vietnam’s was higher. There were 29 adults aged 65 years or older for every 100 children and teens aged 0-14 years. In Mexico, the figure was 23. This is because, as shown in Table 1, the dynamics of the population change in the group aged 0-14 years was much more significant in Vietnam than in Mexico. In Vietnam, the population 0-14 years diminished from 35% in 1989 to 29.6% in 1999 and to 23.2% in 2009. In Mexico, the population 0-14 years fell from 36.3% in 1990 to 33.2% in 2000 and to 29.8% by 2010.
Based on the national censuses conducted in Vietnam (1989, 1999, and 2009) and Mexico (1990, 2000, and 2010), we can see the change in the population dynamics in the two countries (see Figure 3).
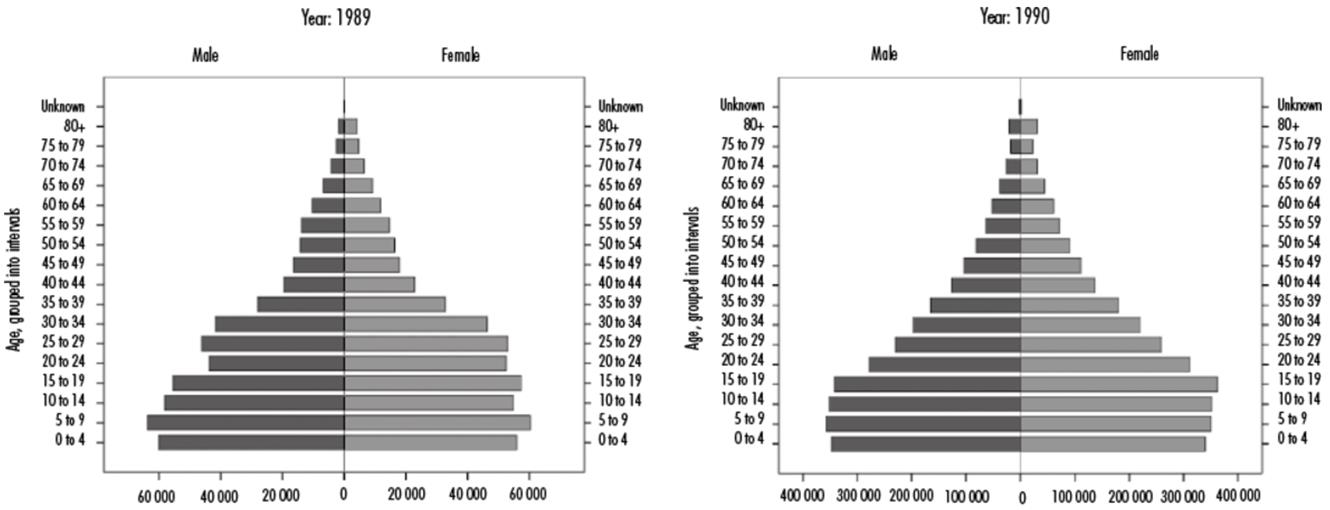
Source: Created by the author based on data from The General Office for Statistics, Vietnam; sample size 1989: 2,626,985. National Institute for Statistics and Geography, Mexico; sample size 1990: 8,118,242. Minnesota Population Center. Minneapolis: University of Minnesota, 2015.
Figure 3. Age Pyramids of Vietnam and Mexico. A) Population pyramid for Vietnam (1989) and Mexico (1990)

Source: Created by the author based on data from The General Office for Statistics, Vietnam; sample size 1999: 2,368,167. National Institute for Statistics and Geography, Mexico; sample size 2000: 10,099,182. Minnesota Population Center. Minneapolis: University of Minnesota, 2015.
Figure 3. Age Pyramids of Vietnam and Mexico. B) Population pyramid for Vietnam (1999) and Mexico (2000)

Source: Created by the author based on data from The General Office for Statistics, Vietnam; sample size 2009: 14,177,590. National Institute for Statistics and Geography, Mexico; sample size 2010: 11,938,402. Minnesota Population Center. Minneapolis: University of Minnesota, 2015.
Figure 3. Age Pyramids of Vietnam and Mexico. C) Population pyramid for Vietnam (2009) and Mexico (2010)
In Vietnam, in 1989, the number of people aged 0-14 years was larger than that of other age groups, but in 1999, there was a large reduction in people aged 0-4 years. In the age pyramid starting in 2009, there are a significant number of people aged 15-29 years. In Mexico, there is a drop in the young population, and the elderly adult population rose. It is worthwhile to note that in both countries, the majority of the population of people aged 60 years or older consists of women.
Based on the United Nations data, Mexico and Vietnam are in a similar position with respect to the percentage of the adult population aged 60 years or older, as shown in Table 4.
Table 4. Classification by Function of Percentage of the Population Aged 60 Years or Older in 2013
| Country | Population 60 Years or Older | Ranking |
| Japan | 32.0 | 1 |
| Italy | 26.9 | 2 |
| Germany | 26.8 | 3 |
| Vietnam | 9.5 | 92 |
| Mexico | 9.3 | 94 |
Source: Created by the author based on United Nations data (2013: 94).
This section concludes by demonstrating that the process of structural change in Vietnamese and Mexican households is the result of multiple social, cultural, and economic transformations. In both countries, the birth rate tended to fall accompanied by a decrease in the number of family members (Long, 2013: 33-34). The populations aged in both countries. According to the study, the Second National Survey Assessment of Vietnamese Youth (SAVY2), in 2009, Vietnamese youth tended to "remain as bachelors as a chosen lifestyle" and display a positive attitude of "single women but have children out of wedlock" (Huu Minh and Thi Hong, 2015: 27). However, these changes came along with polarization and inequalities within population groups, and job precariousness for vulnerable groups, like young people, women, and indigenous people, mainly (Navarrete, 2012).
What Impact Does Neoliberalism Have on Education?
Illiteracy, despite the transformations, is still present and has hardly changed at all in Mexico, as seen in Table 5. The percentage of people who can read and write in Vietnam grew from 81% (1989) to 85.1% (1999) and then 86.9% (2009). In Mexico, the same figure hardly budged, from 78.7% (1990) to 79.7% (2000) and then to 80.5% (2010).
Table 5. Percentage of Illiteracy in Mexico and Vietnam
| Vietnam | Mexico | Vietnam | Mexico | Vietnam | Mexico | |
| 1989 | 1990 | 1999 | 2000 | 2009 | 2010 | |
| Not in the universe | 11.5 | 11.9 | 8.2 | 11 | 8.3 | 9.7 |
| No, illiterate | 7.4 | 9 | 6.6 | 9.1 | 4.7 | 8.8 |
| Yes, reads and writes | 81 | 78.7 | 85.1 | 79.7 | 86.9 | 80.5 |
| Unknown | 0.1 | 0.4 | 0.1 | 0.2 | 0.1 | 0.9 |
Source: Created by the author based on data from IPUMS. Minnesota Population Center. Minneapolis: University of Minnesota, 2015.
Literacy has expanded more in Vietnam than in Mexico. In Vietnam, the number increased by 5.9% between 1989 and 2009; in Mexico, just 1.8% between 1990 and 2010. By 2010, 8.8% of people were illiterate in Mexico, while just 4.7% were in Vietnam in 2009 (see Table 4). Neoliberalism has only made the two countries fall further behind in education. Inter- and intra-generational gaps have continued to grow. In spite of broadening educational coverage, “Mexico is still a society with ample educational inequalities" (Solís, 2015: 90).
Table 6 compares years of schooling in the two countries, highlighting changes in the length of education between 1989/1990 and 2009/2010.
Table 6. Years of Schooling in Vietnam and Mexico
| Vietnam | Mexico | |||||
| 1989 | 1999 | 2009 | 1990 | 2000 | 2010 | |
| None or preschool | 9.6 | 8.3 | 11.5 | 13.1 | 9.9 | 14.1 |
| 1 year | 3.8 | 2.9 | 2 | 3.9 | 4 | 3.5 |
| 2 years | 5 | 4.1 | 3.2 | 5.2 | 4.7 | 4.4 |
| 3 years | 6 | 5.2 | 3.8 | 6.4 | 5.7 | 5.3 |
| 4 years | 5.3 | 5.3 | 4 | 4.8 | 4.1 | 3.6 |
| 5 years | 8.5 | 8.1 | 9 | 4.1 | 3.6 | 3.3 |
| 6 years | 5 | 5.4 | 5.1 | 16.4 | 14.2 | 13.1 |
| 7 years | 5.2 | 6.5 | 5.5 | 3 | 2.9 | 2.7 |
| 8 years | 11.9 | 11.8 | 4.4 | 3.6 | 3.5 | 3.4 |
| 9 years | 5.3 | 6.8 | 12.8 | 13.7 | 13.2 | 15.5 |
| 10 years | 3.6 | 3.6 | 4.2 | 1.8 | 2.2 | 2.2 |
| 11 years | 3.4 | 3.6 | 8 | 2.2 | 2.5 | 2.7 |
| 12 years | 12.4 | 9.1 | 11.6 | 3.2 | 7.2 | 8.5 |
| 13 years | 3 | 1.1 | 0.7 | 1.3 | 1.1 | |
| 14 years | 1.1 | 0.9 | 0.7 | 0.8 | 1 | |
| 15 years | 2.4 | 0.8 | 1.1 | 1.8 | ||
| 16 years | 3.3 | 4.8 | 1.4 | 2.8 | 3.5 | |
| 17 years | 1.8 | 1.4 | 2.3 | 2.3 | ||
| 18 years or more | 0 | 0.1 | 0.6 | 0.9 | 0.5 | 0.9 |
Source: Created by the author based on data from IPUMS. Minnesota Population Center. Minneapolis: University of Minnesota, 2015.
It is worth noting that in both countries, the number of people attending school for more years increased. However, there is also a rise in the number of people with no school education at all or who only attended preschool; this figure is larger in Mexico than in Vietnam; in Vietnam, the percentage of people in this situation amounted to 9.6% in 1989 and 11.5% in 2009; in Mexico, 13.1% in 1990 to 14.1% in 2010.
The percentage of people attending school for 1 to 4 years grew over time. The percentage between 5 and 8 years decreased, in Mexico, and in Vietnam, the percentage of people with 5-7 years of school increased. Years of schooling also increased in Mexico for between 9 and 18 years. Moreover, Vietnam experienced growth of over 100% for 9 years of schooling, from 5.3% in 1989 to 12.8% in 2009. Mexico saw the biggest leap for 12 years, whose percentage jumped from 3.2% in 1990 to 8.5% in 2010.
Analyzing Table 6, there also appears to be a gap among people attending school. On the one hand, the number of people without education or with only preschool education grew in both countries. However, in Mexico, the percentage is higher than in Vietnam. On the other, the percentage of people with more than a decade of schooling rose in both countries. The gaps continue to widen in the neoliberal age.
Finally, after analyzing the impact of neoliberalism on the demographic and educational transition, it is time to address its impact on labor.
Based on the data, available only for 2009 and 2010, in both countries, one-fourth of the population are wage workers, in other words, 25%, as shown in Table 7. Independent or freelance workers in Mexico account for 10.8% of people, with that figure being double in Vietnam. Likewise, there are a lot of people not in this universe altogether. The statistic is higher in Mexico (62.1%) than in Vietnam (49.7%), surely a result of the high informal employment rate in both countries (Hanson, 2010; Lincoln, 2008). Moreover, the labor conditions in both countries are poor and disadvantageous. In Vietnam, "inadequate light, noise, overcrowding, heat, and other deficiencies are frequent. Workers generally work for many hours without rest or safety standards to protect them" (Hong Xoan, 2015: 35). The communist government, to attract foreign investment, "has tried to compete with other nations in the region in terms of offering cheap labor" (Hong Xoan, 2015: 35); in Mexico, the situation is similar, with denigrating labor conditions, especially at the maquiladora factories where workers have low wages and work long hours (Navarrete and Aragón-Durand, 2011).
Table 7. Percentage of the Population by Employment Status
| Mexico | Vietnam | |
| 2010 | 2009 | |
| Not in the universe | 62.1 | 49.7 |
| Independent workers | 10.8 | 19.9 |
| Wage workers | 25.2 | 25.1 |
| Unpaid workers | 1.1 | 5.1 |
| Unknown | 0.8 | 0.1 |
Source: Created by the author based on data from IPUMS. Minnesota Population Center.
Minneapolis: University of Minnesota, 2015.
To conclude, the shrinking size of the population group aged 0-14 years and the growth of the population 60 years old and over is a sign of accelerated aging, which, in turn, is tied to the insufficiencies of the social protection system in Mexico and Vietnam. According to Cristina Gomes: “Between 1990 and 2000, the number of people aged 60 years or older rose from nearly 5 million to 7 million, or from 6% to 7% of the total population of Mexico” (Gomes, 2007: 546). In Mexico, institutional support, like pensions, is scarce. That is the context in which family and solidarity networks, forms of inter-generational support, are so import to support the elderly:
Different generations exchange money, services, gifts, care, and other types of support, according to gender roles. Men reproduce their role as economic provider and give monetary resources to family members. Having money depends on having a salary, and this is twice as frequent among men of advanced age then women of advanced age, and double the number of men receive a pension as women. Those who are at an economic disadvantage, therefore, would be “dependent” on relatives (Gomes, 2007: 552).
The authors of a study with a nationally representative sample of 2,376 men aged 60 years or older in 1994 reached the same conclusion: “three-quarters of the men surveyed received in-kind, domestic, financial, or physical assistance in the month previous to the 1994 survey” (De Vos et al., 2004: 23). Informal help is extended in families that “have developed complex networks of informal support, which, beyond economic transfers or remittances, also includes donations, gifts, and services exchanged among relatives and friends" (Gomes, 2007: 558).
In Vietnam, as in Mexico, the protection system is very limited and is characterized by: “1) fragmented administration with various ministries, departments, and organizations providing the protection; 2) coverage limited to a small proportion of the public sector; and 3) centered primarily on the priorities of state employees and civil servants” (Nguyen Anh, 2014: 10). Accordingly, informal aid is more important, and family support networks emerge. Nguyen Anh (2014: 11) underscored that "social security coverage and the pension system are restricted, in the majority of cases, to a small proportion of public sector or formal employees."
Analyzing the impact of neoliberalism on sociodemographics, education, and labor, it is worth noting that vulnerable groups suffer even more from exclusion and precarious conditions. This topic will be dealt with in the next section
Neoliberalism and Indigenous People
In neoliberalism, the competitive forces of the market exclude vulnerable groups, because the State does not act as a regulatory force. Is this perhaps happening with the indigenous people in the two countries?
Mexico, just like the Socialist Republic of Vietnam, is home to a considerable number of indigenous groups, between 50 and 60 (see Table 9). Sociodemographic changes in Mexican and Vietnamese households turn out to be of a different nature within population groups. Indigenous people in both countries are at a greater disadvantage and suffer from more severe structural precariousness. It is worthwhile noting that in Mexico, indigenous groups are distinguished by language, while in Vietnam, by ethnicity.
Table 9. Percentages of the Indigenous Population in Vietnam (2009) and Mexico (2010)
| Vietnam | Mexico | ||||
| Frequency | Percentage | Frequency | Percentage | ||
| Kinh | 5 266 124 | 96.72 | Just Spanish | 8 794 833 | 73.7 |
| Hoa | 44 182 | 0.81 | Náhuatl | 441 765 | 3.7 |
| Tay | 43 251 | 0.79 | Mixteco | 259 305 | 2.2 |
| Kho Me | 19 127 | 0.35 | Tzotzil | 240 013 | 2.0 |
| Nung | 18 548 | 0.34 | Zapoteco | 232 676 | 1.9 |
| Thai | 16 433 | 0.30 | Maya | 198 414 | 1.7 |
| Muong | 7 665 | 0.14 | Tzeltal | 194 316 | 1.6 |
| Dao | 4 073 | 0.07 | Mazateco | 108 170 | 0.9 |
| Gia Rai | 3 660 | 0.07 | Totonaca | 102 495 | 0.9 |
| Ra Na | 3 568 | 0.07 | Tlapaneco | 96 130 | 0.8 |
| Hmong | 3 016 | 0.06 | Mixe | 59 755 | 0.5 |
| E De | 2 140 | 0.04 | Chol | 47 156 | 0.4 |
| Xu Dang | 1 934 | 0.04 | Chinanteco | 40 405 | 0.3 |
| Hre | 1 566 | 0.03 | Otomí | 37 721 | 0.3 |
| Cham | 1 360 | 0.02 | Zoque | 35 009 | 0.3 |
| San Diu | 1 192 | 0.02 | Chatino | 34 677 | 0.3 |
| Unknown | 945 | 0.02 | Amuzgo | 32 007 | 0.3 |
| Co Tu | 834 | 0.02 | Popoluca | 25 854 | 0.2 |
| San Chay | 701 | 0.01 | Huasteco | 24 475 | 0.2 |
| Giay | 693 | 0.01 | Tepehuano | 22 788 | 0.2 |
| Co Ho | 541 | 0.01 | Huichol | 22 550 | 0.2 |
| Gie Trieng | 474 | 0.01 | Purépecha | 17 765 | 0.1 |
| Ha Nhi | 392 | 0.01 | Cora | 17 223 | 0.1 |
| Bru-Van Kieu | 379 | 0.01 | Tarahumara | 13 140 | 0.1 |
| Tho | 280 | 0.01 | Cuicateco | 10 415 | 0.1 |
| Raglai | 255 | 0.00 | Mazahua | 8 224 | 0.1 |
| 241 | 0.00 | Triqui | 6 545 | 0.1 | |
| Mnong | 229 | 0.00 | Huave | 5 154 | 0.0 |
| Ma | 190 | 0.00 | Tojolabal | 4 370 | 0.0 |
| Xtieng | 184 | 0.00 | Mayo | 2 991 | 0.0 |
| Ta Oi | 180 | 0.00 | Popoloca | 2 717 | 0.0 |
| Co | 125 | 0.00 | Chontal de Oaxaca | 2 094 | 0.0 |
| Kho mu | 68 | 0.00 | Pame | 2 000 | 0.0 |
| Ngai | 53 | 0.00 | Tepehua | 1 685 | 0.0 |
| Lao | 41 | 0.00 | Chontal de Tabasco | 1 405 | 0.0 |
| La Chi | 41 | 0.00 | Mame | 1 302 | 0.0 |
| Phu La | 28 | 0.00 | Yaqui | 1 168 | 0.0 |
| Cho Ro | 26 | 0.00 | Sayulteco | 643 | 0.0 |
| La Hu | 23 | 0.00 | Kanjobal | 589 | 0.0 |
| Cong | 20 | 0.00 | Guarijio | 559 | 0.0 |
| Lo Lo | 19 | 0.00 | Chocho | 463 | 0.0 |
| Chu Ru | 18 | 0.00 | Pima | 356 | 0.0 |
| Lu | 15 | 0.00 | Aguacateco | 156 | 0.0 |
| Si La | 13 | 0.00 | Chichimeca Jonaz | 124 | 0.0 |
| Mang | 9 | 0.00 | Jacalteco | 112 | 0.0 |
| Bo Y | 9 | 0.00 | Ocuilteco | 104 | 0.0 |
| Khang | 8 | 0.00 | Chontal | 88 | 0.0 |
| Ro Man | 8 | 0.00 | Quiche | 75 | 0.0 |
| Chut | 5 | 0.00 | Kekchi | 64 | 0.0 |
| Xinh Mum | 4 | 0.00 | Ixcateco | 45 | 0.0 |
| La Ha | 2 | 0.00 | Kumiai | 42 | 0.0 |
| Co Lao | 1 | 0.00 | Texistepequeño | 42 | 0.0 |
| Brau | 1 | 0.00 | Teco | 34 | 0.0 |
| Other | 325 695 | 5.98 | Cucapa | 32 | 0.0 |
| Total | 5 444 894 | Matlatzinca | 30 | 0.0 | |
| Chuj | 30 | 0.0 | |||
| Papago | 26 | 0.0 | |||
| Kaqchikel | 19 | 0.0 | |||
| Motocintleco | 13 | 0.0 | |||
| Seri | 12 | 0.0 | |||
| Oluteco | 12 | 0.0 | |||
| Kiliwa | 5 | 0.0 | |||
| Kikapu | 4 | 0.0 | |||
| Pai-Pai | 2 | 0.0 | |||
| Ixil | 2 | 0.0 | |||
| Lacandón | 1 | 0.0 | |||
| Other | 16 917 | 0.1 | |||
| Total non-Spanish speaking population | 2 374 480 | 19.6 | |||
Source: Created by the author based on data from IPUMS. Minnesota Population Center. Minneapolis: University of Minnesota, 2015.
The Kinh (Viet) account for 80% to 90% of the total indigenous population. The ten largest indigenous groups in Vietnam are: Hoa (0.81%), Tay (0.79%), Kho Me (0.35%), Nung (0.34%), Thai (0.30%), Muong (0.14%), Dao (0.07%), Gia Rai (0.07%), Ra Na (0.07%), and Hmong (0.06%). In Mexico: náhuatl (3.7%), mixteco (2.2%), tzotzil (2.0%), zapoteco (1.9%), maya (1.7%), tzeltal (1.6%), mazateco (0.9%), totonaca (0.9%), tlapaneco (0.8%), and mixe (0.5%) (as shown in Table 9).
In Vietnam, the 2009 census revealed that household size varies among the six largest ethnic groups; the Kinh have the fewest number of household members, with an average of 4.3 people, while the Hmong group has the highest number, with 5.3 people per household (Long, 2013: 25).
The two countries are similar in terms of the size of the indigenous population. The percentage of people belonging to ethnic groups is hard to estimate: in Vietnam, unofficial sources place the figure at between 10% and 15% (Czarnecki, 2011: 200). As of 2009, official data stated that the Kinh people accounted for 91.3%. The rest, around 9%, were various ethnic minorities (see Table 9).
In Mexico, the percentage of the population that only speaks Spanish and no indigenous language fell from 80.9% in 1990 to 73.7% in 2010, as shown in Table 8. The percentage of people who speak at least one indigenous language and Spanish nearly tripled from 5.2% in 1990 to 14.4% in 2010; at the same time, the percentage of the population speaking only an indigenous language also grew, from 1% in 1990 to 5.2% in 2010.
Table 8. Percentage of the Population Speaking an Indigenous Language, Mexico 2010
| 1990 | 2000 | 2010 | |
| Not in the universe | 12.6 | 11.6 | 6.1 |
| Yes, speaks an indigenous language and Spanish | 5.2 | 8.2 | 14.4 |
| Yes, speaks only an indigenous language | 1.0 | 2.1 | 5.2 |
| No, does not speak an indigenous language | 80.9 | 77.8 | 73.7 |
| Unknown | 0.3 | 0.3 | 0.3 |
| Total | 100 | 100 | 100 |
Source: Created by the author based on data from IPUMS. Minnesota Population Center. Minneapolis: University of Minnesota, 2015.
According to data from the National Council for Social Development Policy Assessment (CONEVAL), the 10% of the population surveyed in the census as of indigenous origin (10.8 million) in 2000 rose to 16% (18.1 million) in 2010 (CONEVAL, 2014: 14). The council wrote that "in Mexico, the condition of belonging to an original ethnicity group of peoples constitutes not only a factor of differentiation, but also of exclusion” (CONEVAL, 2014: 120), where “pursuant to practically any methodological approach, people with some feature of ethnic belonging are in a more precarious situation than people who do not. They are poor among the poor” (CONEVAL, 2014: 144). The State does not create egalitarian public policies.
In Vietnam, similar to in Mexico, indigenous groups are treated as “behind,” as is the case of the Hmong (Turner and Michaud, 2008: 160). According to World Bank experts, ethnic inequalities in Vietnam originate in “minimal access to the market economy,” among other factors (Van de Walle and Gunewardena, 2011: 203). However, it is the structures of transnational capital and international financial groups, the modus operandi of the national State, which exclude vulnerable groups. In response to exclusion, indigenous people adapt through survival strategies and reinvent themselves, seizing on opportunities whenever they arise and not due to rational choice or economic benefit (Turner and Michaud, 2008). Such is the case of Chuy, a 37-year-old Hmong woman, from Hau Thao, a town 15 kilometers away from Sa Pa, the capital of the province of Lao Cai: "Neither the government nor private enterprise contributes in any way to the ethnic communities.”1 Ms. Chuy began to work as a freelance tour guide to meet her family’s needs.
In conclusion, indigenous people are in disadvantageous situations facing structural precariousness in both countries. In spite of that, their numbers are growing and they are continuing to pass down their indigenous languages to future generations. Moreover, indigenous people are undertaking strategies to adapt to scenarios in which they are excluded.
Final Reflections
This paper was primarily concerned with comparing Mexico and the Socialist Republic of Vietnam and the role of neoliberalism in their political and sociodemographic transitions. As shown here, the impact of neoliberalism on the political transformation in both countries only further weakened the State. The constitutional reforms in the two countries were designed as a function of the free market and transnational capital. The first part of this paper analyzed constitutional changes, and the second part drew on national and international sources of population data. It is worth noting that the national sources were different from the international sources in terms of the population data in the two countries. To prevent bias, the main source used were the national census data from 1989, 1999, and 2009 in Vietnam, and 1990, 2000, and 2010 in Mexico.
Both similarities and differences were found, in spite of the fact that the two countries underwent a similar transformation from a closed economy to a free market economy in the 1980s. First, the young population fell in both countries, while the group of people aged 60 and over grew. In Vietnam, the population decrease in people aged 0-14 was more dramatic. Thus, the aging rate in Vietnam was higher than in Mexico.
Illiteracy continued in both nations practically unchanged. In Mexico, by 2010, 8.8% of people were recorded as illiterate; in 2009, in Vietnam, this figure was 4.7%. In terms of the changing percentage of people with different years of schooling, the gap between people with more and less years of education widened. In Mexico, the percentage was higher than in Vietnam. On the other hand, the percentage of people with more than ten years of schooling rose. Moreover, in the neoliberal age, the number of people with informal employment grew.
Finally, indigenous people suffered from exclusion and more severe inequality, health problems, and lack of education, insofar as the neoliberal State failed to create public policies to promote equality and opportunity.
The common denominator consisted of the negatives that accompanied the sociodemographic changes that took place in the decades of neoliberalism, such as social exclusion, inequalities, labor precariousness, and widening gaps between population groups, with an even wider gap for the indigenous people. Quod erat demonstrandum.
The challenge for future research will reside in studying and analyzing the survival and adaptation strategies of groups vulnerable to permanent structures of exclusion.
REFERENCES
Bassols Batalla, Ángel (1981), La República Socialista de Vietnam (con un apéndice sobre la revolución en Laos y la situación en Kampuchea), México, Universidad Nacional Autónoma de México, Instituto de Investigaciones Económicas, pp. 100. [ Links ]
Consejo Nacional de Evaluación de la Política de Desarrollo Social (CONEVAL) (2014), La pobreza en la población indígena de México 2012, México, CONEVAL, pp. 156. [ Links ]
Constitutions of Viet Nam: 1946, 1959, 1980, 1992, 2013 (2015), Hanoi, The Gioi Publishers, pp. 289. [ Links ]
Constitución Política de los Estados Unidos Mexicanos 1917, México, Cámara de Diputados (consultado el 1 de abril 2016), disponible en <Constitución Política de los Estados Unidos Mexicanos 1917, México, Cámara de Diputados (consultado el 1 de abril 2016), disponible en http://www.diputados.gob.mx/LeyesBiblio/htm/1.htm > [ Links ]
Czarnecki, Lukasz (2011), “Olvidados por los olvidados. H’mong en Vietnam y la cuestión mexicana entorno de la metodología etnográfica de Nguyen Tu Chi”, Estudios de Asia y África, vol. XLVI, núm. 144 (1), México, El Colegio de México, pp. 195-221. [ Links ]
D. D. (2005), “Nueva edición del Diario de Debates del Congreso Constituyente de 1916-1917”, en Ignacio Marván, Poder Judicial de la Federación, Introducción y notas, tres volúmenes, México . [ Links ]
De Vos, Susan, Patricio Solís y Verónica Motes de Oca (2004), “Receipt of Assistance and Extended Family Residence Among Elderly Men in Mexico”, International Journal Aging and Human Development, vol. 58(1), pp. 1-27. [ Links ]
General Statistics Office of Vietnam (GSO) (2016), Area, Population and Population Density by Province, Hanoi, General Statistics Office of Vietnam (consultado el 10 de abril 2016), disponible en <General Statistics Office of Vietnam (GSO) (2016), Area, Population and Population Density by Province, Hanoi, General Statistics Office of Vietnam (consultado el 10 de abril 2016), disponible en https://www.gso.gov.vn/default_en.aspx?tabid=774 > [ Links ]
Gomes, Cristina (2007), “Intergenerational Exchanges in Mexico. Types and Intensity of Support”, Current Sociology, vol. 55(4), julio, pp. 545-560. [ Links ]
Hanson, Gordon (2010), “Why isn’t Mexico Rich”, Journal of Economic Literature, vol. 48, núm. 4, December, pp. 987-1004. [ Links ]
Hong Hoan, Nguyen (2015), “Economic Adjustment and Living Conditions of Young Migrants in Ho Chi Minh City”, Vietnam Journal of Family and Gender Studies, vol. 10, núm. 1, pp. 29-56. [ Links ]
Huu Minh, Nguyen y Thi Hong Tran (2015), “Attitudes of Vietnamese Youth toward Marriage and Family Issues”, Vietnam Journal of Family and Gender Studies, vol. 10, núm. 1, pp. 15-29. [ Links ]
Instituto Nacional de Estadística y Geografía (INEGI) (2016), México en cifras. Número de personas 2013, México (consultado el 15 de abril de 2016), disponible en < Número de personas 2013, México (consultado el 15 de abril de 2016), disponible en http://www3.inegi.org.mx/sistemas/mexicocifras/default.aspx > [ Links ]
Lincoln, Martha (2008), “Report from the Field: Street Vendors and the Informal Sector in Hanoi”, Dialectical Anthropology, vol. 32, núm. 3, pp. 261-265. [ Links ]
Long, Tran Quy (2013), “Structural Changes within Vietnamese Household and their Correlations with Demographic and Social Elements”, Vietnam Journal of Family and Gender Studies, vol. 8, núm. 2, pp. 24-39. [ Links ]
My Hanh, Nguyen Thi (2016), “Investiture Beseeching in Vietnam-China Diplomatic Relationship in Feudal Age”, Asian Culture and History, vol. 8, núm. 1, pp. 17-27. [ Links ]
Naciones Unidas (2013), World Population Ageing, New York, Department of Economic and Social Affairs, Population Division, UN. [ Links ]
Navarrete, Emma Liliana (2012), “Jóvenes universitarios mexicanos ante el trabajo”, Revista Latinoamericana de Población, vol. 6, núm. 10, enero-junio, pp. 119-140. [ Links ]
Navarrete, J. Manuel y Fernando Aragón-Durand (2011), “Garment Maquiladoras in the South: A Closer Look at the Mayan Maquiladora Workforce”, Latin American Perspectives, vol. 38, núm. 5, pp. 93-109. [ Links ]
Nguyen Anh, Dang (2014), “Social Protection in Vietnam: Issues, Challenges and Prospects”, Vietnam Journal of Family and Gender Studies, Institute for Family and Gender Studies, Vietnam Academy of Social Science, vol. 9, pp. 3-15. [ Links ]
Nguyen Dac, Simone, A. y Mariela Álvarez (1991), “Analogías y diferencias en el desarrollo agrícola de dos regiones tropicales: Los Altos de Chiapas (México) y Nghe-Tinh (Trung-Bo, Vietnam)”, Estudios de Asia y África, vol. 26, núm. 1 (84), pp. 112-138. [ Links ]
Profiles of Ageing (2015), disponible en https://esa.un.org/unpd/popdev/Profilesofageing2015/index.html [ Links ]
Smith, Clint E. (2000), Inevitable Partnership. Understanding Mexico-U.S. Relations, London, Lynne Rienner Publushers. [ Links ]
Solís, Patricio (2015), “Desigualdad vertical y horizontal en las transiciones educativas en México”, en Roberto Vélez Grajales, Juan Enrique Huerta Wong y Raymundo M. Campos Vázquez (eds.), México, ¿el motor inmóvil?, México, Centro de Estudios Espinosa Yglesias, A.C., pp. 47-95. [ Links ]
Turner, Sara y Jean Michaud (2008), “Imaginative and Adaptive Economic Strategies for Hmong Livelihoods in Lào Cai Province, Northern Vietnam”, Journal of Vietnamese Studies, vol. 3, núm. 3, pp. 158-90. [ Links ]
Van de Walle, Dominique y D. Gunewardena (2011), “Sources of Ethnic Inequality in Viet Nam”, Journal of Development Economics, vol. 65, núm. 1, pp. 177-207. [ Links ]
Xuan Nam, Pham (2001), Rural Development in Vietnam, Hanoi, Social Science Publishing House, pp. 248. [ Links ]
Received: May 05, 2016; Accepted: August 26, 2016
 Este es un artículo publicado en acceso abierto bajo una licencia Creative Commons
