


Serviços Personalizados
Journal
Artigo
 texto em
  Inglês (pdf)
 Artigo em XML
 Referências do artigo
 Enviar este artigo por email
Indicadores
-
 Citado por SciELO
 -
 Acessos
Links relacionados
-
 Similares em
SciELO
Similares em
SciELO
Compartilhar

 Permalink
Problemas del desarrollo
versão impressa ISSN 0301-7036
Prob. Des vol.47 no.187 Ciudad de México Out./Dez. 2016
Articles
Wage inequality and technological change along the Northern Border of Mexico
1Center for Research on Food and Development, A.C. Mexico, and Faculty of International Economics, Autonomous University of Chihuahua, Mexico, respectively. E-mail addresses: lhuesca@ciad.mx and gochoa@uach.mx, respectively.
This paper explains the behavior of wage inequality in Mexico and the corresponding region along the northern border in the time period 2005-2012. We use a traditional and easy-to-interpret coefficient, the Gini index, which is accurately decomposed using a cooperative game approach, to obtain the causes behind its gradual decline, as the index fell from 0.435 to 0.400 by 2012. The results show that it is within groups—by 70%—that the wage gap has been reduced by type of task in the job position for the border region and by skills for the country.
Key Words: Wage inequality; labor market; Gini index; technological change; northern border
El artículo explica el comportamiento de la desigualdad salarial de México y su región correspondiente a la Frontera Norte durante el periodo 2005-2012. Se empleó un índice tradicional y de fácil interpretación, el coeficiente de Gini, mismo que es descompuesto de manera exacta mediante un enfoque de juegos cooperativos y mediante el cual se obtienen las causas de su gradual reducción misma que pasó de ser de 0.435 a 0.400 para el año 2012. Los resultados muestran que es al interior de los grupos –en un 70%– que ha permitido reducir las distancias de los salarios por tipo de tareas en el puesto de trabajo para la frontera y por habilidades para el país.
Palabras clave: desigualdad salarial; mercado laboral; coeficiente de Gini; cambio tecnológico; Frontera Norte
L’article explique l’évolution de l’inégalité salariale du Mexique et de sa région correspondant à la frontière nord au cours de la période 2005-2012. Il y est employé un indice traditionnel et facile à interpréter du coefficient Gini, lequel est décomposé de manière exacte en adoptant une perspective de jeux coopératifs à travers laquelle on parvient aux causes de sa progressive réduction, puisqu’il est passé de 0.435 à 0.400 pour l’année 2012. Les résultats montrent que c’est au sein des groupes – à hauteur de 70% – qu’il a permis de réduire les écarts de salaires pour le type de tâche sur le poste de travail en ce qui concerne la frontière, et selon les habiletés dans le pays.
Mots clés: inégalité salariale; marché du travail; coefficient de Gini; changement tech nologique; frontière nord
O artigo explica o comportamento da desigualdade salarial do México e sua região que corresponde à Fronteira Norte durante o período de 2005-2012. Para tanto, se usou um índice tradicional e de fácil interpretação como o de Gini, mesmo que é decomposto de maneira exata através de um enfoque de jogos cooperativos e no qual se encontram as causas da sua gradual redução, que passou de 0.435 a 0.400 para o ano de 2012. Os resultados mostram que é no interior dos grupos – num 70% – que permitiu reduzir as distâncias dos salários por tipo de tarefas no posto de trabalho, para a fronteira, e por habilidades, para o país.
Palavras-chave: desigualdade salarial; mercado laboral; coeficiente de Gini; câmbio tecnológico; fronteira norte
本文分析墨西哥北部边境地区2005-2012年间的工资不平等现象。我们使用传统的易于阐释的基尼系数, 通过合作博弈指数准确分解来得到这一系数2012年从0.435逐渐下降到0.400的原因。分析结果显示就北部边境地区而言, 在不同工作类型中可因工所任务的差别而缩小工资差距 (占70%), 就全国而言, 可因工作熟练程度的不同而缩小工资差距。
关键词: 工资不平等; 劳动力市场; 基尼系数; 技术变革; 北部边境
INTRODUCTION
The most recent phase of global economic development has been defined by an economic sector that revolves around information technologies with a series of policies designed to compete in the international market. Over the past couple of decades, the process of technological change has prompted companies to move towards hiring individuals with better skills and capacities, in pursuit of higher profits and production efficiency.
It is useful to note that since the advent of the Industrial Revolution, labor has been gradually supplanted by machinery. More recently, the constant onslaught of international competition has driven companies to acquire new tools to make their productive processes more efficient. Because these technologies require employees to possess specific skills, this replacement process has become quite apparent.
An analysis of technology development and its effect on the labor market suggests that the greater productivity derived from using technological innovations spurs demand for workers with greater capacities (skilled individuals), which in turn leads to higher wages. Said technological progress has typically been analyzed based on worker skills. Pursuant to Acemoglu and Autor (2011), one way to measure labor performance is by observing the relative wages of skilled and unskilled persons. Using this method, researchers have observed a bias whereby the use of technology favors skilled labor and is detrimental to less-skilled labor, which in turn entails wage inequality.
Recently, the newer literature has argued that the changes in the allocation of workplaces or "tasks" between capital and labor, or between national and foreign workers, have altered the structure of labor demand in industrialized countries, polarizing employment. As described in Autor (2013), the "task approach" applied to labor markets could be a promising way to adjust the conceptual tools researchers use to study the forces involved in these markets.
It is within this analytical framework that this paper was developed, aiming to analyze the behavior of wage inequality among different groups of occupations in the region of the Northern Border of Mexico (NBM) in 2005-2012. To do so, this paper is structured as follows: first, a literature review of technology changes in the labor market and the wage inequalities derived therein, as well as a brief description of the issues facing the Mexican labor market. Second, the situation of the labor market along the NBM and wage inequality in this region as explained by technological change. Third, the methodology used for the precise decomposition of the Gini index to measure inequality, followed by the results obtained. Finally, relevant conclusions.
TECHNOLOGICAL CHANGE, THE LABOR MARKET, AND WAGE INEQUALITY
According to the Skill-Biased Technological Change Hypothesis (SBTCH), when a technology is introduced in the labor market, it gives rise to an increase in demand for employees with more skills, which leads to a bias in favor of skilled workers, to the detriment of unskilled workers, exacerbating wage inequality. This hypothesis approaches technological change through the use of computer equipment, mainly due to the expanding role of this tool in the workplace.
Pursuant to the SBTCH approach, one of the potential responses to the origin of wage inequality is changing demand, derived from technological change and biased to the benefit of more skilled workers.
This phenomenon has been proven in developed countries by various researchers over the past few decades (Autor, Katz, and Kearney, 2008; Acemoglu et al., 2011), and multiple research studies have asserted that introducing technologies into labor generates demand for more skilled workers, or at least requires that the tasks that workers carry out complement these technologies, leading to wage raises. In this context, education is of vital importance, because level of schooling determines access to using new technologies.
In developing countries, like Mexico, it has been observed that after the North American Free Trade Agreement (NAFTA) was signed, foreign direct investment began to shift, and the maquiladora scheme implemented during the economic restructuring allowed transnational companies to take root in the country, incorporating new technologies into productive processes, and producing an impact on the demand for labor and wages (Hanson, 2003).
These changes in the Mexican economy have motivated various researchers to analyze the changing wage structure and composition of employment. One of the most common ways of studying the impact of technological change on the labor market is to analyze changes in labor and wage implications facing workers depending on their skills. This is precisely how we set out to explain changing wage inequality in this research paper.
WAGE INEQUALITY IN MEXICO
In the 1980s, wage disparities in Mexico widened, mainly as a result of the following reasons: 1) changes in demand: globalization and greater competition for labor-intensive goods, technological change, and demand biased in favor of specialized labor; 2) changes in supply: more women and youth joined the workforce; and 3) institutional changes in the labor market: the deregulation of the minimum wage and the declining role of unions (Castro and Huesca, 2007).
In addition, Esquivel and Rodríguez (2003) analyzed the period before and after NAFTA, and demonstrated that throughout 1988-2000, the wage gap between skilled and unskilled workers in Mexico rose by around 27%.
Later, Campos, Esquivel and Lustig (2014) studied wage inequality in Mexico from 1989 to 2010, and found two distinct behaviors in the time period. The first occurred from 1989 until mid-1990, when the Gini coefficient rose from 0.548 to 0.571. The second change took place in the mid-1990s up until 2010, when the Gini coefficient fell to 0.510. The authors assert that one of the possible causes behind the reduced wage inequality was an over-supply of qualified workers.
Moreover, Lustig, López, and Ortiz (2013) addressed inequality in Latin America, and the specific cases of Mexico, Argentina, and Brazil. In Mexico, the authors looked in particular at the disparity in labor income and saw a reduction, concluding that this was mainly due to the falling wage premium for skilled workers, which can also be attributed to changes in the makeup of supply and demand, as well as institutional factors.
Another study conducted by Huesca and Rodríguez (2008) demonstrated that in Mexico, inequality began to level off in the beginning of 2000, accompanied by falling wages for the group of skilled workers. In the case of the NBM, this same study showed that wages underwent homogenization, with a greater weight given to unskilled labor, evidence that sits in sharp contrast with the trend towards new production techniques that could make more intensive use of skilled labor, and which, apparently, seems not to have materialized in recent years.
Pursuant to the evidence presented, wage inequality in Mexico has displayed different patterns, which can be attributed to the changes in the labor supply and the possibility of biased technological change. Accordingly, it is worthwhile to examine the decomposition of wage inequality to learn more about each of the factors that contributes to said disparity.
THE MEXICAN LABOR MARKET
As mentioned earlier, the productive structure of the Mexican economy has undergone changes, and even when the number of opportunities has risen as a result of greater trade flows, employment indicators, according to Mendoza (2010), have revealed that the labor market is unable to absorb the labor demand generated. As such, employment, underemployment, and migration to the United States are all relevant aspects of the nature of the Mexican labor market.
The labor market in Mexico also displays recurring phenomena, such as the rise in informal employment, growing flows of Mexican workers emigrating to the United States, and a rise in the dynamics of industrial and manufacturing activities.
Similarly, Castro (2007), who conducted an analysis of the wage gap from 1992 to 2002, asserted that the Mexican labor market has not generated the jobs required for a labor supply that is constantly growing.
As such, the case of Mexico is contradictory to the theory that states that higher levels of schooling lead to greater wage returns. One example of this is the rise in the number of students enrolled in university, which in turn drives up the unemployment rates for groups with higher levels of education. The main fallout from this includes employment in jobs that require little specialization, informality, and low wages.
Another piece of evidence that contributes to this explanation is shown in Figure 1, which presents wages from 2005 to 2012 for skilled (more than 12 years of schooling) and unskilled workers (less than 12 years of schooling), where a drastic drop in average wage compensation is observable for people with higher levels of education.

Source: Created by the authors based on data from ENOE.
Figure 1. Average Wages by Skill Level in Mexico 2005-2012
The evidence shown here reveals how over the past decades, imbalances in the Mexican labor market have made it impossible for workers to reach their full potential. Even with the advent of increasingly technological productive processes tied to the skills that these employees have, wages have not reflected these abilities.
THE CASE OF THE NORTHERN BORDER OF MEXICO
A specific study of the Northern Border of Mexico (NBM) is essential to understanding the advent of technological change and its implications when it comes to wages, because it is one of the regions in the country characterized by advanced economic development, as compared to the southern border and even to some cities in the center of Mexico. Ayala, Chapa, and Hernández (2009) explained that states in the north have an industrial vocation because the manufacturing industry determines regional economic activity in the region’s dynamics. Its momentum is a result of its proximity to the United States, which in turn produces multiplicative effects in the services sector. Table 1 shows how the employed population was distributed by branch of economic activity between 2005 and 2012, and also presents the average annual growth rate during this time. We can also observe how the highest growth areas are tied to the services sector, as well as the extractive and electricity industries. The only sector with negative growth is the construction industry, which, since the real estate crisis in 2008 and 2009 in the United States, has experienced serious problems. The most dynamic sectors are those tied to the transformation industry, as well as professional and financial services and the trade sector, the latter two of which are known for a good deal of informal employment.
In Mexico informal employment is one of the features of the labor market. This phenomenon has taken off in the past decade. As such, in this research paper this quality is considered to have an impact on estimating wage inequality.
Table 1. EAP by Branch of Economic Activity and Average Growth Rate of Each Sector in the Northern Border of Mexico, 2005 and 2012
| Branch of Economic Activity | 2005 | 2012 | Growth Rate | ||
| Total | % | Total | % | ||
| Extractive and electricity industries | 82 511 | 1.2 | 112 510 | 1.4 | 4.53 |
| Transformation industry | 1 658 289 | 24.0 | 1 772 459 | 22.0 | 0.96 |
| Construction | 671 802 | 9.8 | 643 519 | 8.1 | -0.61 |
| Trade | 1 463 048 | 21.0 | 1 729 576 | 22.0 | 2.42 |
| Restaurants and lodging services | 438 323 | 6.4 | 550 575 | 6.9 | 3.31 |
| Transportation, communication, postal service, and storage | 381 185 | 5.6 | 427 396 | 5.1 | 1.65 |
| Professional, financial, and corporate services | 1 162 330 | 17.0 | 1 480 117 | 19.0 | 3.51 |
| Miscellaneous services | 692 964 | 10.4 | 913 983 | 11.0 | 4.03 |
| Government and international organizations | 314 609 | 4.6 | 360 055 | 4.5 | 1.95 |
| Total | 6 865 061 | 100.0 | 7 990 191 | 100.0 | 2.19 |
Source: Created by the authors based on data from ENOE, respective years.
As a general overview of the trends of informality in the NBM and in Mexico, Figure 2 shows the employment rates in the informal sector in the years 2005 and 2012. It appears that the values in both entities are higher in the year 2012. The highest rates of participation in this sector are found in the state of Tamaulipas, and the national average is higher than the NBM average.

METHODOLOGY FOR THE PRECISE DECOMPOSITION OF WAGES USING THE GINI INDEX
For the empirical portion of this study, we have used the Gini index,2 thanks to its generous interpretation. This index enables us to easily understand inequality levels because it is restricted to values ranging between zero and one (zero meaning no inequality and one being the maximum value). Moreover, it’s decomposition is a novel estimate because it can be done with precision. To decompose the Gini index, we proceed with the methodology originally set forth in Shorrocks (2013), which allows us to conduct an exact decomposition (in other words with no residuals or random components) of any inequality index using the Shapley (1954) theoretical approach. The particular nature of this technique is that the decomposition is always “exact,” and the subgroups considered can be treated symmetrically (Shorrocks, 2013: 20; Kolenikov and Shorrocks, 2005). Some of the applications in which this technique has been used worldwide include analyzing poverty and inequality in Russia (Kolenikov and Shorrocks, 2005), in China (Wan, Lu, and Chen, 2007; Wan, 2002; Wan and Zhou, 2005), and in Cameroon (Abdelkrim, 2006). In the case of Mexico, it has been applied in works by Ochoa, Huesca, and Calderón (2015) and Rodríguez, Huesca, and Camberos (2011) in different categories of labor.
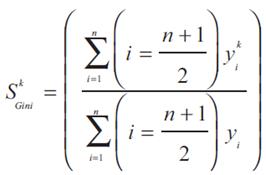
We begin by considering the Morduch and Sicular (2002) Gini index equation, which is used to order the incomes of workers as y 1 ≤ y 2 ≤ ‧‧‧ ≤ y i , and is written as follows:
 (1)
(1)
The decomposition is calculated as the value of inequality for each subgroup k of workers as follows:
 (2)
(2)
Where S represents the subgroup limited to size S∈ {0, 1, …,n – 1}. Each subgroup of workers contributes a ranking to wage i for  , over the total in the distribution for y
i
. Then, the term MV(𝜎
i
(w), k) is obtained, which refers to the marginal value of adding a worker k to its group.3
, over the total in the distribution for y
i
. Then, the term MV(𝜎
i
(w), k) is obtained, which refers to the marginal value of adding a worker k to its group.3
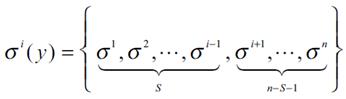
In this way, the workers are randomly ordered by their income dispersion (y) using the symbol 𝜎 i (y), as follows:
 (3)
(3)
As such, it is feasible to write the general formula for Shapley's (1954) value as the i-th possible order of subgroups, as follows:
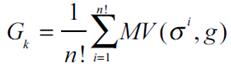 (4)
(4)
The term MV(𝜎 i , 𝑔) indicates the effect present in the estimation when group g is eliminated for order σ i in the contribution of the set of groups S. For the case of six groups (our exercise was conducted for six labor groups), the inequality is decomposed as follows:
 (5a)
(5a)
 (5b)
(5b)
 (5c)
(5c)
 (5d)
(5d)
 (5e)
(5e)
 (5f)
(5f)
The preceding equations comprise the population with wage medians [1, K, 𝜇6] that isolate the average effect of income ?? from the rest of the medians in each subgroup, assigning the corresponding weight. As such, the decomposition is represented with two components, between and within, and G k , which is the equivalent to the calculation of the Gini index in the equations expressed in (5a) and (5f) with the following formula:
 (6)
(6)
And its respective components as,
 (7)
(7)
 (8)
(8)
G(y(𝜇/𝜇𝑔)) permits normalizing the inequality with the vector of the income averages belonging to each group, where the average of the wages in each subgroup shall be equal to its median; and G(𝜇𝑔) is precisely equal to the average inequality of the group in question. Expression (7) is deduced from the inequality existing between groups and expression (8) is obtained to represent the portion of inequality within subgroups.
DATA USED FOR THE DECOMPOSITION OF THE GINI FOR WAGES
The databases used were drawn from the National Occupation and Employment Survey (ENOE) published by the National Statistics and Geography Institute (INEGI) in the years 2005 to 2012.
The selection criteria for workers was to choose those in working age ranging from 16 to 65 years, both men and women.
The unit of analysis consisted of the six states along the northern border of Mexico (Baja California Norte, Sonora, Chihuahua, Coahuila, Nuevo León, and Tamaulipas). The wages of the workers were recorded on a monthly basis in the survey in current Mexican pesos, and we proceeded to deflate to 2005 prices using the consumer price index from the second quarter of that year.4
WHY PERFORM THE ANALYSIS BY TASKS?
As mentioned earlier, one of the ways to analyze the impact of technological change on the labor market is by studying the changes in labor and the wage implications workers face pursuant to the skills they can acquire through experience. Another approach involves analyzing the years of schooling pursuant to the idea that depending on education level, people will have different skills.
The classification most frequently used to analyze changes in demand is to categorize workers into skilled and unskilled.
In this research paper, aiming to delve deeper into an analysis of wage inequality pursuant to worker skills, we used a classification that expands upon the characterization of labor. Following the criteria set forth in Acemoglu et al. (2011), workers are classified by the type of tasks they carry out into the following categories: abstract, routine, and manual. This classification is unique and, to our knowledge, has not been used in the case of Mexico for this type of analysis.
Abstract tasks require problem-solving, intuition, persuasion, and creativity. Workers who perform these types of tasks tend to have high levels of education; routine tasks are those that can be carried out by machines or by following programming rules, which makes them easily replaceable; while manual tasks entail activities that require adapting to new situations, visual recognition, and interaction between people, frequently requiring low-skilled workers to perform this type of task.
Pursuant to the preceding analytical criteria, we used a Mexican employment classification (CMO) to sort the workers into their groups.5 This classification is advantageous for two reasons: 1) it facilitates grouping when it comes to sorting workers into their occupations, and 2) it elucidates in a simple and rapid manner the dynamics of the type of occupation to which we refer.
In summary, the workers were sorted into one of three groups of occupations (abstract, routine, and manual). Moreover, aiming to analyze the duality of the Mexican labor market, the criteria for labor formality was whether or not workers had access to medical services. Accordingly, for purposes of the exact decomposition, we have six categories for the occupational groups (abstract formal, abstract informal, routine formal, routine informal, manual formal, and manual informal). We believe this will help us drill down into the labor dynamics of the Mexican market.
THE RESULTS OF THE WAGE INEQUALITY DECOMPOSITION
Below is the occupational structure of workers by task type, aiming to observe the effect of technological change in the region through the classification proposed by Acemoglu et al. (2011). Table 2 displays the occupational change in workers by task type in NBM states and Mexico overall in 2005 and 2012. When it comes to the distribution abstract, routine, and manual tasks in the NBM states, manual labor predominates. In Mexico overall, employment by task type reveals a gradual increase in manual occupations (1.28%), followed by routine (1.04%), while abstract show barely perceptible growth.
Table 2. Average Growth Rates of Occupations by Task Type, 2005-2012
| State | Abstract | Routine | Manual |
| Baja California | -1.45 | 0.80 | 1.15 |
| Coahuila | 0.79 | 1.46 | 2.88 |
| Chihuahua | -2.25 | 0.51 | -0.83 |
| Nuevo León | -4.08 | -1.40 | 0.43 |
| Sonora | -1.02 | 2.55 | 0.87 |
| Tamaulipas | 0.19 | 0.40 | 0.27 |
| Total NBM | -1.56 | 0.51 | 0.71 |
| Mexico | -0.04 | 1.04 | 1.28 |
Source: Created by the authors based on data from ENOE, respective years.
ANALYSIS OF THE PRECISE GINI DECOMPOSITION: TASKS AND SKILLS IN THE FORMAL AND INFORMAL SECTOR
In order to calculate the decomposition, the entire sample of workers was taken pursuant to the task classification, but we added in the sector in which the jobs are carried out, whether formal or informal, in order to control for this feature of labor, which is a structural problem of the labor economy in Mexico.
First, Figure 3 shows the evolution of the Gini coefficient in the period of study, comparing values for overall Mexico and the Northern Border. The country displays higher inequalities than the NBM region, and in both cases the trend during the analysis period is downward. In other words, the graph provides evidence that wage inequality in Mexico and the Northern Border region has fallen throughout the analysis period.

Source: Estimated by the authors using data from ENOE.
Figure 3. Wage Inequality in the NBM and Mexico, 2005-2012 (Gini Index)
The results of the analysis of the decomposition by task type are given in Tables 3 and 4 below. The overall inequality index went from 0.406 to 0.369 in 2012 for the Northern Border, and for Mexico, it was 0.4. In other words, there is a slight reduction in inequality. This finding is aligned with a recent study by Campos et al. (2014), who assert that inequality in Mexico has fallen. In our decomposition, we can infer with statistical reliance of 95% that the component within the labor collectives explains the majority of the inequality, going from 74% to 71% between 2005 and 2012. In the within component analysis for the NBM, the greatest contribution to inequality (although declining) is seen in workers performing manual tasks in the informal sector, with a value of 18%, which rose to 19.3% in 2012.
Table 3. Exact Decomposition of the Gini Index for Wage Inequality by Groups of Formal (F) and Informal (I) Tasks, Northern Border and Mexico, 2005
| Contribution and Group | Frontera | Mexico | ||||
| Absolute | Relative | % within | Absolute | Relative | % within | |
| Between | 0.103 | 0.254 | 0.130 | 0.298 | ||
| Within | 0.303 | 0.746 | 0.103 | 0.254 | ||
| Total Gini | 0.406 | 1.000 | 0.435 | 1.000 | ||
| Subgroups/Sk | % within | % within | ||||
| Occupations | ||||||
| Abstract f | 0.046 | 0.113 | 15.178 | 0.035 | 0.081 | 11.530 |
| Abstract i | 0.029 | 0.071 | 9.469 | 0.028 | 0.065 | 9.310 |
| Routine f | 0.062 | 0.152 | 20.408 | 0.037 | 0.085 | 12.036 |
| Routine i | 0.058 | 0.143 | 19.156 | 0.077 | 0.177 | 25.194 |
| Manual f | 0.032 | 0.080 | 10.719 | 0.022 | 0.050 | 7.183 |
| Manual i | 0.076 | 0.187 | 25.070 | 0.106 | 0.244 | 34.747 |
| Sum within | 0.303 | 100.000 | 0.306 | 100.00 | ||
| G(𝜇𝑔) | 0.165 | 0.212 | ||||
| G(y(𝜇 / 𝜇𝑔)) | 0.365 | 0.388 | ||||
Source: Created by the authors based on ENOE 2005.
Table 4. Exact Decomposition of the Gini Index for Wage Inequality by Groups of Formal (F) and Informal (I) Tasks, Northern Border and Mexico, 2012
| Contribution and Group | Border | Mexico | ||||
| Absolute | Relative | % within | Absolute | Relative | % within | |
| Between | 0.104 | 0.281 | 0.120 | 0.301 | ||
| Within | 0.265 | 0.719 | 0.279 | 0.699 | ||
| Total Gini | 0.369 | 1.000 | 0.400 | 1.000 | ||
| Subgroups/Sk | % intra | % intra | ||||
| Occupations | ||||||
| Abstract f | 0.036 | 0.098 | 13.611 | 0.027 | 0.068 | 9.767 |
| Abstract i | 0.025 | 0.068 | 9.475 | 0.026 | 0.065 | 9.330 |
| Routine f | 0.053 | 0.143 | 19.901 | 0.032 | 0.080 | 11.404 |
| Routine i | 0.054 | 0.147 | 20.433 | 0.074 | 0.186 | 26.585 |
| Manual f | 0.026 | 0.070 | 9.751 | 0.018 | 0.046 | 6.617 |
| Manual i | 0.071 | 0.193 | 26.829 | 0.101 | 0.254 | 36.297 |
| Sum within | 0.265 | 100.000 | 0.279 | 100.000 | ||
| G(𝜇𝑔) | 0.169 | 0.196 | ||||
| G(y(𝜇 / 𝜇𝑔)) | 0.331 | 0.355 | ||||
Source: Created by the authors based on ENOE 2012.
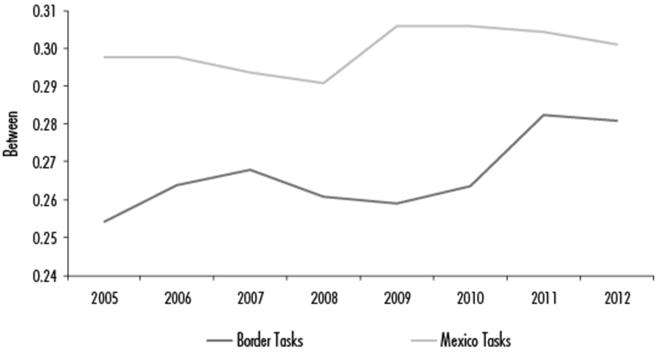
Figures 4 and 5 present the between and within components respectively, for Mexico and the Northern Border region.6
Source: Created by the authors based on ENOE, respective years.
Figure 4. Between-Group Wage Inequality by Task, Mexico and NBM
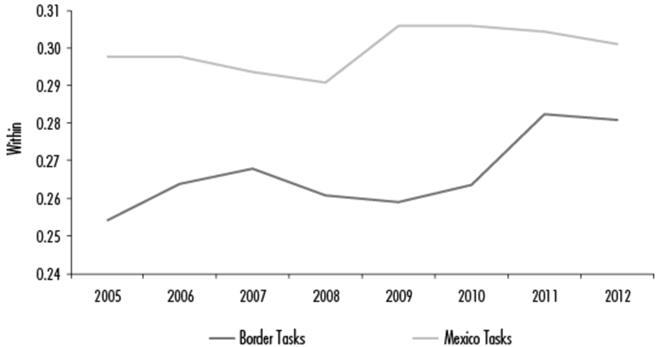
Source: Created by the authors based on ENOE, respective years.
Figure 5. Within-Group Wage Inequality by Task, Mexico and NBM
In both components, the values for the country are higher than those presented in the NBM. Likewise, the within element throughout the period saw a reduction.
CONCLUSIONS
This research presents a novel empirical application in the realm of labor and wage analysis, which helps explain the inequality in Mexico and the Northern Border region in the years 2005-2012 by task type and the skills workers possess in the Mexican labor market. The Gini index is decomposed accurately and reveals changes in wage inequality with greater precision.
The results signal that it is the within-group effect that has reduced the wage gap with a share of 70% in total inequality; in other words, inequality is explained within groups of workers, and the reduction is observed in the Gini index for the NBM, which went from 0.406 to 0.369 in 2012, while going from 0.435 to 0.40 in the final year of analysis for the overall country.
Once we determined that the wage inequality is explained within groups, it was important to demonstrate the proportion by which each of these groups of workers contributes to the disparity. In that sense, the results show that workers who perform manual tasks in the informal sector contribute 18%, a value that by 2012 had risen to 19.2% in the Northern Border region, while for the country as a whole, the greatest contribution is in the same group, but with a percentage participation of 25.4%.
These findings allow us to conclude that wage inequality in Mexico is explained in large measure by informal manual activities, followed by routine, while abstract activities have the weakest tie to the informal sector and also contribute the least to the falling inequality seen in both the NBM and Mexico as a whole.
The findings of this research paper also show, in light of the aforementioned theory of the impact of technology on the labor market, that contrary to what has happened in countries such as the United States and Canada, and what happened in Mexico in the 1990s, where biased technological change spurred a rise in wage inequality, in recent times, in Mexico and its NBM, wage inequality has narrowed, and the principal cause behind this reduction is considered to be the falling wages of skilled workers or those with higher levels of schooling.
Likewise, another cause that may not make any difference to wages is the introduction of technology, which may be insufficient to generate a demand for higher skills or mean that these groups of workers may now be engaging in routine activities.
REFERENCES
Abdelkrim, Araar (2006), “On the Decomposition of the Gini Coefficient: An Excact Approach, with an Illustration Using Cameroonian Data”, Cahier de Recherche, Working Paper 06-02. [ Links ]
Acemoglu, Daron and David Autor (2011), “Skills, Tasks and Technologies: Implications for Employment and Earnings”, Handbook of Labor Economics, 4B, pp. 1043-1171. [ Links ]
Autor, David (2013), “The ‘Task Approach’ to Labor Markets: An Overview” (No. w18711), National Bureau of Economic Research,Working Paper 13-20, Massachusetts, MIT. [ Links ]
Autor, David, Lawrence Katz and Melissa Kearney (2008), “Trends in U.S. Wage Inequality: Revising the Revisionists”, The Review of Economic and Statistics, XC(2), pp. 300-323. [ Links ]
Ayala, Edgar, Joana Chapa e Izabel Hernández (2009), “Integración regional binacional: Evidencia para los estados del Norte de México y Texas”, Frontera Norte, 21(41), pp. 105-123. [ Links ]
Campos, Raymundo, Gerardo Esquivel and Nora Lustig (2014), “The Rise and Fall of income Inequality in Mexico, 1989-2010”, Wider Working Paper, núm. 2012, pp. 140-163. [ Links ]
Castro, David (2007), “Disparidad salarial urbana en México, 1992-2002”, Estudios Sociales, 29, pp. 117-153. [ Links ]
Castro, David y Luis Huesca (2007), “Desigualdad salarial en México: una revisión”, Papeles de Población, 54, pp. 225-264. [ Links ]
Esquivel, Gerardo and José Rodriguez (2003), “Technology, Trade, and Wage Inequality in Mexico before and after NAFTA”, Journal of Development Economics, 72, pp. 543-565. [ Links ]
Hanson, Gordon (2003), “What has happened to Wages in Mexico since nafta? Implications for Hemispheric Free Trade”, Working Paper Series, núm. 9563, pp. 1-43. [ Links ]
Huesca, Luis y Reyna Rodríguez (2008), “Salarios y calificación laboral en México”, Problemas del Desarrollo, Revista Latinoamericana de Economía, 39(154), pp. 61-86. [ Links ]
Kolenikov, Stanislav y Anthony Shorrocks (2005), “A Decomposition Analysis of Regional Poverty in Russia”, Review of Development Economics, 9(1), pp. 25-46. [ Links ]
Lustig, Nora, Luis López and Eduardo Ortiz (2013), “Deconstructing the Decline in Inequality in Latin America”, Policy Research Working Paper, núm. 6552. [ Links ]
Mendoza, Eduardo (2010), “El mercado laboral en la Frontera Norte de México: estructura y políticas de empleo”, Estudios Fronterizos, 21, pp. 9-42. [ Links ]
Morduch, Jonathan y Terry Sicular (2002), “Rethinking Inequality Decomposition, with Evidence from Rural China”, Economic Journal, 112 (476), pp. 93-106. [ Links ]
Ochoa, Gloria, Luis Huesca y Cuauhtémoc Calderón (2015), “Descomposición de la desigualdad salarial en los estados de la Frontera Norte de México”, Economía Informa, 393, pp. 3-20. [ Links ]
Rodríguez, Reyna, Luis Huesca y Mario Camberos (2011), “Mercado laboral, inequidad salarial y cambio tecnológico”, Frontera Norte, núm. 45, Tijuana, México El Colegio de la Frontera Norte, enero-junio, pp. 7-33. [ Links ]
Shapley, Lloy (1954), “A Value for N-person Games”, en Harold Khun y Albert Tucker (eds.), Contributions to the Theory of Games 2, Princeton, NJ, Princeton University Press, pp. 307-318. [ Links ]
Shorrocks, Anthony (2013), “Decomposition Procedures for Distributional Analysis: a Unified Framework Based on the Shapley Value”, Journal of Economic Inequality, pp. 1-28. [ Links ]
______ (1984), “Inequality Decomposition by Population Subgroup”, Econométrica, 52 (6), pp. 1369-1385. [ Links ]
______ (1982), “Inequality Decomposition by Factor Components”, Econométrica, 50(1), pp. 193-211. [ Links ]
Wan, Guang (2002), “Regression-based Inequality Decomposition. Pitfalls and a Solution Procedure”, Discussion Paper, núm. 2002/101, pp. 1-12. [ Links ]
Wan, Guang, Lu, Min y Chen, Zhao (2007), “Globalization and Regional Income Inequality: Empirical Evidence from within China”, Review of Income and Wealth, 53(1), pp. 35-59. [ Links ]
Wan, Guanghua y Zhou, Zhangyue (2005), “Income Inequality in Rural China: Regression Based Decomposition Using Household Data”, Review of Development Economics, 9(1), pp. 107-120. [ Links ]
2One of the problems with the Gini index is that due to its nature, it cannot be precisely decomposed. Using the Shapley general formula, it is possible to obtain a new formula for the Gini index, making the decomposition precise and showing the contribution of each subgroup to the total of inequality, without any residuals.
3Thereby fulfilling the properties for a good decomposition of symmetry and additivity, proposed by Shorrocks (1982, 1984, and 2013).
4Information was taken from the second quarter of the year in order to have homogenous data for the Mexican classification of occupations, which underwent changes starting in third quarter 2012.
5 Appendix 1 contains a table with the tasks included in each of the categories.
6For this calculation, we performed the decomposition for each year of the survey, and in order to make the information clearer for the reader, the results are summarized for the entire period in the graph.
Appendix 1
Appendix 1. Classification into Abstract, Routine, and Manual Tasks
| Abstract | ―Professionals |
| ―Education workers | |
| ―Workers in the arts, shows, and sports | |
| ―Bosses, supervisors, and other workers in control of artisan and industrial manufacturing and activities related to repair and maintenance | |
| ―Heads of departments, coordinators, and supervisors of administrative activities | |
| ―Technicians | |
| Routine | ―Workers in support of administrative activities |
| ―Merchants, retail employees, and sales agents | |
| ―Drivers and assistants to drivers of mobile machinery and transportation modes | |
| ―Artisan and factory workers in the transformation industry and repair and maintenance workers | |
| ―Operators of fixed machinery in continuous movement and equipment involved in the industrial manufacturing process | |
| Manual | ―Workers in agricultural, livestock, forestry, hunting, and fishing activities |
| ―Workers in personal services at institutions | |
| ―Domestic service workers | |
| ―Aids, day laborers, and similar involved in artisan and industrial manufacturing in repair and maintenance activities |
Source: Created by the authors based on information from CMO.
Appendix 2.
Descriptive Statistics in the Breakdown of the Functional Labor Classification, Mexico and the Northern Border (ENOE 2005 and 2012)
Table A1. Descriptive Statistics of the Sample, Mexico ENOE 2005 and 2012 (Wages in Pesos Per Week 2005=100)
| Year 2005 | |||||
| Variables | Average Wages | Standard Deviation | Min. | Max. | Expanded Sample |
| By task type | |||||
| Abstract formal | 1 869.03 | 1 541.19 | 44.34 | 59 584.30 | 4 009 508 |
| Abstract informal | 1 605.26 | 2 528.98 | 11.55 | 103 926.10 | 1 988 716 |
| Routine formal | 968.76 | 778.96 | 37.64 | 19 399.54 | 5 105 112 |
| Routine informal | 710.08 | 906.37 | 2.31 | 79 461.20 | 6 880 740 |
| Manual formal | 947.37 | 630.88 | 34.64 | 24 842.26 | 3 209 410 |
| Manual informal | 654.74 | 938.22 | 3.93 | 173 803.00 | 9 615 709 |
| By skills | |||||
| High formal | 2 196.91 | 1 821.46 | 69.28 | 59 584.30 | 1 571 575 |
| High informal | 1 963.13 | 2 149.96 | 13.39 | 34 642.03 | 785 384 |
| Medium formal | 1 282.60 | 947.56 | 44.34 | 19 861.43 | 4 995 951 |
| Medium informal | 1 021.93 | 1 972.84 | 7.62 | 173 803.00 | 3 576 394 |
| Low formal | 897.54 | 627.48 | 34.64 | 34 642.03 | 5 756 504 |
| Low informal | 673.92 | 915.34 | 2.31 | 103 926.10 | 14 123 387 |
| Year 2012 | |||||
| By task type | |||||
| Abstract formal | 2 194.61 | 1 508.00 | 32.79 | 33 764.43 | 3 801 369 |
| Abstract informal | 1 776.02 | 2 183.91 | 9.93 | 69 284.06 | 2 182 525 |
| Routine formal | 1 250.70 | 1 015.87 | 59.58 | 66 542.95 | 5 133 006 |
| Routine informal | 866.56 | 859.09 | 6.93 | 29 792.15 | 7 688 406 |
| Manual formal | 1 206.19 | 784.55 | 23.09 | 24 826.79 | 3 090 146 |
| Manual informal | 852.96 | 795.63 | 4.85 | 38 491.22 | 10 922 945 |
| By skills | |||||
| High formal | 2 459.93 | 1 757.96 | 98.15 | 26 327.95 | 1 618 061 |
| High informal | 2 130.51 | 2 293.06 | 20.79 | 36 951.50 | 809 215 |
| Medium formal | 1 570.50 | 1 164.88 | 27.71 | 49 657.50 | 5 459 590 |
| Medium informal | 1 123.75 | 1 383.98 | 11.55 | 69 284.06 | 4 820 612 |
| Low formal | 1 142.75 | 792.42 | 23.09 | 66 542.95 | 5 010 130 |
| Low informal | 821.94 | 757.44 | 4.85 | 41 709.01 | 15 184 787 |
Source: Created by the authors based on ENOE 2005 and 2012.
Table A2. Descriptive Statistics of the Sample, Border ENOE 2005 and 2012 (Wages in Pesos Per Week 2005=100)
| Year 2005 | |||||
| Variables | Average Wages | Standard Deviation | Min. | Max. | Expanded Sample |
| By task type | |||||
| Abstract formal | 1 938.59 | 1 531.99 | 46.19 | 23 094.69 | 983 437 |
| Abstract informal | 1 939.35 | 2 643.75 | 46.19 | 69 284.06 | 390 848 |
| Routine formal | 1 027.09 | 716.13 | 61.89 | 9 237.88 | 1 647 128 |
| Routine informal | 905.65 | 1 040.62 | 6.93 | 16 166.28 | 905 072 |
| Manual formal | 1 044.22 | 768.17 | 34.64 | 23 849.19 | 891 025 |
| Manual informal | 910.30 | 2 474.97 | 3.93 | 173 803.00 | 1 337 517 |
| By skills | |||||
| High formal | 2 422.80 | 1 902.98 | 105.77 | 23 094.69 | 380 607 |
| High informal | 2 540.90 | 2 417.91 | 46.19 | 19 861.43 | 155 455 |
| Medium formal | 1 387.98 | 1 014.72 | 46.19 | 18 475.75 | 1 319 550 |
| Medium informal | 1 361.85 | 3 995.54 | 11.55 | 173 803.00 | 584 014 |
| Low formal | 954.12 | 626.31 | 34.64 | 23 849.19 | 1 821 433 |
| Low informal | 845.13 | 891.63 | 3.93 | 34 642.03 | 1 893 968 |
| Year 2012 | |||||
| By task type | |||||
| Abstract formal | 2 261.66 | 1 706.87 | 32.79 | 33 764.43 | 850 646 |
| Abstract informal | 1 898.77 | 2 281.39 | 57.74 | 36 951.50 | 380 684 |
| Routine formal | 1 271.72 | 840.72 | 64.43 | 19 907.62 | 1 602 776 |
| Routine informal | 907.10 | 894.84 | 21.71 | 12 413.39 | 1 040 581 |
| Manual formal | 1 212.44 | 691.39 | 124.71 | 9931.41 | 843 635 |
| Manual informal | 937.53 | 1 016.65 | 9.47 | 38 491.22 | 1 498 057 |
| By skills | |||||
| High formal | 2 712.60 | 1 895.97 | 138.57 | 16 166.28 | 367 145 |
| High informal | 2 478.60 | 3 165.14 | 57.74 | 36 951.50 | 138 162 |
| Medium formal | 1 585.20 | 1 156.45 | 32.79 | 33 764.43 | 1 313 970 |
| Medium informal | 1 212.51 | 1 240.82 | 27.71 | 14 896.07 | 719 918 |
| Low formal | 1 157.81 | 679.41 | 64.43 | 19 907.62 | 1 622 057 |
| Low informal | 894.62 | 945.52 | 9.47 | 38 491.22 | 2 063 284 |
Source: Created by the authors based on ENOE 2005 and 2012.
Received: February 17, 2016; Accepted: August 15, 2016
 Este es un artículo publicado en acceso abierto bajo una licencia Creative Commons
