


 nova página do texto(beta)
 Inglês (pdf)
 Artigo em XML
 Referências do artigo
 Enviar este artigo por email
 Citado por SciELO
  Similares em
SciELO
Similares em
SciELO 
 Permalink
INTRODUCTION
Considering data exposed by the World Health Organization (WHO), noncommunicable diseases (NCDs) are the cause of approximately 41 million deaths worldwide [1]. In that same study, the WHO points to cardiovascular diseases, cancer, chronic respiratory diseases, and diabetes as the main NCDs. Attributable to diabetes, only in the year 2019, close to 2 million deaths were registered, in addition, in a similar research, with the objective of evaluating the behavior of the diagnosis of this disease, it was found that in the period between 2000 and 2019, the diagnosis rate of this disease had an increase of 3 % with an upward trend, suggesting that for later years more people may develop this condition, likely increasing the mortality rate [2]. The most common conditions that affect people with diabetes and ultimately lead to death are blindness, kidney failure, heart attack, stroke, and lower extremity injuries leading to amputations, however, as suggested by the WHO and the American Diabetes Association (ADA), the probability of developing these health conditions can be reduced by adopting a healthy diet, a correct physical exercise plan and, mainly, a continuous monitoring of glucose levels [2][3].
Despite the fact that there are endless strategies to monitor glucose levels in the human body, the mortality rates suggest that they are not used properly. In work such as those carried out by [4][5][6], the main difficulties of inadequate monitoring are indicated and in Table 1, we present them briefly.
Table 1 Main factors that affect the self-monitoring of glucose levels in diabetic patients.
| Measurement errors | |
|---|---|
| Humans | Incorrect use of blood glucose meters, incorrect execution of coding, inappropriate storage and use of test strips, inappropriate education of patients and diabetes equipment, etc. |
| Inherent in the device | Accuracy, ease of use. |
| Inherent in test strips | Lot to lot variations, vial to vial variations, strip to strip variations. |
| Environmental | Temperature, humidity, altitude, electromagnetic radiation. These uncontrolled factors can affect the strips. |
| Physiological | Perfusion of peripheral blood, hematocrit, triglycerides, uric acid. |
| Medication | Ascorbic acid, paracetamol, dopamine. |
In order to propose friendlier strategies for the interpretation of results and reduce the inconvenience derived from blood extraction or the need to use accessories (such as test strips), research papers such as those compiled in [7], have been proposed. In such studies, many techniques based on the analysis of noninvasively extracted biofluids to estimate the glucose level are proposed, likewise, it is possible to appreciate that the techniques that have allowed to obtain the best results are those based on spectroscopy: Fourier transform infrared (FTIR), Raman and ultravioletvisible (UV-Vis) principally [8][9][10][11][12][13][14].
Through the interaction of a certain biological sample with different frequencies of the electromagnetic spectrum, spectroscopy allows knowing the molecular composition of the studied sample. These interactions cause the chemical bonds that make up the sample to vibrate. Such vibrations are recorded in a twodimensional matrix called a spectrum. It is through the study of these spectra that it has been possible to propose solutions for the characterization of different populations of patient groups. Despite the great advantage achieved with the papers presented by [7], the cost of the equipment required (spectrometers) to perform glucose estimation is unaffordable for the majority of the population.
In order to develop a reliable and accessible device for the population, which allows them to monitor their glucose levels in a non-invasive and friendly way, the possibility of developing a device that through the bombardment of electromagnetic frequencies achievable with a low-cost commercial LED and associated with the UV-Vis spectrum, is studied, in the first instance, to characterize the glucose levels in solutions prepared in deionized water to later think about analyzing a more complex biofluid such as blood or saliva. The feasibility of using electromagnetic frequencies contemplated by the UV-Vis region, to characterize samples of different nature from their glucose concentration, has been exposed in the investigations of [15][16][17][18].
The device developed and evaluated in this document, focuses on the analysis of the light level emitted and received by an LED with emission of electromagnetic frequencies considered in the UV-Vis, punctually, the range analyzed covers frequencies between (397-402 nm). Through the modification of the duty cycle (D) of the output port number 3 Pulse Width Modulation (PWM) of the Arduino 1 board, it was possible to simulate 255 different voltage values between 0 and 5 volts (output voltage for Arduino pins) with which the LED was turned on at different intensities. In front of the LED, the PT1302B/C2 phototransistor was placed in order to capture the level of light coming, mainly from the LED.
After analyzing 50 spectra of deionized water with 5 different glucose concentrations, it is concluded that the evaluated device could be used to characterize samples with different concentrations of the same molecule, since the 50 signals were correctly identified.
MATERIALS AND METHODS
This section is addressed in 3 different subsections to give details of the 3 main areas involved in the project: electronics, software development and data analysis through machine learning.
Device development
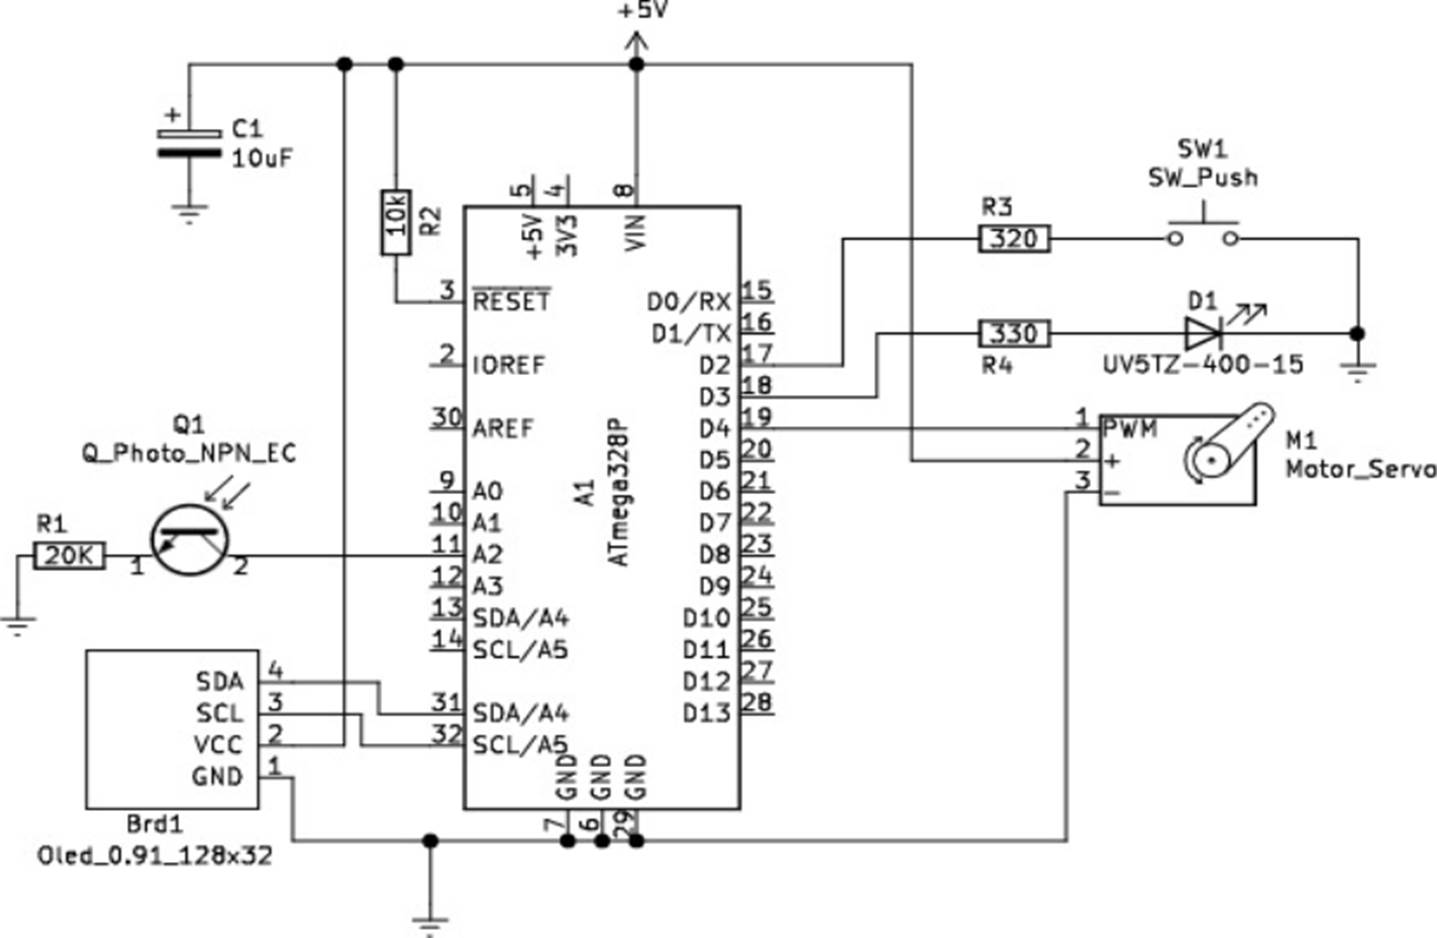
As a central unit for obtaining the UV-Vis spectrum, it was carried out using an Arduino 1 board. The process starts when the user presses the micro switch. Using the PWM pin (pin number 3), from the Arduino development board 1, we modulate the light intensity of the UV5TZ-400-15 LED, which has a viewing angle of up to 15° [19, p. 400-15]. This modulation was achieved by simulating the output voltage (Vef) of the pin, to perform this task, the duty cycle (D) of the pin was modified for the same period of time, consider the following example, for a time period of 5 seconds, if the LED stays on for 1 second D would be equivalent to 20% and considering that the Arduino output pins allow to obtain 5 volts, the Vef would correspond to 1 volt (this is 20% of 5 volts), the above would turn on the LED with a certain brightness. The PWM modules allow, through the analogWrite(AW) instruction, to write values between 0 and 8 bits, that is, values between 0 and 255, for this, it is necessary to provide the function as the first argument the output pin followed of the duty cycle to be simulated: analogWrite(OutputPIN, D). The LED anode was connected in series with a 330 Ohm (Ω) resistor to the PWM pin of the Arduino, while the cathode was connected to ground.
To capture the light transmitted through the sample and convert it to voltage, we use the reverse-biased phototransistor PT1302B/C2 [20]. The cathode of the PT1302B/C2 was connected in series with a 20 Kilo Ohms (KΩ) resistor and to the 5 volt output of the Arduino while the anode was connected to an analog pin 2 (A2) on the board to record the voltage received from the UV5TZ-400-15 LED via the Arduino analogRead instruction. On the display, the user D and the value received by the phototransistor will be presented.
Using deionized water and 99.5 % D-glucose, solutions with 500 mg/dL, 250 mg/dL, 100 mg/dL, and 50 mg/dL were prepared. Of each solution, 10 microliters (μl) were deposited on a 1 millimeter (mm) thick microscope slide by pipetting and allowed to dry at room temperature. From each sample with the 4 solutions prepared with different glucose concentrations, 10 spectra were captured. In addition, 10 spectra of the empty slide were captured. To ensure that the slide was always placed in the correct position to be irradiated, an alligator clip was soldered to a servomotor with a rotation angle of 0° to 90°, thus, after calibrating the LED and the phototransistor, the servomotor would place Always in the same orientation the slide. Figure 1 shows the electronic diagram of the connections mentioned.
Software for data acquisition
The operation described at the end of the previous subsection allows the device to radiate a sample, however, it is necessary to capture and save this information to be able to analyze it later. To achieve the above, it is necessary to develop a computer program that allows, through the Universal Serial Bus (USB) input of the Arduino, to link the device developed with a computer to safeguard the information obtained from the radiation of each sample.
To enable communication between Arduino and a computer, it is necessary to include the data to be transferred in the Serial.println(data) function, and previously, define the baud rate for communication in the setup() section using the Serial.begin(9600); instruction. In this way, Arduino will have the possibility of sharing all the values that are included in one or more instructions Serial.println(data).
To record the data in the computer, it is necessary to develop a program that allows analyzing the USB connections of the computer to detect the one that matches the Arduino board, to later establish communication with the board using the baud rates defined in Arduino. It is worth mentioning that a usual value for the baud rate is 9600, the value adopted in this work, although this value may vary.
Once the Arduino radiation process is finished, the software will save a .txt file on the computer with records of both the value of D and the voltage received by the transistor.
Data analysis
After radiating the sample with the values of 255 Vef (because it is only possible to write 8-bit values with a PWM pin), and after capturing the values of the light transmitted through the sample, the resulting vector was normalized using Equation 1.
To verify the feasibility of the team and the proposed strategy, the k-nearest neighbors (KNN) strategy was used with different values of k and a similarity metric based on the Euclidean distance (D.E.) [21], Equation 2.
For our case, from Equation 2, X represents the indices of the vector that is analyzed (the variations of D, that is, values from 0 to 255) while Y, the values recorded by the phototransistor and stored in the Arduino 1 board.
The KNN strategy assigns the membership or class to an unknown vector based on the class to which the k closest vectors belong. For this, it is necessary to define a method to calculate the distance of the vector under study with respect to all the others, the Euclidean distance in our case. In this sense, KNN requires that the signals belonging to the same family have a subregion where they have a very similar altitude (or with a minimum standard deviation), since otherwise errors in the associations would be frequent [22][23][24][25]. In order to evaluate all the signal through the KNN strategy, the leave-one-out-cross validation (LOOCV) strategy was followed. According to LOOCV, a signal from the database is separated in order to be compared against the rest and, based on some similarity metric, assign a membership to one of the available classes. This process is carried out with each of the registered samples [22].
The flow diagram for the radiation of a sample is presented below in Figure 2.

The research hypothesis is that there must be a linear correlation between the light level emitted and received, unless something hinders its free transit. Between the LED and the transistor, the glass slide with 10 microliters of one of the prepared solutions will be located. After finishing the radiation process for one sample, the slide was cleaned with isopropyl alcohol in order to receive the next sample of the same concentration as the previous one. The described process was repeated until 10 measurements of each concentration were formed, therefore, since there were 5 different glucose concentrations, there was finally a database of 50 measurements. In the measurements of each glucose concentration, a particular behavior was sought that would allow them to be differentiated from the measurements of the other concentrations.
RESULTS AND DISCUSSION
Figure 3 shows the developed device, where the graphical user interface (GUI) developed to establish the communication process in a friendly way is presented.

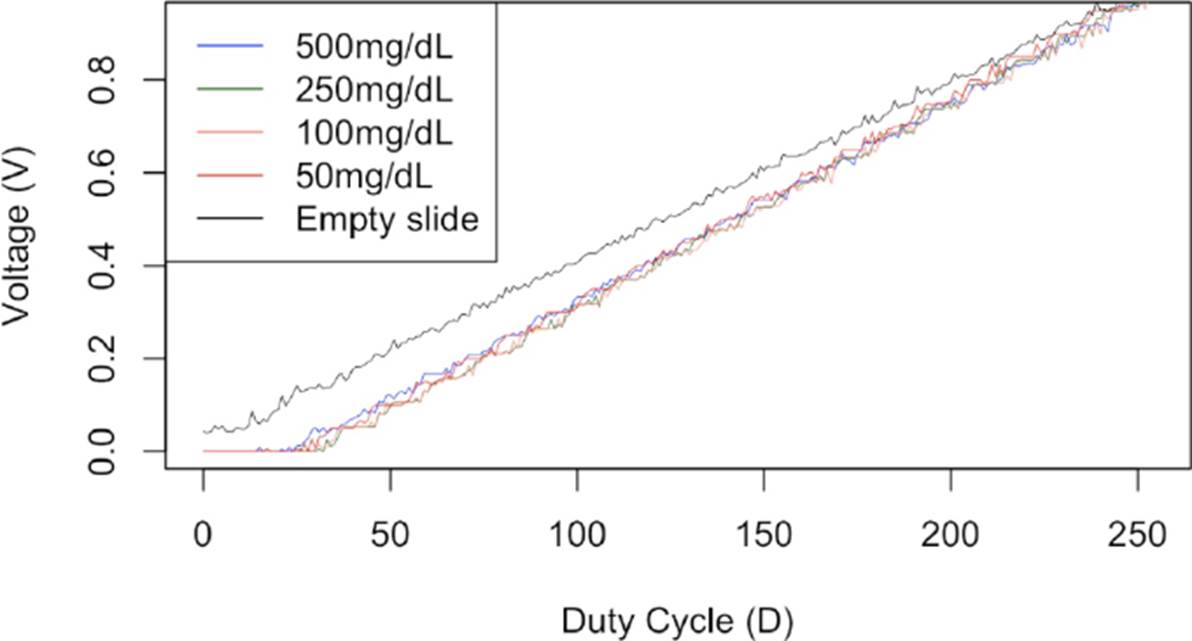
To guarantee that the samples were irradiated in the correct place, the slide was placed in a clamp welded to a servomotor, thus always placing the sample to be analyzed in the same position. Once the 10 signals of each concentration were captured, including the empty slide, the formula of Equation 1 to normalize them between 0 and 1. Figure 4 shows the comparison of the mean signal calculated for each of the concentrations prepared.
Following the guidelines of the KNN algorithm and the LOOCV segmentation, 4 different evaluations were carried out considering different values for K. The results are presented in Table 2.
Table 2 KNN algorithm performance considering different values of K.
| KNN performance | ||
|---|---|---|
| K value | Misclassified signal | Accuracy percentage |
| 2 | 2 | 96 |
| 3 | 0 | 100 |
| 4 | 0 | 100 |
| 5 | 1 | 98 |
To validate the results shown in Table 2, we calculated the standard deviation of the signals considering the 255 possible values for D. In accordance with [26], the standard deviation (SD) is defined as the concentration with respect to the arithmetic mean of a set of values, this implies that, with a certain value of D, the signal of the same population has a standard deviation close to 0. Figure 5 shows the standard deviations behavior of the mV received when the sample interacts with a certain simulated voltage (70, 1500, 1900 and 1800 mV).

Figure 5 Behavior of the standard deviations for the different glucose concentrations, considering different simulated voltages.
Thanks to Figure 5 it is possible to validate the results presented in Table 2 considering the following:
●The LOOCV strategy consists of randomly separating a signal from a database, omitting the fact that the group to which it belongs is known in order to assign it a membership through some mathematical model.
●The KNN strategy compares a new measurement against properly categorized measurements from a database based on Euclidean distance. In this way, the new signal will adopt the membership of the K closest values in the measurements registered in the database.
●The standard deviation (SD) is a measure of dispersion from the mean of a population. A standard deviation equal to 0 means that the mean of a population is exactly equal to a value of the new signal to be classified, which means that this new signal has exactly the same height (or mV received in our case) as the signal of a population.
Considering the previous points and the results presented in Table 3, it is possible to infer that there are points in which the measurements of the different populations have exactly the same height between them and considering the results of the same table for the misclassified signal, it is It is possible to say that these signals belong to the same population. Through the modification of values for D in the PWM Arduino PIN, it is possible to obtain SD close to 0 at different points of the signal for the different glucose concentrations. Such regions are presented in Table 3. The D values indicated in Table 3 do not mean that there is no overlap in the values of the voltage received from the different glucose concentrations, but rather that with such a D value, a SD equal to 0 was obtained for a given glucose concentration.
Table 3 Key D values to characterize the different concentrations of glucose.
| Key D values | ||
|---|---|---|
| Glucose (mg/dL) | D Value (%) | Received millivolts. (mV) |
| 50 | 35, 36, 37, 48, 49, 51, 58, 71, 84, 96, 97, 98, 99, 108, 109, 110, 148, 240 and 252. | 100,100,100,200,200, 200,300,400,500,600, 600,600,600,700, 700,700,1100, 1900 and 2000 |
| 100 | 78, 88, 104, 140, 154, 179, 188, 212, 214, 215 and 224. | 400, 500, 600, 900, 1000,1200, 1300, 1500,1500,1500 and 1600 |
| 250 | 100, 236 and 244. | 600, 1700 and 1900 |
| 500 | 32, 34, 64, 122, 123, 132, 133, 157, 160, 178, 180, 181, 190, 192, 193 and 204. | 100,100,400,1000, 1000,1100,1100, 1300,1400,1600, 1600,1600,1700, 1700,1700 and1800 |
Table 3 expresses that, for example, when the 10 samples of glucose concentrations were irradiated at 250 md/dl, generating the simulated voltages corresponding to the modification of the duty cycle (D) of the Arduino PWM PIN with values of 100, 236 and 244, and after normalizing the signals, we always obtained voltages of 600, 1700 and 1900 mV.
Different spectroscopy strategies, including UV-Vis, have proven to be useful for the characterization of different glucose concentrations, analyzing samples with a molecular composition even higher than that exposed in the present work [8][9][10][11][12][13][14][15][16][17][18], for this, they use spectrometers capable of regulating the different ranges of the frequencies of the electromagnetic spectrum.
Although the investigations focused on quantifying glucose levels in more complex samples (in terms of molecular composition) than those studied in this work report accuracy percentages higher than 90 % thanks mainly to a linear behavior of the UV-Vis spectrum [15][16][17][18], the models reported by the authors require all the measurements obtained by the spectrometer used in their research, which cover frequency ranges between 250 nm and up to 900 nm.
The results obtained in the present work coincide with the aforementioned authors, evidencing the feasibility of using low frequencies of UV-Vis spectroscopy to quantify glucose concentrations; however, a couple of points to highlight is that in this research it is carried out considering 6 frequencies (out of 397 at 402 nm), in addition to not requiring mixing the samples with gold or silver nanoparticles or with more complex molecular solutions such as those of the authors of [15][16][17] [18], as in related works.
Being emitted by a low-cost LED, the frequencies considered in this work open the possibility of developing a device that allows the identification of different levels of concentrations of deionized water with glucose. However, based on the results obtained through the K-NN exercise, it is difficult to think about obtaining a specific punctual result, since with different values of K the percentage of accuracy was reduced.
CONCLUSIONS
In the present work, we propose a novel technique that, considering the results obtained, allows us to correctly identify the concentrations of glucose mixed in deionized water.
Through the modulation of the output voltage of a PWM pin of the Arduino 1 board, we regulate the light intensity produced by the UV5TZ-400-15 LED. The light intensity emitted by the LED was recovered using the PT1302B/C2 phototransistor. By working with 8 bits, it was possible to produce 255 variations of the output voltage for the LED, each sample analyzed was subjected to these 255 luminous variations, thus obtaining a vector of 255 elements (millivolts). After subjecting 50 samples of deionized water with 5 different concentrations of glucose (10 for each concentration) to the light radiation process produced by the LED and using the KNN algorithm, it was possible to find that when hit by a specific light intensity, the samples with the same glucose concentration presented similar behaviors, this is, whenever they were irradiated at a certain luminosity out of the 255 possible, the 10 different samples with the same glucose concentration allowed the photodiode to always capture the same number of millivolts. For each glucose concentration, the above behavior was observed with different light intensities, however, between the different concentrations of gloss, the light intensities that produced this effect were never the same (Table 3). This was what allowed KNN to correctly identify all 50 samples.
Despite the fact that works such as those presented by [8][9][10][11][12][13][14][15][16][17][18], have proposed techniques to characterize more complex samples (with more additional molecules to water and glucose) based on their glucose level using UV-Vis spectroscopy. There are several significant differences between these works and the one presented in this article. Probably the most important is the strategy used, while in spectroscopy the frequencies of the emitting sources are modulated, in the present work we simulate different voltages with which the LED turns on at a certain brightness, however, the frequency with which the Arduino PWM PIN works remains constant. Additionally, in the works [8][9][10][11][12][13][14][15][16][17][18], the authors need to use nanoparticles to highlight the effects of glucose in the samples analyzed while in the present work the samples are studied without any additional component, although this can be attributed to the fact that in their studies the authors studied samples with additional molecules to water and glucose, which interfere with their measurements. Finally, there is the field of the quality of the materials, while the authors of the related works use spectrometers, the device elaborated in the present work, considers commercial materials.
The purpose of this research work is to develop a device that allows to reliably estimate glucose levels in samples with a large number of molecules such as saliva, therefore, despite the fact that the results obtained are encouraging, it is necessary to experiment with sample more complex, for this purpose it is proposed to gradually add more components to the concentrations and repeat the exercises carried out here.

