


 nova página do texto(beta)
 Inglês (pdf)
 Artigo em XML
 Referências do artigo
 Enviar este artigo por email
 Citado por SciELO
  Similares em
SciELO
Similares em
SciELO 
 Permalink
INTRODUCTION
The vaccination strategy adopted by all countries has made it possible to reduce both the number of infected people and the mortality rate caused by the SARSCoV-2 virus, however,the early detection of the coronavirus disease (COVID-19) caused by the virus is crucial to stop its spread [1]. Reverse transcriptase-polymerase chain reaction (RT-PCR) is the first-line test to diagnose this disease, which uses different specimens: blood, serum, plasma, urine, nasopharyngeal aspirate, oropharyngeal swab, sputum, and saliva principally [2] [3] [4] [5] [6] [7] [8]. Depending on the chosen specimen and the biomarkers that will be used, this technique could take up to 100 minutes approximately [5], highlighting that the specimens that have reported the best sensitivity and specificity (more than 90 % in both parameters if the test is performed approximately five days after infection) are oropharyngeal and nasopharyngeal swab samples [5]. In addition to these types of samples, it has been reported that it is possible to obtain similar percentages by analyzing sputum [2] [3] [6] [8].
Despite the promising results obtained by RT-PCR in the diagnosis of COVID-19, factors such as the incubation time of the virus, the processing time of the sample to obtain results, and price associated with the test have encouraged the search for different methodologies that could be used in greats population as screening, avoiding the spread of the virus [7] [9] [10].
Fourier transform infrared (FTIR) spectroscopy reveals the chemical bonds of the molecules that make up a sample thanks to the impact with an electromagnetic frequency (Hertz) belonging to the mid-infrared (IR) region. The vibrations produced and the frequency that caused them are recorded in a two-dimensional matrix known as an FTIR spectrum. Several regions have already been identified on the IR spectrum depending on the molecules that make up the sample (lipids, proteins, nucleic acids, among others) [11] [12] [13].
Despite the above, the main drawback not only of FTIR spectroscopy, but of many others, is the signals overlapping. The more components that make up the sample that is analyzed, the greater the probability that these components present a chemical bond in common, which causes overlap between the populations that are studied, reason by which machine learning techniques are being used, making possible to solve this limitation thanks to the interpolation to a dimensional region different from the one posed by the original problem (in the support vector machine case). This approach has also been adopted by the authors of [14] [15] [16] [17] [18].
In [14], authors propose a strategy based on multivariate-partial least squares (PLS) associated with k-nearest neighbors (KNN) to characterize 243 samples of oropharyngeal swab suspension fluid. The strategy proposed by the authors allowed them to report 87 % sensitivity, 66 % specificity, and 78.4 % accuracy. Although their study focused only on the female population during pregnancy and analyzing blood samples, authors of [15], report an accuracy greater than 90 % in the characterization of 37 samples of participating patients considering a model based on the C5.0 single decision tree algorithm and deep neural network approach. Similar to [15], the authors of [16], analyze serum samples of 249 patients through ATR-FTIR and multivariate linear regression model (MLRM), allowing to report sensitivity and specificity values of 94.55 % and 98.44 % respectively. Analyzing sera samples from 82 patients, the authors of [17], propose a mathematical model based on Partial least squares and discriminant analysis (PLS-DA). With the PLS-DA model, the authors were able to report a sensitivity of 100 % and a specificity of 87.5 %. Finally, in [18], the authors present a strategy that allows obtaining values of 97.8 % accuracy, 97 % sensitivity and 98.3 % specificity, analyzing FTIR spectra of ribonucleic acid (RNA) from 280 patients. The results reported in their work were obtained thanks to the application of different ML strategies, which were applied as follows: they use dimension reduction techniques, namely principal component analysis (PCA), partial least square (PLS) and Sparse Classification and then use logistic regression for PCA and PLS and support vector machine (SVM) and kernel SVM for classification.
In this sense, in the present work, we evaluate the performance of different Machine Learning (ML) techniques, in order to identify the one that would allow the best results to be obtained for the characterization of 1275 Attenuated Total Reflection (ATR)-FTIR saliva spectra, of which 66 were previously confirmed as carriers of the SARS-CoV-2 virus and the rest were reliably assigned to the control group since their samples were obtained and processed during the year 2019, a period in which no case of infection by this virus had been reported in Mexico. Our results suggest that the best strategy is multivariable linear regression (MLRM), since considering Leave-One-Out-Cross Validation (LOOCV) and Hold-Out cross validation segmentations, it is possible to correctly identify the spectra of each of the populations.
MATERIALS AND METHODS
This section describes the strategies for taking samples, capturing the ATR-FTIR spectrum, its pre-processing and analysis.
Samples acquisition
For the control group conformation, 1209 healthy volunteers were recruited in the “Unidad de Especialidades Médicas (UEM)” of the National Defense Ministry-Mexico from February 2019 to February 2020 (a period in which the COVID-19 has not reached Mexico borders), following what is stated in the protocol with internal folio: 001/2019 and presented to the clinical research committee of the UEM. For COVID-19 samples, in the period of May and June 2020, after the approval of the research project with official number: C.INV.-034, 66 persons positive to COVID-19 were recruited in the “Hospital Central Militar” of the National Defense Ministry-Mexico, who were diagnosed through RT-PCR technique; the days elapsed from COVID-19 diagnosis to saliva sampling range from 1 to 30 days with a mean of 11 ± 7 days.
Volunteers donated approximately 1 ml of saliva, collected in sterile 1.5 ml microcentrifuge tubes. After being collected, the samples were refrigerated at a temperature between 0 and 4 °C until its spectrum was captured as suggested in [13] [19] [20]. In order to participate in this research project, the volunteers should have reached the age of majority (18 years in Mexico) and have a fasting period of at least 8 hours. In addition, in order not to add external components to the saliva sample, the participants did not have to previously wash the oral cavity, nor had any dental treatment. The healthy patients were informed that their samples would be used for different diagnostic assays as a reference control, and the COVID-19 patients were informed that their samples would be used to try other types of diagnosis. In order to reduce the effect of sample degradation caused by bacteria, between 10 and 15 patients were sampled each day. In this way, the period between the time the sample was obtained and its processing by FTIR spectroscopy did not exceed 1 hour, since, as [19] suggests, even when stored at -80 °C, the degradation process affects the nature of the biological specimens analyzed by FTIR spectroscopy.
The research protocols were evaluated and approved by the research committees of the UEM and the Hospital Central Militar. All the experiments carried out with the samples obtained with the informed consent of the volunteers were developed considering the provisions of the Helsinki Treaty.
Spectra capture
To capture the spectrum, 3 μl were collected by pipetting and subjected to a drying process. Subsequently and using the Jasco FTIR-6600, the absorbance spectrum was captured through the attenuated total reflectance (ATR) sampling mode, with a resolution of 4 cm-1, and 120 scans were performed as suggested for liquid samples [11] [12]. Once the sample was dry, it was possible to appreciate the main biological macromolecules reported [13] [21] [22], such as lipids (L) in the region of 3000-2800 cm-1, amide I and II proteins(P) in the range of 1700-1600 and 1560-1500 cm-1 respectively, and nucleic acids (NA) in the region at 1250-1000 cm-1.
The personnel in charge of collecting and processing the samples were equipped with the necessary protective equipment to guarantee their safety. Once the spectrum of the sample was captured, both the laboratory and the material where the processing was carried out were sanitized using type C ultraviolet light.
Sample pre-processing
Before the analysis of the saliva spectra, these were normalized using the Standard Normal Variate (SNV) methodology as indicated Equation (1):
x: spectrum absorbance
µ: mean
σ: standard deviation
Classification and validation models
In the search for alternative strategies to characterize FTIR spectra of patients with diabetes, dengue, different types of cancer and Parkinson's disease, different ML strategies have performed better than others [23] [24] [25] [26]. Analyzing this type of signals, according to the authors of [20] [27], the classification methods that allow the best results to be obtained are linear discriminant analysis (LDA), quadratic discriminant analysis (QDA), partial least squares regression discriminant analysis (PLS-DA), K-nearest neighbors (KNN), support vector machines (SVMs), and artificial neural networks (ANNs), so, in the present work, we evaluate the performance of ANNs (classification and regression), SVMs (classification and regression), KNN, and LDA, in addition to a multivariate linear regression model (MLRM). The initial conditions of the methodologies are presented below:
ANNs: A simple perceptron with hyperbolic tangent as an activation function, Equation (2).
SVM: A support vector machine, Equation (3), using a 2 degree polynomial kernel (d=2), Equation (4).
a tolerance of termination criterion of 0.001
KNN: considering K=10. In this strategy, the closest k samples (10) to the evaluated one are considered, and its membership will be the same as that of most of the K neighbors considered. The closeness between the samples was calculated by means of the Euclidean distance formula, exposed in Equation (5)
LDA: with a tolerance= 1.0, based on Bayes probability theorem: p(x|Covid) and p(x|Control), assigning a category to a new sample according to the one that allows obtaining the highest probability based on its attributes (absorbance values).
MLRM: A multivariate linear regression model of the form Equation (6), where b=interceptor, mi=slope, Xᵢ=independent variable i and ε is the error value.
The accuracy Equation (7), sensitivity Equation (8), and specificity Equation (9) of the ML models, was evaluated considering leave-one-out cross-validation (LOOCV) methodology [28], and due to the number of samples, the Kolmogorov-Smirnov technique was used to evaluate the normality of the spectra [29]. We, additionally, use LOOCV to choose the best ML methodology and the best spectra sub-region to characterize the control group and the COVID-19 group. Once regions and the methodology were selected, the ML classifier's performance was evaluated through a Hold-Out methodology with 20 % of each population (control and COVID-19) considered in the evaluation process and the remaining 80 % of the spectra for the training task as [30] [31] [32] suggest. The samples were randomly selected.
In Equations (7), (8), (9), TP= true positives, TN= true negatives, FP=false positives, and FN=false negatives. We employ the determination coefficient r2, Equation (10), to evaluate the performance of regression models against the dependent variable.
Both the ML models and the validation strategies presented in Equations 1-10 were developed in the c++ programming language via the Xcode integrated development environment for macOS. The equipment used was a MacBook Air with an Apple M1 chip and 8 GB RAM.
RESULTS AND DISCUSSION
Through ANN (for classification and regression), SVM (for classification and regression), KNN, LDA, and MLRM, we evaluate the feasibility to identify positive COVID-19 patients from healthy persons. The database was constituted by n= 1275, obtained from 1209 healthy persons and 66 COVID-19 patients. The gender and age of the patients are presented in Table 1.
Table 1 Information of the patients analyzed.
| Patients | |||
|---|---|---|---|
| Population | Gender | Samples | Age ± 𝑆𝑆𝑆 |
| Healthy | Male | 496 | 60.5 ± 8.6 |
| Females | 713 | ||
| COVID-19 | Male | 54 | 51.3 ± 12.8 |
| Females | 12 | ||
*SD: Standard deviation.
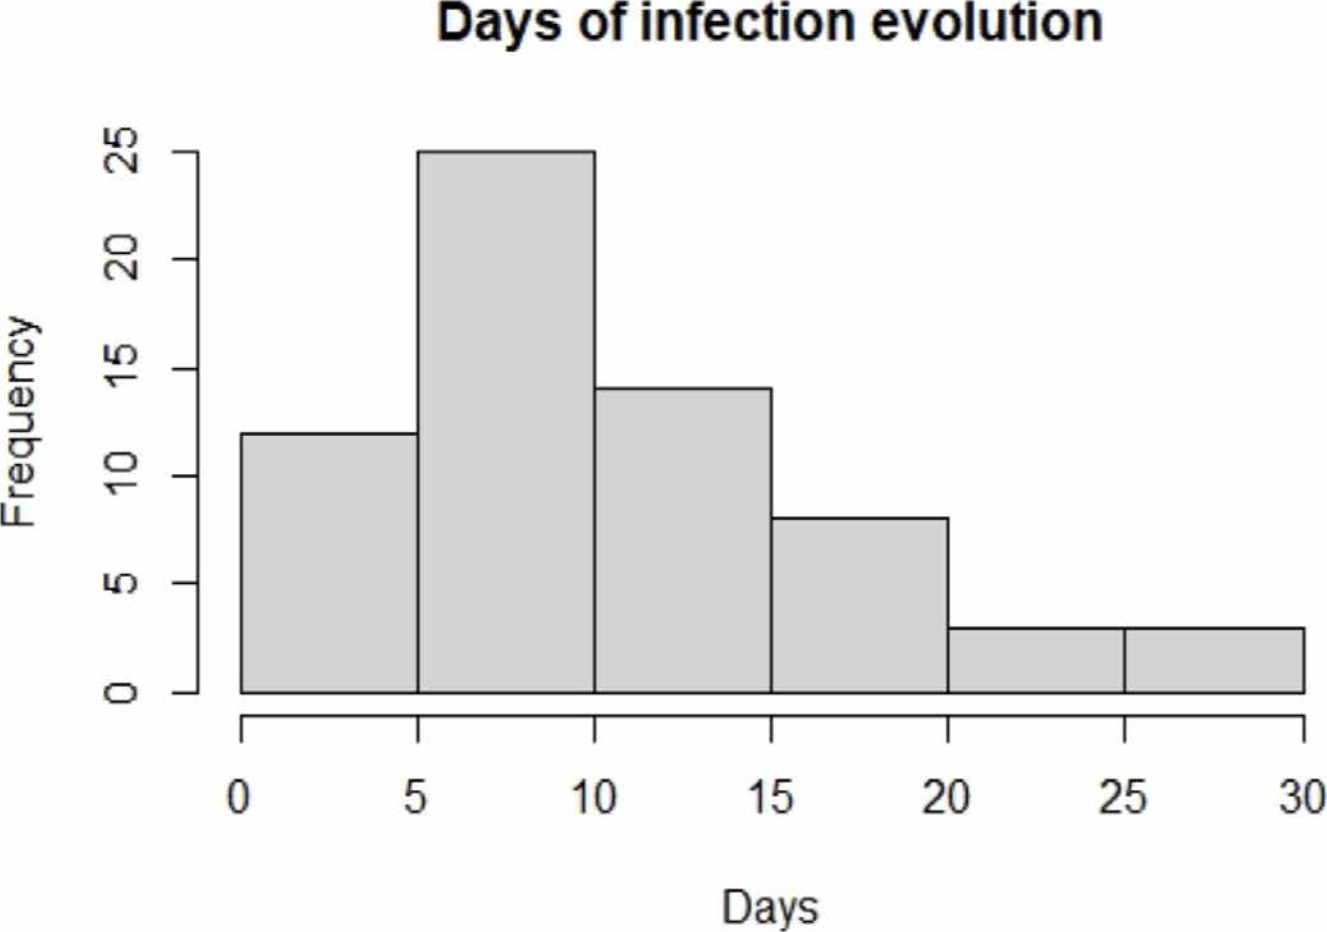
The evolution from the disease diagnosis to the taking of samples is shown in Figure 1; it is possible to appreciate that the days of the infection evolution of the majority of the population was between 5 and 10 days, the period in which the highest efficacy of PCR test is reported [7] [9]. Besides, it is possible to observe that a large part of our population was diagnosed between 1-4 days and 11-30 days after infection.
The effects of drying the sample can be seen in Figure 2, once the sample dries, it is possible to see the main macromolecules of a biological sample: lipids (3000-2800 cm-1), proteins (1700-1600 cm-1 and 1560-1500 cm-1 where vibrations associated with amides I and II are reported), and nucleic acids (1250-1000 cm-1) [13] [22].
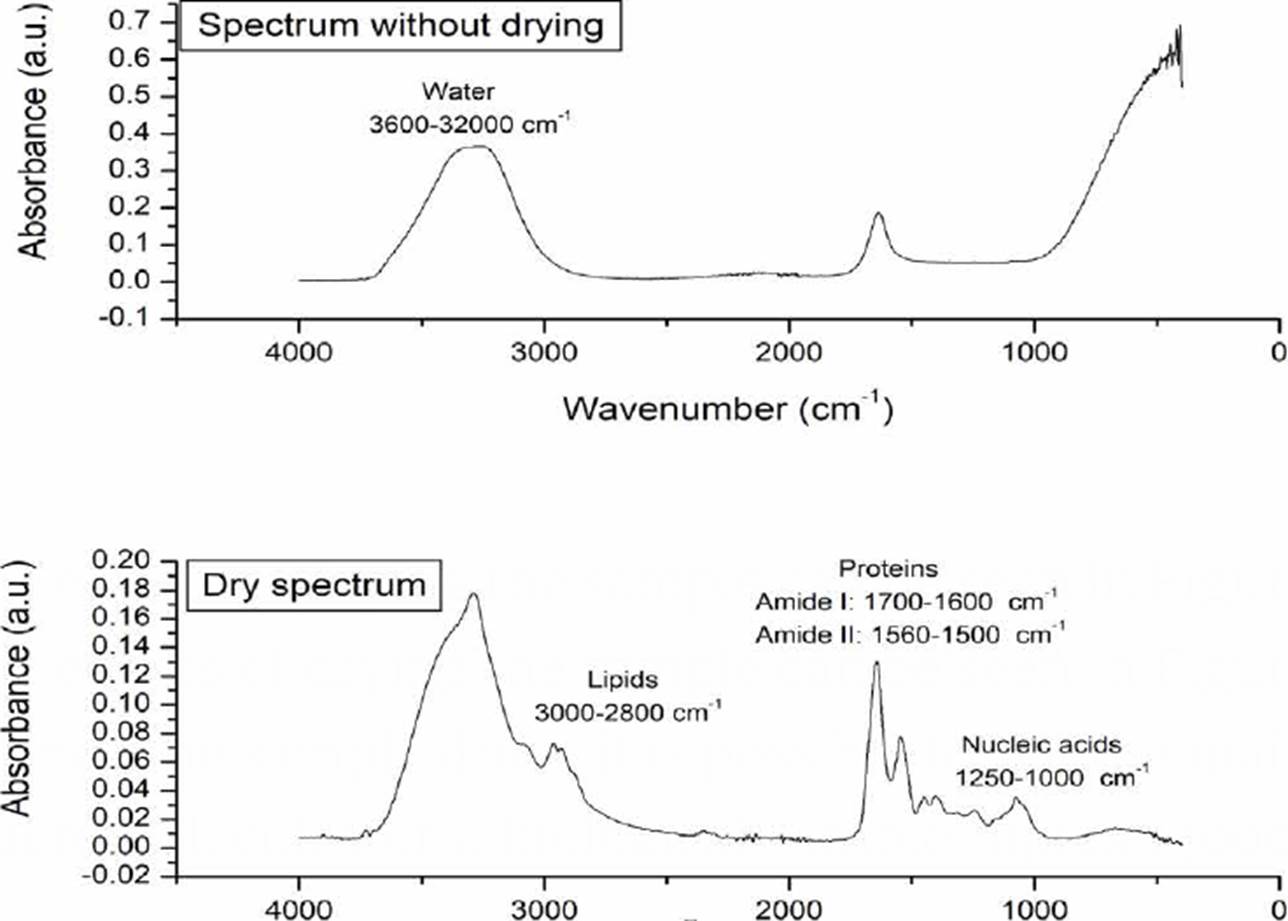
Figure 2 Morphological changes of the sample associated with the drying process. In the dry spectrum, the main macromolecules of a biological sample are indicated.
To have a first indicator of the subregions that most contrast the populations, we average the spectra of each of the populations and compare them as shown in Figure 3, two types of differences between the populations were observed: in the amide protein regions (1700-1600 cm-1 and 1560-1500 cm-1), a considerable displacement in COVID-19 patients is observed, while in the nucleic acid, higher absorbance values in COVID-19 spectra are shown attributed to glycogen and other carbohydrates.
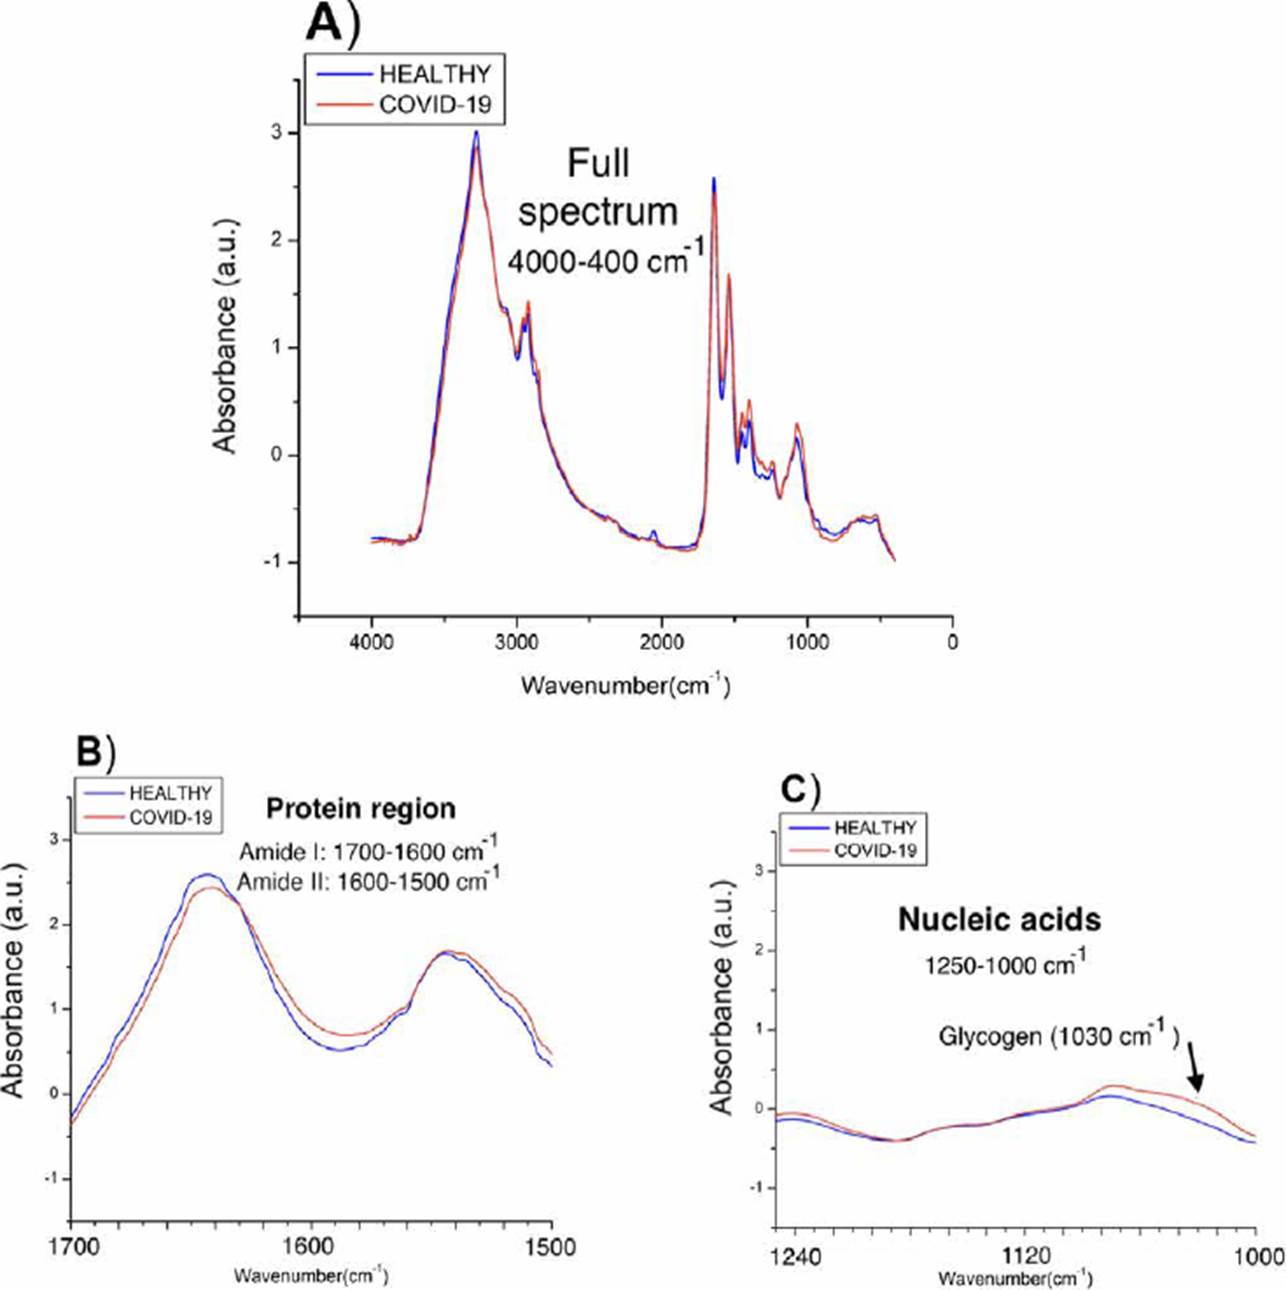
Figure 3 Spectra obtained from the medians of the absorbances of each population. A) Complete spectra in the mid-infrared region (4000-400 cm-1), B) Proteins region (1700-1500 cm-1), C) Nucleic acids region (1250-1000 cm-1).
Using ANNs, SVMs, KNN, LDA, and MLRM we independently evaluate different regions of the FTIR spectrum, the full spectrum (4000-400 cm-1), lipids (30002800 cm-1), biological fingerprint (B.F.,1800-900 cm-1) [20], amide I (1700-1600 cm-1), amide II (1560-1500 cm-1), and nucleic acids (1250-1000 cm-1) to determine if it is possible to discriminate between both populations. Through LOOCV, we first determined the region that could be associated with the viral infection. Once the region and the machine learning technique allowed us to obtain the best results were identified, we used the Hold-Out methodology to evaluate the performance of the proposed methodology according to the size of samples that make up our database [30] [31] [32]. The results obtained are presented in the following subsections.
ANNs performance
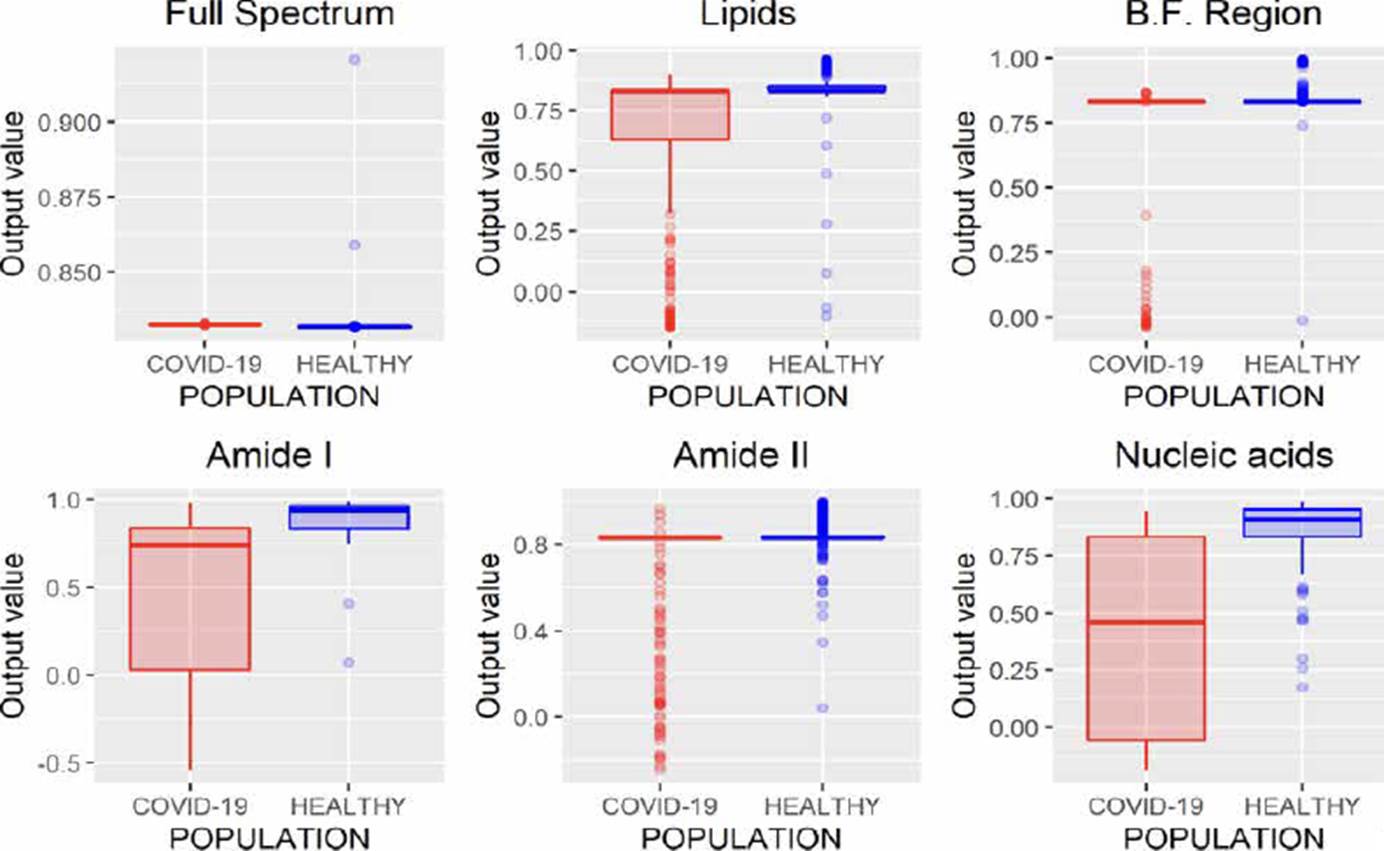
ANNs can be used to model regression (ANNr) and classification (ANNc) problems [30]. The main difference between both methodologies is the type of variable to be predicted, while in classification problems, the variable is categorical; in regression, it is numerical. After evaluating the different spectral regions by ANNr, we obtained the results presented in Figure 4, where it can be observed that using the entire spectrum, it is possible to build a regression model to characterize both populations.

Figure 4 ANNr performance analyzing different regions of the FTIR spectrum (B.F., biological fingerprint region).
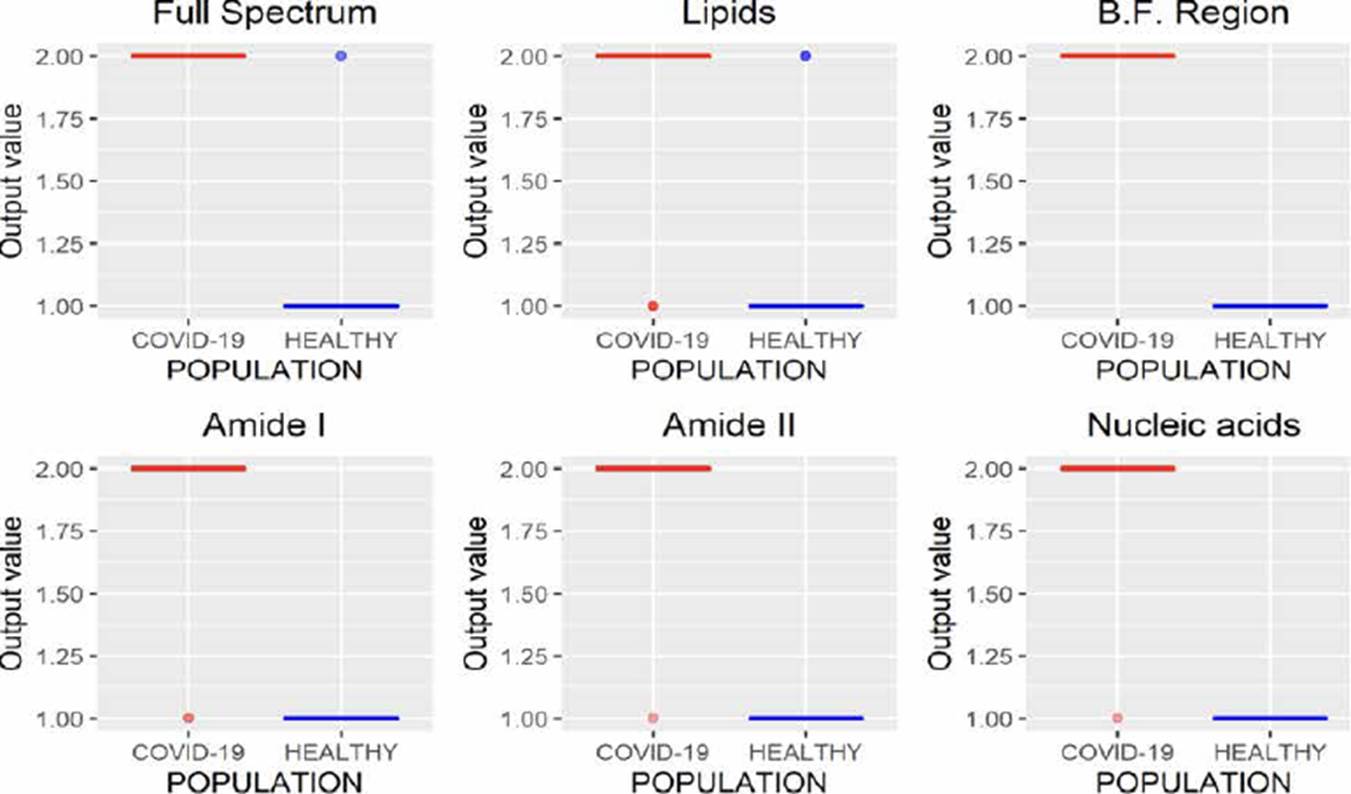
In Figure 5, the results using ANNc are observed, where it can be noticed that it is impossible to distinguish each population, unlike ANNr that allows characterizing both populations when the entire FTIR spectrum is analyzed (Figure 4).
SVMs performance
Similar to ANNs, SVMs allow developing regression (SVMr) and classification (SVMc) models. The results obtained through regression models are presented in Figure 6, where it is possible to note that analyzing the entire spectrum, the B.F. region, and amide I, both populations can be discriminated, highlighting that only one spectrum is misclassified in these three regions. Nevertheless, considering that amide I region employees have fewer variables (wavenumbers) than the full spectrum and nucleic acid region, it is of greater interest to use this region to contemplate the processing time.
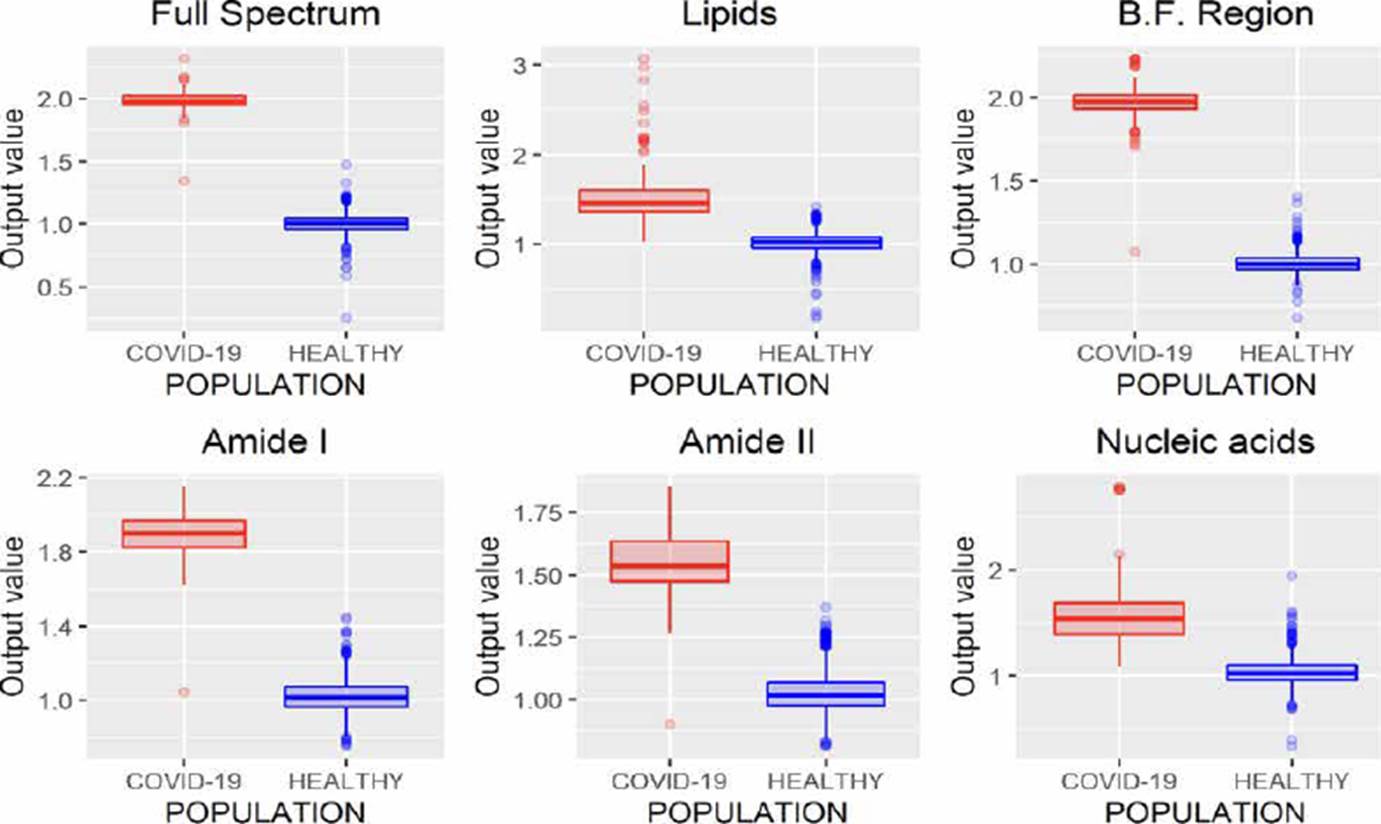
Figure 6 SVMr performance analyzing different regions of the FTIR spectrum (B.F., biological fingerprint region).
Similarly, to SVMr, SVMc allows to obtain considerable results from the study of the complete spectrum, the B.F. and the region associated with amide I, Figure 7.
KNN performance
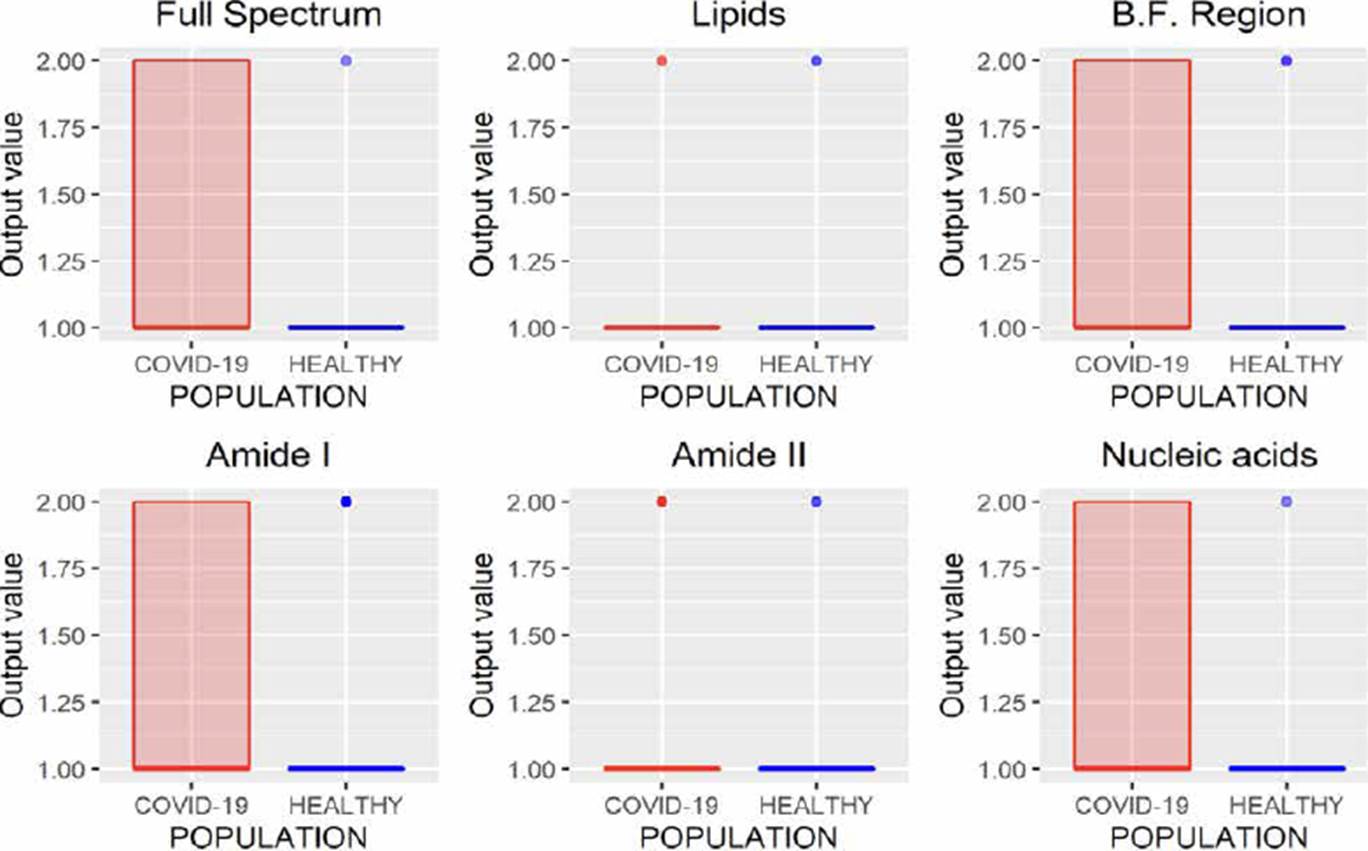
KNN is a classification algorithm used to categorize objects based on their proximity to K nearest objects grouped in the training set [20]. The results obtained using this methodology are presented in Figure 8, where we can infer that the variations in the absorbances of the spectra of the same class make it difficult to use this technique in the task of characterizing populations from FTIR spectra of saliva samples since in all cases false positives were identified.
LDA performance
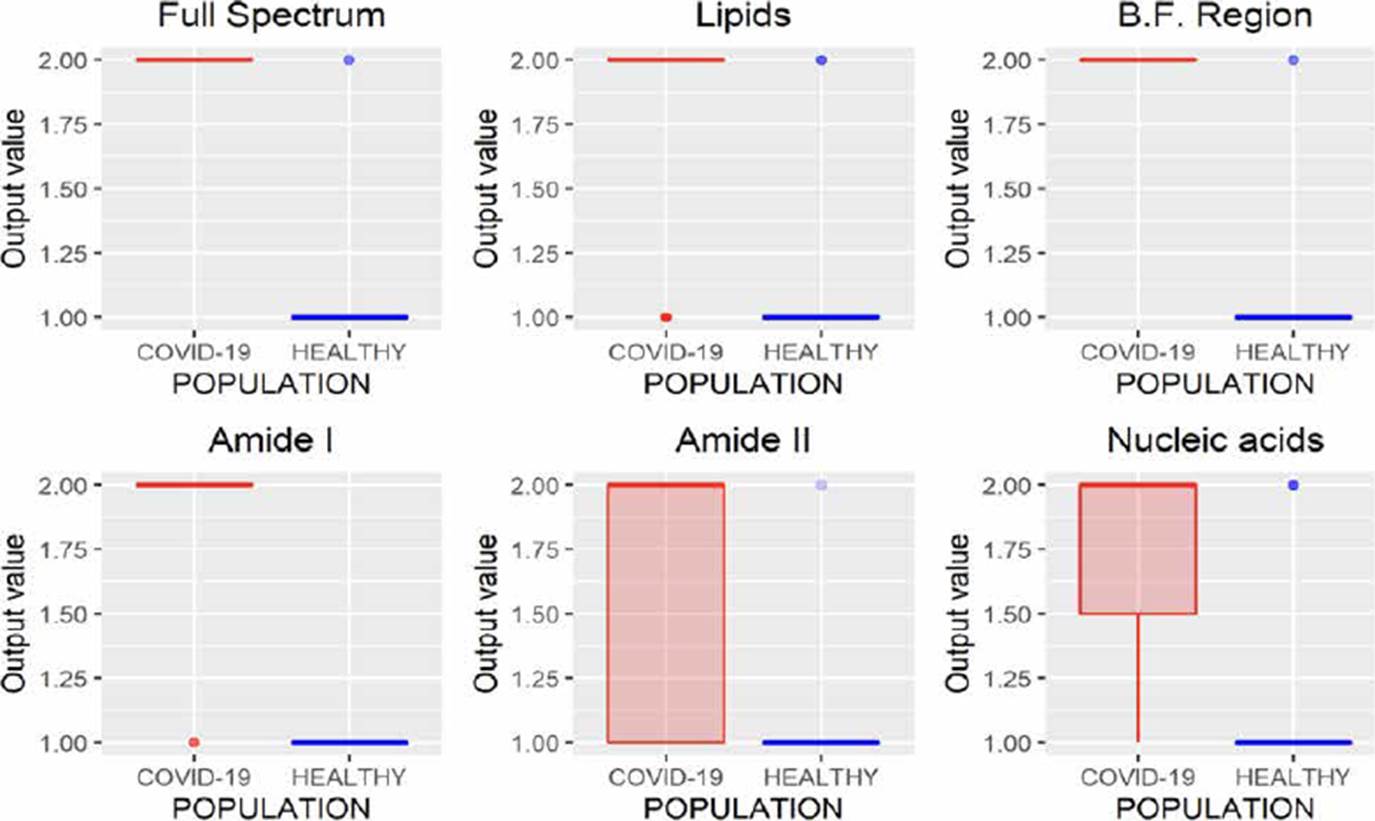
LDA is a classification methodology also known as Fisher’s linear discriminant (FLD). In this method, training and test sets are projected into the same subspace, and the similarities between these data sets are identified. The results obtained by this technique are presented in Figure 9, where it is observed that using the B.F., it is possible to characterize the spectra correctly. Besides analyzing the amide I and II regions, good results were obtained since only eight and five infected patients were incorrectly identified as healthy patients.
MLRM performance
MLRM is a regression model based on a simple linear regression analysis with a difference that considers more than one independent variable to estimate the independent variable's value. In Figure 10, the results of MLRM are depicted;we can observe that it is possible to perform the characterization of the spectra reliably by analyzing the B.F., amide I, and amide II regions, allowing one error. However, the results obtained using the amide I region showed a minor variance than those obtained by analyzing amide II; moreover, this region requires fewer variables concerning the B.F. region (1700 wavenumbers less), allowing the study less time.

Unlike regression models (ANNr, SVMr, MLRM), where the variables to be predicted are data with continuous values, classification models (ANNc, SVMc, KNN, LDA) restrict the use of the variable to be predicted, since being categorical, it is not possible to use them to solve a system of equations as in regression models. Although in Figures 5, 7, 8, 9, where the results of the evaluation of classification models are presented, it is possible to see numerical data on the abscissa axis when COVID-19 or HEALTHY should only appear, it was defined that, for its graphing, the value of 1 was adopted for a prediction associated with the HEALTHY group by the classification model and 2 for a COVID-19 prediction, the above due to the fact that the function used for plotting implemented through the #include <QBoxPlotSeries> library in the c++ language requires a numerical value on this axis. Figures 4-10 present the results obtained by the different classification/regression methods previously mentioned using the LOOCV methodology employing box plots. The purpose of the exercise is to select the technique that allows the best possible distance between both populations (COVID-19 and healthy) on the vertical axis, analyzing either the entire spectrum or a subregion of the spectrum. Considering the above, we can observe that the best options obtained to identify the populations using the least possible information are SVMr and MLRM since only one error was obtained by analyzing only the region associated with amide I (1700-1600 cm-1).
Table 2 summarizes the behavior of both methodologies (SVMr and MLRM), analyzing the amide I (17001600 cm-1) region. It is possible to observe that there is a COVID-19 spectrum wrongly categorized by both methodologies. Although it is possible to obtain similar accuracy, sensitivity, and specificity metrics for the analyzed database, both methodologies' performance is not the same. In Figure 11, we present the SVM and MLRM methodologies' output values' distribution, appreciating that both techniques erroneously classify a single spectrum of 1275 that make up the database. However, the MLRM output values' dispersion suggests that it is the most reliable method to correctly identify a COVID-19 positive patient.
Table 2 Outputs ranges of the SVMr and MLRM methodologies for the 1275 spectra in the database using LOOCV.
| Algorithm behavior | ||||||
|---|---|---|---|---|---|---|
| Method | Population | Output | A | Se | Sp | |
| Min | Max | |||||
| SVMr | COVID-19 | 1.04 | 2.14 | 99 | 98.5 | 100 |
| Healthy | 0.75 | 1.44 | ||||
| MLRM | COVID-19 | 0.99 | 2.21 | 99 | 98.5 | 100 |
| Healthy | 0.75 | 1.28 | ||||
*A: Accuracy, Se:Sensibility, Sp: Specificity.
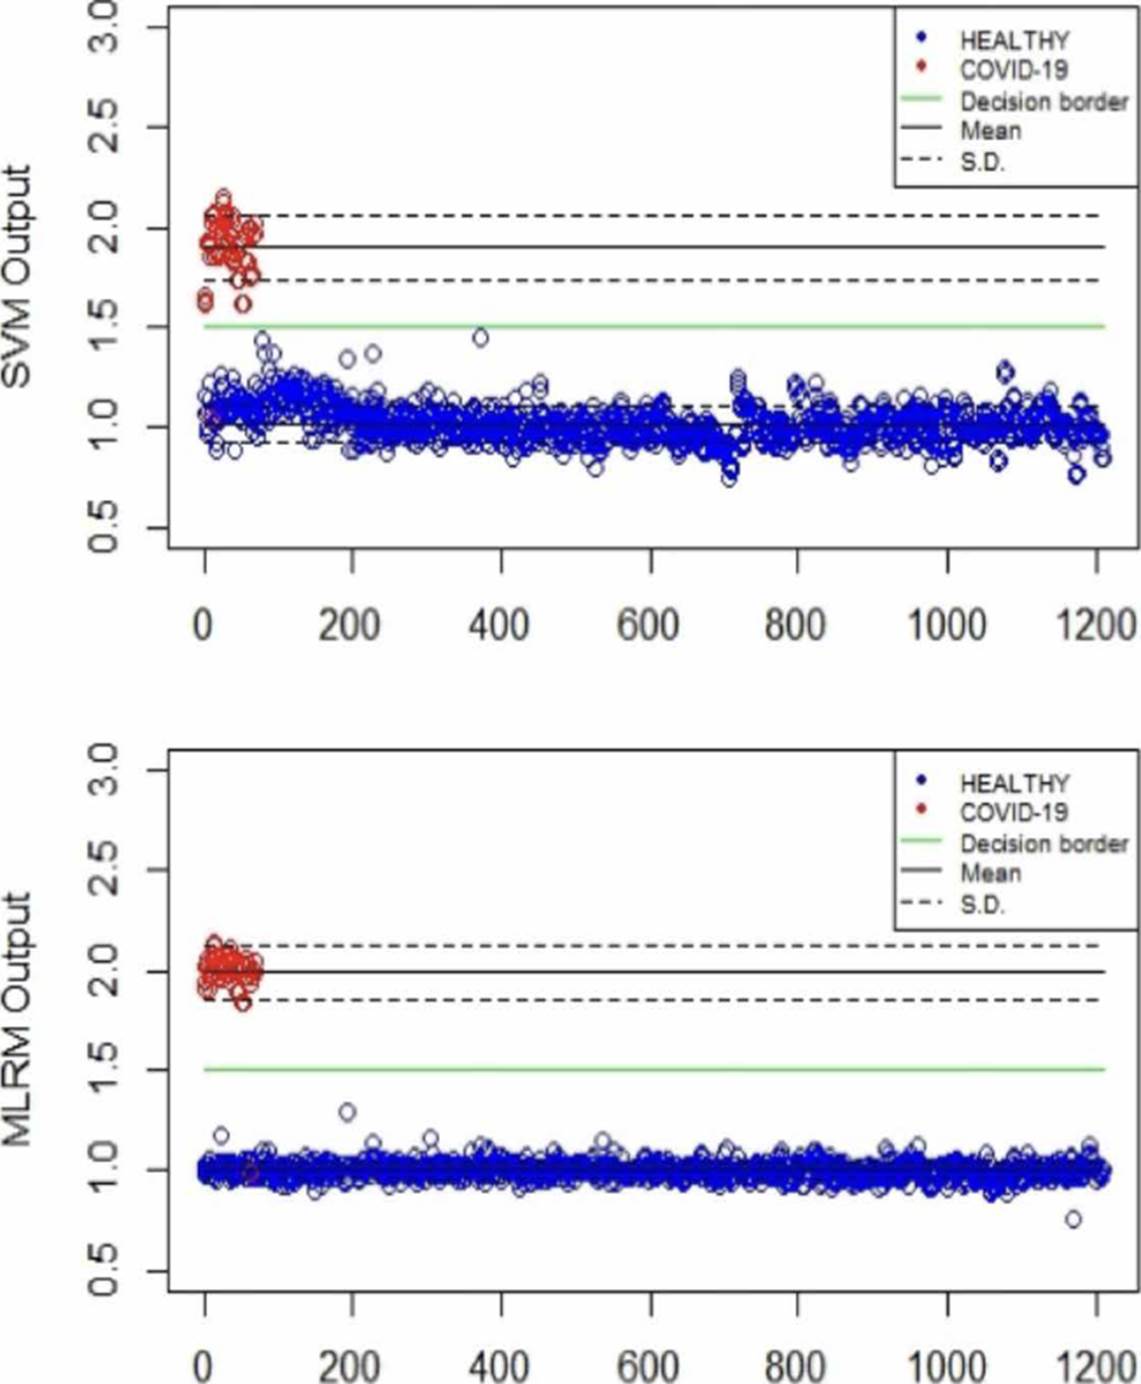
Figure 11 Distribution of the SVM and MLRM techniques' output values analyzing the amide I region using LOOCV.
Moreover, in Figure 11, we can see that the MLRM outputs presented are more compact for both populations concerning SVMr. In the same way, in Table 3, some statistical parameters obtained from the analysis of the output values of the methodologies, including determination coefficient (r2), are presented; highlighting that it is possible to obtain a regression model that presents accuracy employing MLRM due to the r2 obtained. The outputs present a lower standard deviation that suggests that this technique will perform better with a more extensive database.
Table 3 Statistical analyses of SVMr and MLRM outputs obtained with a LOOCV methodology.
| Algorithm behavior | |||||
|---|---|---|---|---|---|
| Method | Population | Output | S.D. | r2 | |
| Min | Max | ||||
| SVMr | COVID-19 | 1.04 | 2.14 | 0.16 | 0.91 |
| Healthy | 0.75 | 1.44 | 0.08 | ||
| MLRM | COVID-19 | 0.99 | 2.21 | 0.13 | 0.97 |
| Healthy | 0.75 | 1.28 | 0.03 | ||
*S.D. : Standard deviation, r2: determination coefficient.
Some authors have declared that employing a database with considerable numbers of samples, it is desirable to evaluate the model using random subset selection techniques in addition to LOOCV [20] [28] [30]. So, we also evaluate the performance of the MLRM considering only the amide I region through the Hold-Out methodology with a partition of 80 % of the spectra used in training (1020 spectrum), and 20 % (255, 242 belong to the control group and 13 to the COVID-19 group) in the evaluation process [28] [33]. To better understand the model's performance using this methodology, we repeat the exercise 6 times. The results are presented in Figure 12.

From Figure 12, it is possible to infer that the use of MLRM will hold better results increasing the database spectra once the outputs of this regression method presented a considerable distance between them. According to [33] [34], the performance of machine learning techniques could be related to the number of samples that we provide them in the training process, so, to prove the performance of the MLRM model with a similar sample quantity than COVID-19 population, we randomly select 66 samples of the control group and evaluate its accuracy through hold out, we repeated this exercise 6 times and the results are presented in Figure 13, the outputs of the MLRM model when a virus carrier spectra is evaluated are presented in red points, while the non-infected samples are shown in blue points; it is possible to appreciate that the accuracy, similar to the result presented in Figure 12 with all the samples in control group (1207) still is 100 %.

Table 4 Statistical analyses of MLRM outputs obtained with a Hold Out methodology.
| Algorithm behavior | ||||
|---|---|---|---|---|
| Iteration | Population | Output | S.D. | |
| Min | Max | |||
| 1 | COVID-19 | 1.90 | 2.07 | 0.0517 |
| CONTROL | 0.90 | 1.087 | 0.0525 | |
| 2 | COVID-19 | 1.96 | 2.03 | 0.0215 |
| CONTROL | 0.77 | 1.12 | 0.101 | |
| 3 | COVID-19 | 1.92 | 2.06 | 0.0427 |
| CONTROL | 0.71 | 1.09 | 0.101 | |
| 4 | COVID-19 | 1.86 | 2.0 | 0.0700 |
| CONTROL | 0.85 | 1.11 | 0.067 | |
| 5 | COVID-19 | 1.86 | 2.07 | 0.055 |
| CONTROL | 0.55 | 1.08 | 0.135 | |
| 6 | COVID-19 | 1.95 | 2.09 | 0.0558 |
| CONTROL | 0.88 | 1.12 | 0.0690 | |
*S.D.: Standard deviation.
The statistical analysis of the 6 exercises presented in Figure 13 are reported in Table 4; this table shown that despite the variance observed in the standard deviation (S.D.) of the control group, the distance between means and outputs values of both population turn-on the characterization of possible virus carriers reliable Regarding the performance of the MLRM model for the training subset, we present Figure 14, it is possible to observe that as for the evaluation subset, the performance of the model is optimal. It is noted that not only the samples were correctly identified, but also that the separability between the populations is similar to that achieved in the evaluation process.
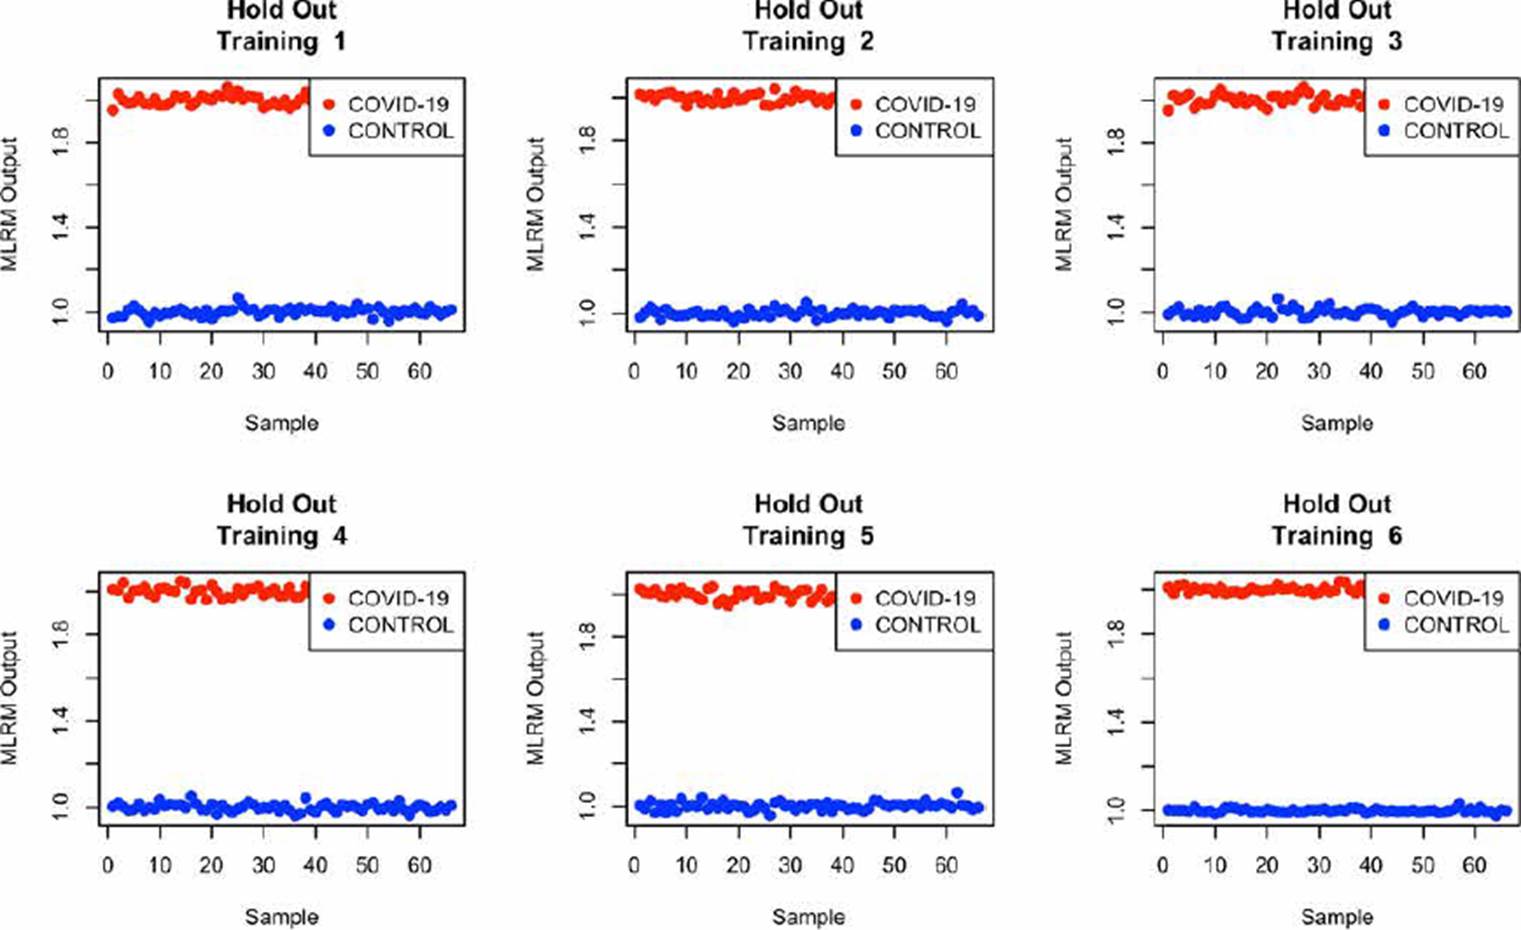
Table 5 shows the output values for each iteration evaluating the training subset.
Table 5 Statistical analyses of MLRM outputs obtained with a Hold Out methodology in the training process.
| Algorithm behavior | ||||
|---|---|---|---|---|
| Iteration | Population | Output | S.D. | |
| Min | Max | |||
| 1 | COVID-19 | 1.953 | 2.059 | 0.02210 |
| CONTROL | 0.9534 | 1.068 | 0.01948 | |
| 2 | COVID-19 | 1.9574 | 2.0447 | 0.0202 |
| CONTROL | 0.9612 | 1.050 | 0.01757 | |
| 3 | COVID-19 | 1.949 | 2.0607 | 0.0243 |
| CONTROL | 0.9545 | 1.0655 | 0.0186 | |
| 4 | COVID-19 | 1.957 | 2.044 | 0.02021 |
| CONTROL | 0.9612 | 1.0508 | 0.0175 | |
| 5 | COVID-19 | 1.9494 | 2.0607 | 0.0243 |
| CONTROL | 0.9545 | 1.065 | 0.0186 | |
| 6 | COVID-19 | 1.959 | 2.0372 | 0.0151 |
| CONTROL | 0.9761 | 1.033 | 0.00839 | |
*S.D.: Standard deviation.
Considering the ranges of output values for the MLRM model shown in Table 5, it is possible to conclude that, evaluating the training subset, there is no overlap between the results.
The easy spread of SARS-CoV-2 and the lack of effective treatment and diagnosis methodology have contributed to seeking diagnostic methods to avoid the virus's spread. Despite the PCR technique has been adopted as the most reliable diagnosis methodology [2] [3] [4] [5] [8] [9], as previously mentioned, its most significant challenge is the detection of people infected at early stages. Moreover, it cannot be used as a screening diagnosis technique in great populations due to its high cost and specialized personal needs. Herein, we present a novel methodology to detect people positive to COVID-19. Our methodology is based on the analysis of the FTIR spectra of saliva samples using machine learning techniques.
In contrast to PCR that punctually detects the gene associated with a particular viral infection, the FTIR technique allows detecting the bonds of a sample's molecular components through its interaction with different electromagnetic frequencies [11] [12]. The intersection of the same bonds of all sample components has made it difficult to use this clinical diagnosis technique because of the need for complex mathematical models to find a specific spectral behavior attributable to pathology. To deal with this problem, some researchers have already coupled FTIR with machine learning in order to characterize populations with SARS-CoV-2 [14] [15] [16] [17] [18].
In the same way as [16] [18], the results obtained in this research work suggest that MLRM and SVMr turn out to be the best options to characterize FTIR spectra of patients with and without COVID-19 although the analyzed samples differ. Despite the fact that the good results presented by the authors of the aforementioned works would allow the development of a robust strategy for a preliminary analysis of possible carriers of the virus, the nature of the samples analyzed, serum and RNA respectively, involve specialized personnel and reagents to process the samples are necessary in contrast to the method described here. It is also necessary to consider the hypothesis that the difference in the percentages of accuracy, sensitivity, and specificity, despite using similar strategies between [16] [18] and the present one, could be attributed to storage time, since the authors of, report having stored the specimens for a period longer than that considered in this work.
The results achieved in this work, could open a window for the development of an electronic device that allows identifying patients infected by the virus in a non-invasive way. Such a device could have a good performance considering only the frequencies associated with the wavenumbers (1700-1600 cm-1) attributed to amide I, since as Figures 10-13 indicate, it is where the MLRM model has better performance.
CONCLUSIONS
In this work, we evaluate the performance of different classification techniques to propose an agile, reliable, non-invasive, and cheap methodology. For this purpose, we analyze the FTIR spectra of saliva samples. After analyzing six different regions of each one of the 1275 spectra that make up our database with four different classification techniques commonly used in the machine learning area, we conclude that it is possible to characterize both populations by analyzing the amide I region (1700-1600 cm-1) through MLRM, showing percentages of accuracy, sensitivity, and specificity of 99%, 98.5 %, and 100 %, respectively.
Considering that the disparity in terms of samples could be a factor that masked the effectiveness of the proposed method, 6 sub-databases of the control group were created with the same number of samples as the covid group (66). The results presented in Figure 13 and Table 4 and 5 confirm the effectiveness of the proposed method. Additionally, the distance between the populations as well as the proximity between the results obtained when evaluating samples from the same population by means of MLRM suggest that the proposed method has great possibilities of being applied in a real environment.
However, it is essential to mention that more research needs to be done focusing on each band or region's description to determine if the observed changes are associated with the virus itself or immune response. Also, it is essential to train and evaluate the performance of the model with spectra captured through other spectrometers, this would allow making models that circumvent the noise that the materials could cause. Moreover, it is necessary to increase the positive COVID-19 population to strengthen the results shown in this research.

