


 text new page (beta)
 English (pdf)
 Article in xml format
 Article references
 Send this article by e-mail
 Cited by SciELO
  Similars in
SciELO
Similars in
SciELO 
 Permalink
INTRODUCTION
Currently, mortality caused by chronic respiratory tract diseases is increasing in Mexico and occupied the fourth position in 2020. Chronic obstructive pulmo nary disease (COPD) deaths are 2.49% of total mortal ity nationwide [1]. According to the Global Initiative for Chronic Obstructive Lung Disease, COPD showed a worldwide prevalence of 3.92% in 2017 (95% CI 3.52% - 4.32%). In 2021, the estimated global mortality rate was 42/100,000 (4.72%) and the DALY (Disability Adjusted Life Years) rate was 1068.02/100,000 inhabi tants [2]. COPD is a common, preventable, and treatable disease characterized by persistent respiratory symp toms and airflow limitation due to airway and/or alve olar abnormalities, usually caused by significant expo sure to noxious agents [2] [3]. The initial procedure for diagnosing COPD is spirometry, which is a non-inva sive technique that measures the volume of air that the lungs can mobilize as a function of time [2] [3] [4]. However, the technique may be intolerant to the patient because of the use of a mouthpiece and nose clip, and the spe cific respiratory maneuver to be performed [5] [6] [7].
Vogt et al [8] proposed the use of EIT to visualize the pulmonary ventilatory distribution (PVD) in a group of 35 COPD patients under the influence of an inhaled bronchodilator. Monitoring was performed immedi ately after inhalation and at 5, 10, and 20 minutes.
Signals from the EIT system and an electronic spi rometer were recorded simultaneously. PVD was assessed by estimating the changes in impedance cor responding to the parameters: forced expiratory vol ume in 1 second (FEV1), forced vital capacity (FVC), pulmonary circulating volume (VC), peak flow (PF), and forced expiratory flow between 25 % and 75% of the FVC (FEF25-75%). The FEV1/FVC parameter was estimated from the elements of the EIT image to assess the post-bronchodilator effect in a regional manner. Only 17 showed a significant bronchodilator response. The FEV1 parameter and CV changes showed significant correlations with the impedance changes of the regions of interest of the EIT images in patients with bronchodilator response [8].
Due to the above, this work proposes the use of the electrical impedance tomography (EIT) technique to measure the FVC, FEV1, and FEV1/FVC parameters from the respiratory recording obtained by EIT, ana lyzing the frequency components implicit in the changes in lung tidal volume. The objective of this study is to obtain a set of mathematical calibration models that adjust the module's frequency compo nents powers (dB) and the phase of the impedance signal due to lung tidal volume obtained by EIT, to estimate the FVC, FEV1, and FEV1/FVC parameters.
MATERIALS AND METHODS
Pneumotachograph
Circulating volume measurements were obtained by a MedGraphics prevent TM Pneumotach kit (St. Paul, MN, USA). This system allows continuous recording of flow and time signals, both graphically and numeri cally. According to the standardized protocol, calibra tion was performed using a 3L syringe [9].
Electrical Impedance Tomography (EIT)
EIT was carried out with the TIE4sys system, experi mental equipment designed by the Electronic Engineering Department of the Universitat Politècnica de Catalunya, Barcelona, Spain. The equipment uses 16 electrodes (Red Dot 2560 - 3 M, London, Ontario, Canada) placed around the chest, following the stan dardized protocol [10]. The calibration of the EIT system was performed on an arrangement of electrical resis tance of 330 ohms as described in [11]. TIE4sys acquires images/s and applies an alternating electrical cur rent of 1 mA at 48 kHz through two adjacent elec trodes. A differential voltage is detected across a pair of electrodes whose position is moved adjacently across the main 16-electrode array. Once the voltage measurement cycle is finished, the injector pair moves to its adjacent position, starting a new measurement cycle. The measurement cycle ends when all elec trodes have been used as current injectors and voltage detectors [11] [12]. EIT images are obtained using a weighted back-projection reconstruction algorithm. The EIT images are referential, a reference image is used to obtain subsequent images. This is recon structed by obtaining and averaging 200 images corre sponding to a lapse of 12 seconds of breathing [13].
Participants
A group of 15 patients diagnosed with COPD was ana lyzed. A spirometry test was performed and forced vital capacity (FVC), forced expiratory volume in 1 second (FEV1), and the ratio of the above parameters (FEV1/FVC) was also recorded. The examinations were carried out between 9:00 a.m. and 12:00 p.m. in a room with an ambient temperature of 25°C, 60% humidity, and at sea level. All of them voluntarily agreed to participate in the study, which had been pre viously approved by the center's Ethics Committee (Comité de Ética de la Secretaría de Salud del Estado de Guanajuato, México, del Hospital General de León, Approval Folio Number: GTSSA002101-364).
Procedure
The pneumotachometer and the TIE4sys were simul taneously connected to each participant. Changes in the participants' circulating volume were recorded over 30 s, with a 3-min break between measurements. The number of cycles recorded for each individual var ied between 20 and 25. For each respiratory exercise, 510 impedance measurements were recorded. In this study, three respiratory maneuvers per patient were acquired.
The data were analyzed and processed using the Python computer program [14]. A convolution of the three respiratory signals was performed [15]. In this case, the product of the first two signals was obtained and the resulting signal was convolved with the third, obtaining the analysis signal. Subsequently, the result ing signal was analyzed by applying the Fast Fourier Transform (FFT). FFT is a mathematical process that transforms any time-varying signal into a frequency spectrum (FS) [16]. The FS was reconstructed with 182 data, dividing it into seven segments (from R1 to R7), each with 26 data, the minimum statistically signifi cant amount to be analyzed independently. Segment R1 was defined between 0-117.49mHz, R2 between 156.66mHz-274.15mHz, R3 between 313.32mHz- 430.18mHz, R4 between 469.98mHz-587.47mHz, R5 between 626.64mHz-744.13mHz, R6 between 783.30mHz-900. mHz and R7 between 939.95mHz- 1.06Hz. The area under the curve (AuC) was estimated for each segment. The AuC is used to normalize the estimates of means or quartiles of each segment.
Statistical analysis
The normal distribution of the data of each frequency segment was analyzed using the Shapiro-Wilk statisti cal test (S-W, significance value p<0.05). The correla tion between the means and the FVC, FEV1, and FVC/ FEV1 parameters was performed using the Pearson statistical test, establishing a significance of p<0.05. The correlation between the quartiles and the FVC, FEV1, and FVC/FEV1 parameters was performed through the Spearman statistical test, establishing a significance of p<0.05. The mathematical models to determine the spirometry parameters either in terms of means (S-W with p>0.05) or quartiles (S-W with p<0.05) were obtained from linear regression, estab lishing a coefficient of determination R2>0.5. The val idation of the obtained data is carried out in case the S-W is greater than 0.05, by means of the T-test for paired data. Otherwise, it is done using the Wilcoxon test. In these tests, a level of significance p>0.05 was established.
Differences in results were analyzed using a Bland and Altman plot [17].
RESULTS AND DISCUSSION
Normality analysis and data representation
The data of the FVC, FEV1 and FEV1/FVC parameters evidenced a normal distribution (S-W p>0.05), therefore, they are represented in terms of means (±SD). The power determinations of the seven frequency segments did not show a normal distribution (S-W p<0.05), so, they are represented in terms of 25%, 50%, and 75% quartiles. Statistical analysis of these data was performed with Spearman's correlation coefficient and Wilcoxon's test.
The mean values of FVC, FEV1 and FEV1/FVC were 70%±14%, 46%±12%, and 46%±7%, respectively. The distribution of the powers corresponding to the seven frequency segments obtained from the module and phase are shown in Table 1.
Table 1 Distribution of the powers (in decibels, dB) of the seven frequency segments that make up the changes in pulmonary ventilation obtained by EIT corresponding to the 15 patients with COPD.
| FOI1 (mHz) | Impedance Module Powers (dB) | Phase Module Powers (dB) | ||||||
|---|---|---|---|---|---|---|---|---|
| Quartile at | Q25%2 | Q50%3 | Q75%4 | Quartile at | Q25%2 | Q50%3 | Q75%4 | |
| 0* - 117.49 | 25% | 0.107 | 0.201 | 0.279 | 25% | 0.070 | 0.125 | 0.306 |
| 50% | 0.282 | 0.309 | 0.332 | 50% | 0.297 | 0.333 | 0.339 | |
| 75% | 0.373 | 0.506 | 0.675 | 75% | 0.388 | 0.530 | 0.635 | |
| 156.66 - 274.15 | 25% | 0.041 | 0.100 | 0.135 | 25% | 0.114 | 0.210 | 0.248 |
| 50% | 0.214 | 0.292 | 0.317 | 50% | 0.310 | 0.330 | 0.337 | |
| 75% | 0.479 | 0.567 | 0.697 | 75% | 0.433 | 0.468 | 0.505 | |
| 313.32 - 430.18 | 25% | 0.048 | 0.088 | 0.164 | 25% | 0.151 | 0.212 | 0.290 |
| 50% | 0.152 | 0.211 | 0.279 | 50% | 0.312 | 0.330 | 0.335 | |
| 75% | 0.523 | 0.609 | 0.731 | 75% | 0.376 | 0.428 | 0.567 | |
| 469.98 - 587.47 | 25% | 0.067 | 0.116 | 0.207 | 25% | 0.249 | 0.293 | 0.314 |
| 50% | 0.189 | 0.271 | 0.337 | 50% | 0.326 | 0.333 | 0.357 | |
| 75% | 0.509 | 0.649 | 0.736 | 75% | 0.350 | 0.372 | 0.466 | |
| 626.64 - 744.13 | 25% | 0.114 | 0.212 | 0.258 | 25% | 0.147 | 0.267 | 0.314 |
| 50% | 0.279 | 0.312 | 0.346 | 50% | 0.304 | 0.333 | 0.339 | |
| 75% | 0.396 | 0.477 | 0.604 | 75% | 0.359 | 0.441 | 0.579 | |
| 783.30 - 900.79 | 25% | 0.208 | 0.254 | 0.289 | 25% | 0.231 | 0.287 | 0.306 |
| 50% | 0.294 | 0.331 | 0.342 | 50% | 0.324 | 0.333 | 0.335 | |
| 75% | 0.371 | 0.411 | 0.451 | 75% | 0.352 | 0.381 | 0.425 | |
| 939.95 - 1060 | 25% | 0.239 | 0.261 | 0.307 | 25% | 0.220 | 0.254 | 0.315 |
| 50% | 0.301 | 0.332 | 0.340 | 50% | 0.331 | 0.333 | 0.343 | |
| 75% | 0.354 | 0.391 | 0.462 | 75% | 0.363 | 0.414 | 0.487 | |
1FOI: Frequencies of Interest, seven frequency segments in mHz expressed in terms of powers (decibels, dB). The dispersion of these powers is expressed in terms of quartiles (25%, 50%, and 75%) because these data do not show a normal distribution.
2Q25%, 25% quartile of power data.
3Q50%, 50% quartile of power data.
4Q75%, 75% quartile of power data.
*- zero indicates theoretical value
Correlations between spirometry parameters and powers of frequency segments
In the case of the frequency components of the impedance module, significant correlations of approximately 70% were found between: 1) the three quartiles of frequency segment 7 and the FVC; 2) between the 50% quartile of segment 7 and FEV1; and 3) the 75% quartile of frequency segment 2 and the FEV1/FVC. In the case of the frequency compo nents of the impedance phase, significant correla tions of approximately 60%were found between the 25% and 75% quartiles of segments 4 and 7 and the FVC, respectively; and a correlation greater than 70% between the25%and 75% quartiles of segment 4 and FEV1 (Table 2).
Table 2 Corretation- between the powere of the frequency componentsof the impedance mod ule andphase signals and the spirometric paramefers.
| Powers of the frequency components of the module signal and spirometric parameters | Powers of the frequency components of the phase signal and spirometric parameters | |||||||
|---|---|---|---|---|---|---|---|---|
| FOI1 | Quartile at | FVC2 | FEV13 | FEV1/FVC4 | FOI1 | Quartile at | FVC2 | FEV13 |
| S7 | 25% | -0.682 | - | - | S4 | 25% | -0.632 | -0.737 |
| 50% | -0.731 | -0.732 | - | 75% | 0.646 | 0.789 | ||
| S2 | 75% | 0.693 | - | - | S7 | 25% | -0.600 | - |
| 75% | - | - | -0.698 | 75% | 0.661 | - | ||
1FOI: frequencies of interest: S2 - Segment 2 (156.66 - 274.15 mHz), S4 - Segment 4 (469.98 - 587.47 mHz), S7 - Segment 7 (939.95 mHz - 1.06 Hz).
2FVC: forced vital capacity.
3FEV1: forced expiratory volume in the first second.
4FEV1/FVC: quotient between the parameters FEV1 and FVC.
Mathematical fit models
Five equations were obtained that adjust the powers of the impedance signal module to estimate the 3 spirom etry parameters. Three determine the estimation of the FVC, one - the FEV1 and the rest - the FEV1/FVC. The mean value of the coefficient of determination (R2) of the 5 equations was approximately 54%±11% (Table 3).
Table 3 Linear mathematical models of adjustment for the measurement of the spirometric parameters FVC, FEV1, and FEV1/FVC from the power determinations of the frequency segments.
| Impedance Modulus Equations y = Ax + B |
Impedance Phase Equations y = Ax + B |
||||||||
|---|---|---|---|---|---|---|---|---|---|
| Dep.V (y)1 | Indep.V (x)2 | Coefficients | R2 | Dep.V (y)1 | Indep.V (x) 2 | Coefficients | R2 | ||
| A | B | A | B | ||||||
| FVC | S7_25%3 | -173 | 115 | 0.5 | FVC | PhS4_25%7 | -80 | 92 | 0.1 |
| S7_50%4 | -329 | 175 | 0.7 | PhS4_75%8 | 100 | 29 | 0.3 | ||
| S7_75%5 | 148 | 9 | 0.6 | PhS7_25%9 | -155 | 109 | 0.5 | ||
| FEV1 | S7_50%4 | -233 | 120 | 0.4 | PhS7_75%10 | 111 | 23 | 0.5 | |
| FEV1/FVC | S2_75%6 | -33 | 65 | 0.5 | FEV1 | PhS4_25%7 | -90 | 70 | 0.2 |
| PhS4_75%8 | 88 | 11 | 0.4 | ||||||
1 Dep.V: Dependent variable of the linear equation.
2 Indep.V: Independent variable of linear equation.
3 Quartile at 25% of impedance module power determinations from Segment 7 (939.95 mHz - 1.06 Hz)
4 Quartile at 50% of impedance module power determinations from Segment 7 (939.95 mHz - 1.06 Hz).
5 Quartile at 75% of impedance module power determinations from Segment 7 (939.95 mHz - 1.06 Hz).
6 Quartile at 75% of impedance module power determinations from Segment 2 (156.66 - 274.15 mHz).
7 Quartile at 25% of impedance phase power determinations from Segment 4 (469.98 - 587.47 mHz).
8 Quartile at 75% of impedance phase power determinations from Segment 4 (469.98 - 587.47 mHz).
9 Quartile at 25% of impedance phase power determinations from Segment 7 (939.95 mHz - 1.06 Hz)
10 Quartile at 75% of impedance phase power determinations from Segment 7 (939.95 mHz - 1.06 Hz).
Six equations were obtained that adjust the phase powers to estimate two spirometry parameters. Four of these determine the estimation of the FVC and two of the FEV1. The mean value of the R2 of the 5 equations was approximately 33%±16% (Table 3).
Evaluation of mathematical fit models
The correlation between measured and estimated determinations for FVC, FEV1, and FEV1/FVC was approximately 76% (p<0.001), 65% (p<0.001), and 69% (p<0.001), respectively (Table 4).
Table 4 Evaluation of the mathematical linear fit models (y = Ax + B) for the estimation of the spirometric parameters F TablVe C4, FEV1, and FEV1/FVC.
| Evaluation of the calibration equations of the impedance module | |||||
| Parameter | Indep.V (x)1 | Estimation2 | Correlation3 | Error (%)4 | P-value (T-Student)5 |
| FVC | S7_25%6 | 70 ± 10 | 0.72 (p = 0.002) | 12 ± 7 | 0.937 |
| S7_50%7 | 70 ± 11 | 0.81 (p < 0.001) | 10 ± 6 | 0.926 | |
| S7_75%8 | 71 ± 11 | 0.76 (p = 0.001) | 12 ± 6 | 0.847 | |
| FEV1 | S7_50%7 | 46 ± 8 | 0.65 (p = 0.009) | 19 ± 14 | 0.957 |
| FEV1/FVC | S2_75%9 | 45 ± 5 | 0.69 (p = 0.005) | 10 ± 5 | 0.655 |
| Evaluation of impedance phase calibration equations | |||||
| Parameter | Indep.V (x)1 | Estimation2 | Correlation3 | Error (%)4 | P-value (T-Student)5 |
| FVC | PhS4_25%10 | 70 ± 5 | 0.33 (NS) | 15 ± 9 | 1.000 |
| PhS4_75%11 | 70 ± 8 | 0.55 (p = 0.032) | 13 ± 7 | 0.983 | |
| PhS7_25%12 | 70 ± 9 | 0.68 (p = 0.005) | 12 ± 9 | 0.902 | |
| PhS7_75%13 | 71 ± 10 | 0.68 (p = 0.005) | 12 ± 9 | 0.824 | |
| FEV1 | PhS4_25%10 | 45 ± 5 | 0.42 (NS) | 21 ± 16 | 0.928 |
| PhS4_75%11 | 47 ± 7 | 0.65 (p = 0.009) | 19 ± 17 | 0.542 | |
1 Independent Variable (x) of the adjustment equation. See Table 3.
2 Estimation of the spirometric parameters from the adjustment equations, see Table 3.
3 Pearson's correlation between the theoretical spirometric parameters and those estimated with the adjustment equations, see Table 3.
4 Error percentages of the values estimated with the calibration models of Table 3.
5 Student's t test statistical p-value.
6 Quartile at 25% of impedance module power determinations from Segment 7 (939.95 mHz - 1.06 Hz).
7 Quartile at 50% of impedance module power determinations from Segment 7 (939.95 mHz - 1.06 Hz).
8 Quartile at 75% of impedance module power determinations from Segment 7 (939.95 mHz - 1.06 Hz).
9 Quartile at 75% of impedance module power determinations from Segment 2 (156.66 - 274.15 mHz).
10 Quartile at 25% of impedance phase power determinations from Segment 4 (469.98 - 587.47 mHz).
11 Quartile at 75% of impedance phase power determinations from Segment 4 (469.98 - 587.47 mHz).
12 Quartile at 25% of impedance phase power determinations from Segment 7 (939.95 mHz - 1.06 Hz).
13 Quartile at 75% of impedance phase power determinations from Segment 7 (939.95 mHz - 1.06 Hz).
The average value of the dispersion of the measured FVC, FEV1 and FEV1/FVC determinations and those estimated with the impedance modulus equations (Table 3) were 11% (T-Student p=0.903, acceptability at 95%: ±18 %), 19% (T-Student p=0.957, acceptability at 95%: ±19%) and 10% (p=0.655, acceptability at 95%: +11%/-9%), respectively (Figure 1).
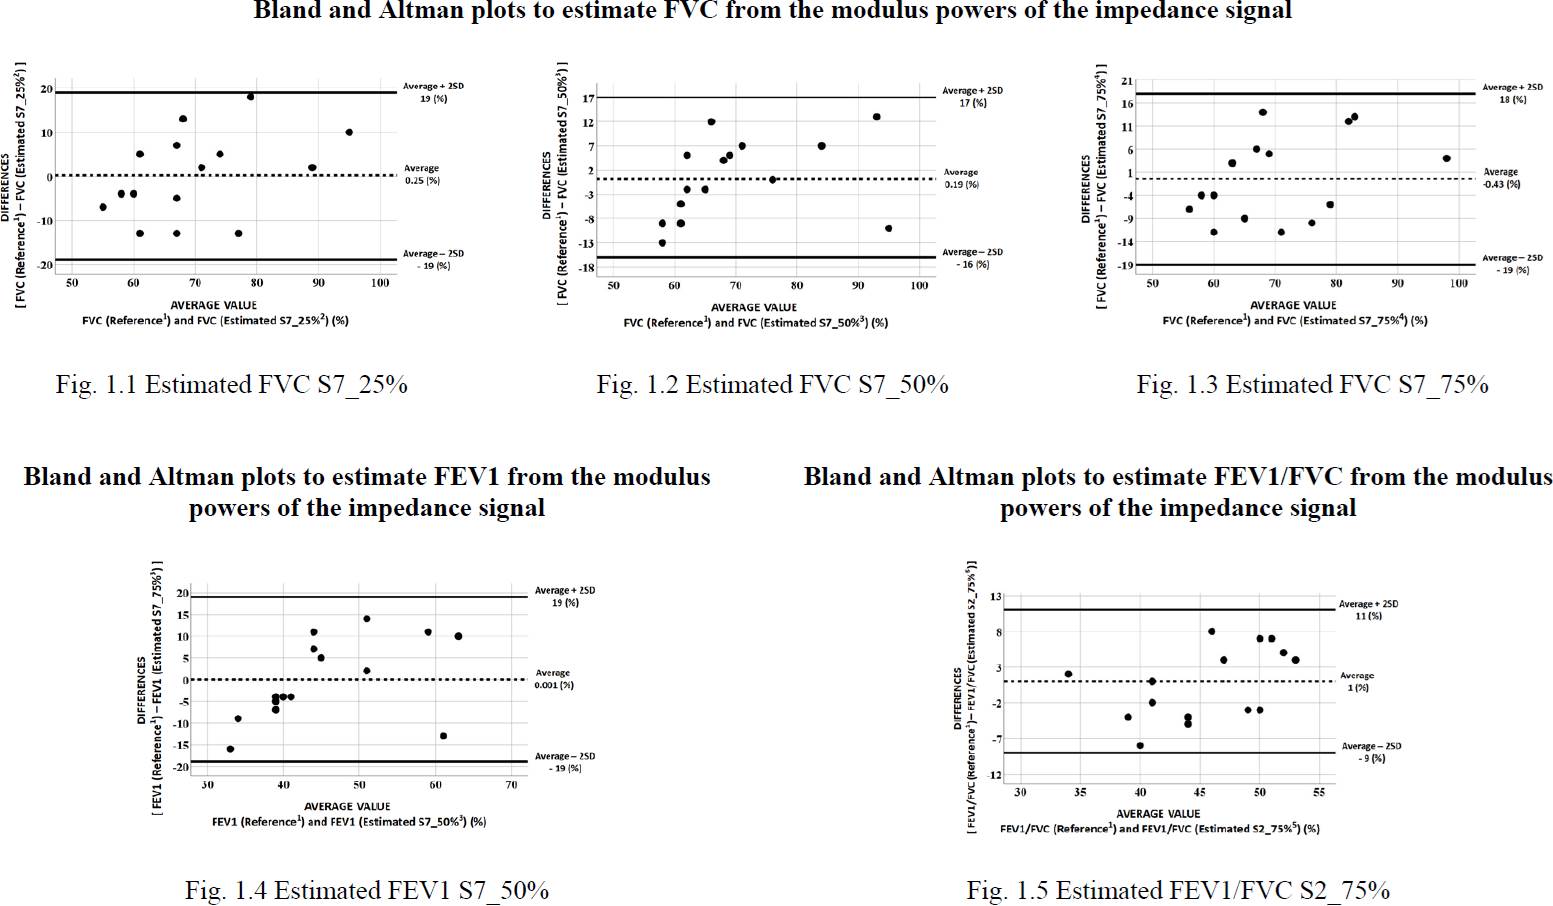
1FVC, FEV1, and FEV1/FVC parameters measured with a spirometer.
2Adjustment equation to estimate FVC determined by the quartile at 25% of the data corresponding to segment 7 (Table 3).
3Adjustment equation to estimate FVC determined by the quartile at 50% of the data corresponding to segment 7 (Table 3).
4Adjustment equation to estimate FVC determined by the quartile at 75% of the data corresponding to segment 7 (Table 3).
5Adjustment equation to estimate FEV1/FVC determined by the quartile at 75% of the data corresponding to segment 2 (Table 3).
Figure 1 Analysis of differences in spirometric parameters (FVC, FEV1, and FEV1/FVC) obtained using spirometry equipment and those obtained based on the powers of the impedance change module obtained using an electrical impedance tomography system.
The correlation between baseline and estimated mea surements for FVC and FEV1 wasapproximately 64% (p < 0.05) and 65% (p<0.01), respectively (Table 4).The mean value of the dispersion of the FVC and FEV1 measure ments obtained with a spirometer and those estimated using the impedance phase adjustment equations (Table 3) were approximately 13% (mean value of p, 0.927, acceptability at 95%: ±23%) and 20% (mean p-value, 0.735, acceptability at 95%: 20%/-21%) (Figure 2).
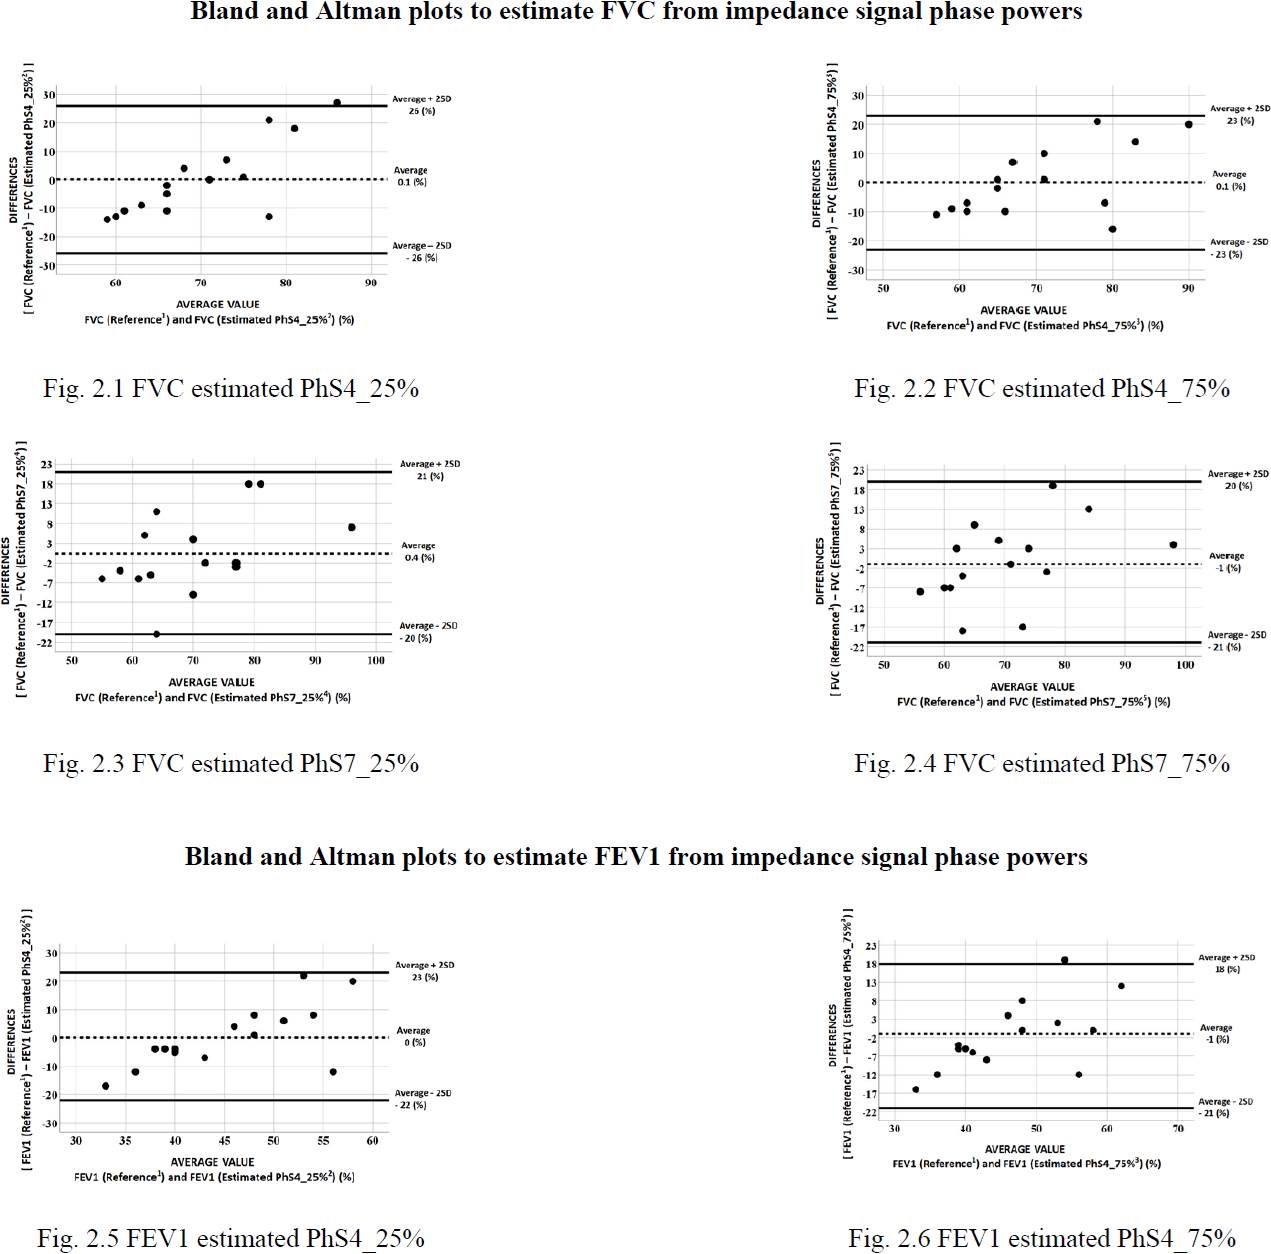
1FVC, FEV1, and FEV1/FVC parameters measured by a spirometer.
2Adjustment equation to estimate FVC determined by the quartile at 25% of the phase powers of segment 4 (Table 3).
3Adjustment equation to estimate FVC determined by the quartile at 75% of the powers of the phase of segment 4 (Table 3).
4Adjustment equation to estimate FVC determined by the quartile at 25% of the powers of the phase of segment 7 (Table 3).
5Adjustment equation to estimate FVC determined by the quartile at 75% of the powers of the phase of segment 7 (Table 3).
Figure 2 Analysis of differences in spirometric parameters (FVC, FEV1, and FEV1/FVC) obtained using spirometry equipment and obtained based on the phase powers of impedance changes obtained using an electrical impedance tomography system.
The objective of this study was to obtain a set of mathematical calibration models that would allow adjusting the frequency powers of the module and the phase of the impedance changes obtained by EIT to estimate the FVC, FEV1, and FEV1/FVC parameters.
The technique implemented to process the changes in impedance was the analysis of the implicit frequency components of the same ventilatory impedance signal. Unlike a pneumotachometer that only records airflow variations, the EIT can detect small variations that originate in the lung parenchymadue to air circulation. These aredetectedby thepenetration of the electrical injection current through the thoracic tissue [18] and are evidencedas a carrier orparasitic signals with different amplitudes and frequencies implicit in the signal.
From the analysis of the impedance module and the three spirometry parameters, correlations of approxi mately 70% were evidenced. The FVC correlated with the three quartiles of segment 7 and 3 adjustment equa tions were obtained with a mean value of R2 of 60% and with a mean correlation between determinations (mea sured and estimated) of 76% (error: 11%, p: NS). FEV1 correlated with the quartile at 50% of segment 7, an equation was obtained with an R2 of 40% with a cor relation between measurements of 65% (error: 20%, p: NS). And the FEV1/FVC ratio with the quartile at 75% of segment 2, an equation with an R2 of 50% and a correla tion of 60% was obtained (error: 10%, p: NS).
From the analysis of the frequency spectrum of the phase and the spirometry parameters, the FVC and FEV1 showed significant correlations of approximately 60%. The FVC with the Q25% and Q75% quartile of segments 4 and 7, respectively. Four equations were obtained with a mean R2 of 35% and a correlation between determinations of 64% (error: 13%, p: NS). Finally, the FEV1 with the quartiles at 25% and 75% of segment 4, two mathematical models were obtained with a mean R2 of 30%, and a correlation between determinations of 54% (error: 20%, p: NS).
Other research groups have proposed various tech niques to process EIT changes. The parameters derived from the processing have been correlated with the spirometry parameters. Milne et al. [19] propose to char acterize ventilatory heterogeneity (HV) from a series of estimated parameters of the changes in circulating volume obtained by means of EIT. Five determina tions were obtained from each element of the EIT images: 1) half-expiratory time (tE), 2) the average difference between the temporal impedance changes of each pixel and the impedance variations corre sponding to the entire image (Phase), 3) the mean amplitude of the impedance changes ^Z), 4) the coef ficient of variation (CV) and 5) the index of heteroge neity (IH). The CV was defined as the ratio of the stan dard deviation and the average of the impedance changes obtained in the entire EIT image.
The IH was estimated in a region of interest (ROI) of 25 pixels where the pixel of interest was located in the center of the ROI. The regional CV value is assigned to the pixel of interest. This value was defined as the Local Heterogeneity Score (LHS). The ROI then moves to its adjacent position and starts the regional CV esti mation and LHS assignment again. The estimation cycle ends when the LHS is assigned to each pixel of the image. From the results obtained based on the Phase of the EIT impedance signal, a correlation between FEV1 and the CV and IH parameters of r = -0.59 (p = 0.01) and r = -0.53 (p = 0.02) was evidenced, respectively. And a correlation between FEV1/FVC and CV and IH parameters of r = -0.4 (p = 0.03) and r = -0.38 (p = 0.1), respectively [19]. Lasarow et al. [20] propose the use of EIT for monitoring forced pulmonary ventilation using regions of interest and for estimating the param eters used in [19], CV and IH. Correlations between FVC and CV and IH parameters of r = -0.1515 (p = 0.0903) and r = -1534 (p = 0.0864), respectively, were evidenced. From the analysis of FEV1 and the CV and IH parame ters, a correlation of r = -0.2758 (p = 0.0018) and r = -0.2799 (p = 0.0015) was evidenced, respectively [20].
The comparison of the results obtained in [19], [20] and those obtained in this study are shown in Table 5.
Table 5 Comparison of results obtained between research groups.
| Milne et al (2019) [19]1 | Lasarow et al (2021) [20]2 | Present study | ||||
|---|---|---|---|---|---|---|
| Parameters | CV3 | HI4 | CV3 | HI4 | TRF-Module5 | TRF-Phase6 |
| FVC |
-0.15 (p=0.0903) |
-0.15 (p=0.0864) |
0.76 (p<0.05) |
0.64 (p<0.05) |
||
| FEV1 |
-0.59 (p=0.01) |
-0.53 (p=0.02) |
-0.28 (p=0.0018) |
-0.28 (p=0.0015) |
0.65 (p<0.05) |
0.54 (p<0.05) |
| FEV1/FVC |
-0.40 (p=0.03) |
-0.38 (p=0.1) |
0.60 (p<0.05) |
|||
The results obtained in this study were significantly superior to those found by Milne et al. [19] by 6% and 34% for FEV1 and FEV1/FVC, respectively. And those found by Lasarow et al. [20] in 79% and 53% for the FVC and FEV1 parameters, respectively.
The next step of the investigation will be to find a rela tionship between the spirometry parameters and the impedance changes using an array of four electrodes. This study will demonstrate the feasibility of using simpler and less expensive impedance equipment to be used in the clinical field on an outpatient basis.
CONCLUSIONS
EIT impedance changes due to pulmonary ventilation are composed of signals of different amplitudes and frequencies that are the result not only of chest move ments but also of the behavior of the lung parenchyma conditioned by the flow of circulating air. These fre quencies correlate with the spirometry parameters FVC, FEV1, and FEV1/FVC. FVC and FEV1 show a sta tistically significant correlation in the frequency range between 939.95mHz and 1.06Hz and FEV1/FVC in the range between l56.66mHz - 274.i5mHz. The calibra tion equations conditioned by each frequency compo nent and intended for the estimation of the spirometry parameters showed a sufficient mathematical adjust ment to obtain estimates comparable to those of the reference values. This monitoring technique could be used in patients to determine the degree of pulmonary obstruction/restriction non-invasively and only with monitoring of circulating volume.

