


 nueva página del texto (beta)
 Inglés (pdf)
 Artículo en XML
 Referencias del artículo
 Enviar artículo por email
 Citado por SciELO
  Similares en
SciELO
Similares en
SciELO 
 Permalink
INTRODUCTION
The retina is located at the back of the eye and is a light-sensitive layer of tissue; its characteristic color is reddish or orange due to the number of blood vessels behind it. The macula is the yellowish area of the retina where vision is most affected and consists of the fovea, which is only a tiny part of the retina but is crucial to enable many visual functions, and by the foveal avascular zone (FAZ), the which allows the human being to detect light without dispersion or loss [1].
Optical coherence tomography (OCT) is an imaging technique with micrometer resolution, which captures two-dimensional and three-dimensional images using low-coherence light from optical scattering media. The output images allow information about the retina, such as its structure, consistency, and thickness. It allows the diagnosis, monitoring, and control of retinal diseases through high-resolution images.
Optical coherence tomography angiography (OCT-A) is a modern, non-invasive technology that, like OCT, allows retina imaging. The main advantage of OCT-A is that it does not require the application of a contrast agent to obtain deep and superficial images of the retinal blood vessels (RV). The FAZ is a central nonvascular area. Previous studies can obtain the images of the projection maps (superficial, internal, and deep). It is necessary to point out that each plexus has different morphological characteristics; therefore, they are visualized both on the surface and in the internal plexus [2].
In this article, a comparison between the plexus segmentation taken with different imaging modalities, namely OCT and OCT-A, is first presented to identify which of the two imaging techniques offers the best conditions for segmentation. The main characteristics of the plexus are the ZAF and the RV. Once the best modality has been identified, we will only take the copies of it to carry out the segmentation corresponding to the characteristics sought. For the FAZ, a comparison between two convolutional networks, U-Net and ResU-Net, is used, and for the RV characteristic, a Fully Convolutional Network (FCN) and U-Net. Both factors differ in one of the networks to be compared because the FCN has presented better results in terms of detail at the edges of the characteristics sought to be segmented.
Related Work
The semantic segmentation task is one of the essential tasks in computer vision in recent decades and even more so if we focus on medical images since they have become an aid in detecting diseases. It has been proven that using neural networks to perform this task yields good results. However, when we talk about semantic segmentation, it is prevalent that convolutional networks are used from start to finish.
The development of these networks for medical images has been used in countless applications, whether in the eyes, chest, abdomen, brain, or heart. The database used for this article is from the retina, that is, from the human eye. Therefore, we will contribute with state of the art of retina analysis. One of the challenges is the segmentation of veins or blood vessels. It depends on the technique to obtain an image, such as an eye fundus image or a tomography taken to some specific area. In [3] [4], use a residual network based on U-Net using a batch normalization and an automatic encoder named PixelBNN, which segments the veins in fundus images and is tested in various databases to achieve acceptable results; down testing time was their contribution. For Xiao et al. and Son J et al., the contribution to RV focused on reducing the edges of the veins, making them more precise and sharper [5] [6]. Other ocular applications in the area of glaucoma where the main task is to segment the optic disc, in [7] [8] use a ResU-Net and propose using a modified FCN; the image takes to center in the optic disk to reduce noise in fundus images.
RV segmentation
OCT-A is a non-invasive technique developed and applied relatively a few years ago, through which the vascular structures and choroids can be visualized in the retina. In turn, the segmentation of retinal vessels, the obtained vasculature through this technique, is an available research opportunity to make a difference from the methods studied for more than 20 years [9] [10] [11], such as those based on techniques such as deep learning, filters, and some classifiers for VR segmentation in fundus images. Implemented the method used in image thresholding in [4] [5] to determine the density of the veins.
However, vector and exponential flow optimization algorithms have been among the best algorithms implemented in OCTA images for RV enhancement and segmentation. The implementation based on Gibbs Markov and its field model in [12] [13] [14] was applied in the projection maps for the RV segmentation to segment retinal vessels into different projection maps.
The papers of [8] [9] [10] proposed a modified U-Net for circle segmentation in a maximum intensity projection of OCT-A. Wylęgała et al. present in [11] a new partition-based modular array to detect thick and thin vessels separately.
FAZ segmentation
The FAZ is the fovea region where the absence of blood, the vasculature, can be observed. A new field of study is the segmentation of the FAZ through OCT-A images compared to retinal vascular segmentation. The authors of the papers [12] [13] [14] introduced an active contour model for FAZ detection. Li et al. and Bates et al. present in [15] [16] a series of morphological factors to identify FAZ candidates in OCTA projections using two types of fields of view. A modified U-Net to segment the FAZ on the OCTA projection map of the superficial retina was introduced in the papers [9] [16]. Through a CNN, Azzopardi et al. develops a segmentation for the FAZ and the nonischemic capillary region [12].
MATERIALS AND METHODS
Dataset
The plexuses database deployed in this work is the OCTA-500 [15], which consists of images collected from 500 subjects taken under identical conditions (projection maps). The retina image size is 3mm x 3mm, with 304px by 304px collected from 200 subjects, and 6mm x 6mm images, with 400px by 400px for the remaining 300 subjects. Images with the same number and characteristics were collected for OCT and OCT-A.
Figure 1 shows the OCT and OCT-A projection maps from the OCTA-500 database. The corresponding OCT projections and the full OCT-A projection correspond to 3D volumes from averaging in the axial direction. On the other hand, the Inner Limiting Membrane (ILM) - Outer Plexiform Layer (OPL) projections, as well as the OPL - Brunch Membrane (BM), respond to a maximum in the same direction.

Figure 1 Projection maps for each of the techniques (All images are retrieved from the database [15])
U-Net
U-Net is a network based on a "Fully Convolutional Network" (FCN) which was designed, tested, and presented in 2015 mainly for the segmentation of biomedical images. The value and reliability that U-Net offers, with its 23 convolutional layers, has been shown in [17] for the field of images of medical origin. A network that does not entirely connect all its layers and when taking the shape of a "U" reflects almost a symmetry in the expansive and contraction paths.
Due to the nature of the network in this article, it was decided to use the same architecture proposed in [17] [18], which can be defined in general terms as a network formed by a series of encoders located in the first half of the network, which allows the data to be contextualized, input is called the contraction path. This first part of the network is built from unpadded convolutions, followed by a rectified linear unit activation layer ReLU [19] for each previous convolution.
Finally, the resolution reduction applies a maximum grouping operation. In the second half, the expansion path, a series of decoders perform the exact location of the network by determining it from an upsampling of the function map, followed by an up-convolution, cropping, and two convolutions that, like in the first half it is followed by a ReLU layer for each of them.
Deep ResU-Net
ResU-Net is a semantic segmentation neural network that merges the strengths of the residual neural networks and the U-Net, thus obtaining a Deep ResU-Net. This combination provides two advantages: 1) the residue facilitates the formation of meshes; 2) it facilitates the lossless transmission of information between the low and high levels of the network and within a residual unit with the elimination of connections, which allows for designing a neural network with fewer parameters [20] [21]. It can achieve similar performance and is consistently better than semantic segmentation.
The architecture of the ResU-Net network comprises 56 convolutional layers; the network proposal by [20] solves the degradation of the model in the deeper layers.
A model builds to the base of the pair of convolutional layers corresponding to the expansive path in the U-Net; a residual learning block replaces these. A residual learning block comprises three convolutional layers, the first two with a ReLU activation and three batch normalization layers [21]. Hence the ResU-Net on the expansive path includes an input unit, a central unit, and a residual unit; the contraction path comprises four concatenated blocks, adding a block and an output unit.
Fully Convolutional Network
A Fully Convolutional Network (FCN) can be used for semantic segmentation, which means it uses convolution and deconvolution layers. For the development of this research, a FCN network was developed and tested by [22] based on a VVG-16 as the authors mention higher accuracy compared to other FCN based on either AlexNet or GoogLeNet. Three variations are known for the FCN network, FCN8s, FCN16s, and FCN32s; in our case, a FCN8s network is used. The discrepancy between these three networks lies in the resolution reduction because the semantic information requires a detailed level of recovery in the connection of the intermediate layers.
Evaluation Metrics
It is essential to mention that due to the nature of the problem in the segmentation of both the FAZ and the RV, the background of the image has a more significant presence than each of the parts to be segmented. Therefore, the metrics [23] chosen to evaluate the segmentation performance of each network quantitatively are established in Equations (1) - (5):
• Dice Coefficient (DICE):
• Jaccard index (JAC):
• Balance-precision (BACC):
• Precision (PRE):
• Recovery (REC):
These metrics allow comparing our models with the current state-of-the-art. TPR refers to the true positive rate, TNR negative rate, TP to True Positive, and FN to False Negative.
Manual Segmentation
The ground truth (GT) used to validate the results of the following training sessions is one for each feature.
The ground truth (GT) used to validate the results differs from the given to the database. A manual modification is made to the image provided where the features are isolated, and the original GT has both features FAZ and RV. Figure 2 shows the segmentation of the FAZ; the GT is unique for this feature, doing away with the RV and only placing a black background in the rest of the image. This same process is carried out for the GT of the RV.
Process
Model training is performed using 80% of the images from the full projection, which correspond to 400 photos from the OCTA-500 database, and the remaining 20% was used for verification. Resizing 304 px by 304 px is applied for the test and training set to keep data in standard dimensions. This procedure is performed under the same conditions and characteristics of retinal imaging.
It uses the U-Net network while preserving the structure and hyperparameters of the original model using the Stochastic Gradient Optimizer (SGD). The training is performed for 50 epochs for both databases. Figure 3 shows the evolution of the proposed methodology in detail.

Additional training is carried out with a technique that performs a better segmentation of the validation image and compares it with the ground truth, provided and validated by the same database used (OCTA500). OCT-A technology provides the best measurements; however, the goal was to segment the FAZ, and in the results, blood vessels can be observed in the full segmented view of both techniques. In addition, manual segmentation was performed in the target image to enhance the above segmentation, leaving only the visible FAZ, ignoring the vascular system. It is important to note that this training is conducted under conditions similar to those previously applied.
Two projection maps from the database were mainly used for RV segmentation. One of them is the maximum projection map of the retina and the full projection map. These two maps can be found for the two imaging techniques, that is, OCT and OCT-A, which allows a more significant number of examples for training.
Technical Considerations
All experimentation is done in TensorFlow using an NVIDIA GeForce GTX 1080Ti GPU. The standard normal initialization method is used to initialize the network with a difference of 0.02 batch size of 3 as a cross-entropy loss function, and Adam as the optimizer was implemented.
Overtraining is avoided by evaluating the similarity between the validation and training sets throughout the network training process. Further choosing the training model with the best performance and trying to have the best value of this similarity by calculating the dice coefficient.
RESULTS AND DISCUSSION
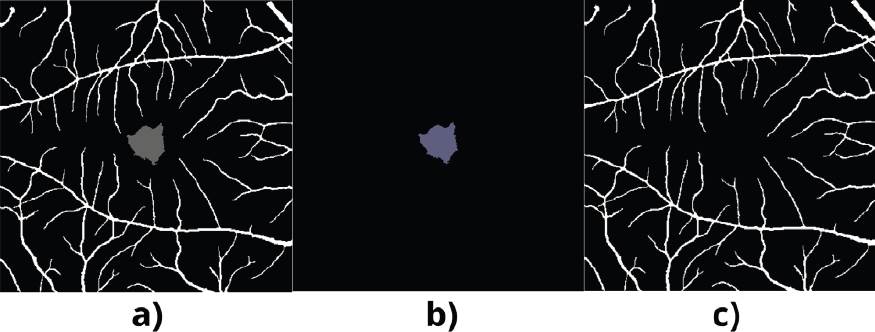
It is observed that the OCT image produced poor segmentation compared to the OCT-A image. It is essential to point out that this segmentation is not acceptable because the distinction between the FAZ and the veins cannot be differentiated in the image; only an image with a black background and some white reliefs are observed. In Figure 4, we support this, and the applied metrics are presented after a comparison.

Figure 4 Resulting Image. OCT: a) Full projection, b) Ground Truth, c) U-Net-FAZ. OCT-A: d) Full projection, e) Ground Truth, f) U-Net-FAZ.
In the case of OCT, in a visual evaluation of Figure 4, it is impossible to locate the FAZ or the veins in the resulting image (c). Despite showing an accuracy of 88.42%, there is no correct segmentation. High precision in the OCT images is due to the nature of the images; that is, we can see that the validation image (b) has a black background, which is why it shows an acceptable precision when evaluating. In the case of OCT-A, in the resulting image (c), it is possible to visualize the two elements of interest, the FAZ, and the veins. Even though errors are shown in the segmentation in said segmentation, the clarity is apparent in the image, and it is evident.
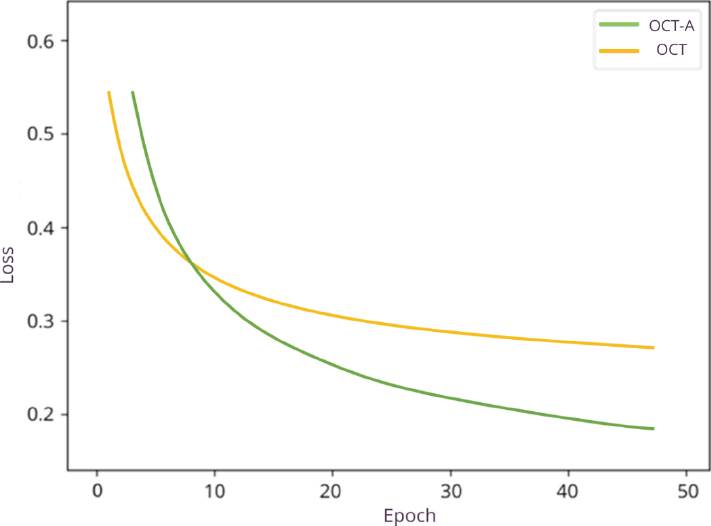
Table 1 and Figure 5 compare the network implementation of two data sets prepared in the same condition. As we can see, OCT-A retinal imaging presents better results.
Table 1 Validation Metrics.
| Metric | OCT | OCT-A |
|---|---|---|
| Loss | 0.3164 | 0.1627 |
| Accuracy | 88.42% | 97.77% |
| AUC | 87.71% | 92.04% |
Earlier mentioned, a second training cycle (Table 2) was applied to this technique. The main change is that the mask does not contain vessels (only the FAZ), our area of interest.
Tested this second training and the architectures, the results show us that in the case of the FAZ, the metrics validate that the best segmentation was through training with the ResU-Net network. Furthermore, visual assessment (Figure 6) is confirmation that the feature is fully segmented.

Furthermore, the performance obtained from the networks in the validation data is shown in Table 3. The ResU-Net network is observed to be better than the U-Net under the abovementioned metrics.
Table 3 Metrics comparison of different methods for FAZ segmentation.
| Issue | Method | DICE (%) | JAC (%) | BACC (%) | PRE (%) | REC (%) |
|---|---|---|---|---|---|---|
| FAZ | U-Net | 85.18 | 76.43 | 92.65 | 88.07 | 85.44 |
| ResU-Net | 89.99 | 89.36 | 93.63 | 92.59 | 93.61 |
On the other hand, for the veins, the network that gives the best results after the training is the FCN shown in Figure 7, where it is possible to observe in the same way as in the case of the FAZ. In this isolated segmentation, the mask (GT) only shows the blood vessels, and the result of this change gives a segmentation with the distinction of the veins in the image.
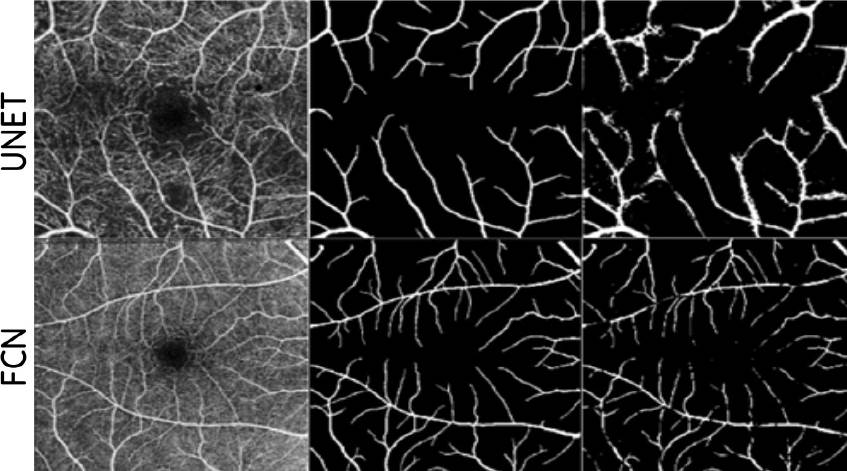
Figure 7 and Table 4 correspond to the RV feature, and we can observe and confirm that the FCN segmentation is the have the best metrics and is also affirmed under the visual test segmentation.
CONCLUSIONS
According to our segmentation results, it was better to implement a DL model separately for each characteristic. This may be because the characteristics differ a lot from each other. For each neural network, RV segmentation and FAZ segmentation were implemented separately. Manual segmentation was performed on the ground truth (GT) images. Using GT images with isolated segmentation allows the network to perform validation that only focuses on the desired feature. We compare state-of-the-art segmentation methods, including U-Net, ResU-Net, and FCN, for the FAZ segmentation. ResU-Net gives us a similarity percentage with the actual segmentation image of almost 90%. As for the RVs, the similarity is close to 86% using the FCN network. The obtained results are satisfactory enough to be used in the application or detection of these patterns for disease detection.

