


 nueva página del texto (beta)
 Inglés (pdf)
 Artículo en XML
 Referencias del artículo
 Enviar artículo por email
 Citado por SciELO
  Similares en
SciELO
Similares en
SciELO 
 Permalink
INTRODUCTION
Cervical mucus (CM) is produced by secretory cells in endocervical glands and discharged into the endocervical conduct. CM is composed mostly of water (up to 90%); the rest consists of mucins that confer viscoelastic gel properties, amino acids, ions, cholesterol, lipids, glucose, polysaccharides, soluble proteins, and enzymes [1] [2] [3]. In normal conditions, the secretion of CM changes quantitatively and qualitatively through the hormonal cycle stage.
The secretion of CM depends on the hormonal cycle: women produce 20-60 mg of CM per day until they reach approximately 600 mg in the ovulation period, a crucial change for the transport of spermatozoa to the mature follicle [4]. This pattern occurs in fertile women, but in infertile females, the panorama is quite different [5]. Several hormones participate in ovulation: gonadotropin-releasing hormone (GnRH) acting from the hypothalamus; follicle-stimulating hormone (FSH) and luteinizing hormone (LH) secreted by the anterior pituitary gland, and estradiol and progesterone produced in the ovary. In the initial phase of the menstrual cycle, the estrogens stimulate FSH production and release; by positive feedback, FSH increases during the first half of the cycle. In the middle of the cycle, the rise in FSH and LH triggers ovulation [6]. Later, the surge in FSH and LH generates negative feedback in gonadotropin secretion, and the hormone levels fall during the second half of the cycle. If pregnancy is absent, the secretion of estrogens and progesterone starts to diminish after ovulation, and menstrual bleeding occurs. Hormonal fluctuations throughout the menstrual cycle are the main factor influencing ovulation [7].
Ovulation is currently detected through blood tests and intravaginal ultrasound to identify the dominant ovarian follicle [8]. EI has been widely used in biological applications since 1925, with significant advances during the past one hundred years [9] [10] [11]; actually, it may be a more reliable and convenient detection tool. Although EI has been used to assess cervical neoplasia or cervical ripening in pregnant and non-pregnant women [12] [13] [14], it has barely been applied to detect ovulation [15] [16] [17] [18] [19] [20]. Hence, this work aims to determine the ovulation window via measuring the impedance of CM by a minimum invasive EI device. Our principal objective was to assess the feasibility of correlating impedance values with serum concentrations of estradiol, FSH, LH, progesterone, prolactin, and total testosterone, as well as intravaginal ultrasound, to observe and measure ovarian follicle release. All laboratory tests were performed according to each patient menstrual cycle to precisely detect the ovulation period or fertile window.
MATERIALS AND METHODS
This pilot, prospective, longitudinal protocol aimed to identify variations of EI in cervical mucus at different phases of the reproductive cycle. Fourteen healthy women aged from 18 to 44 years and with a complete gynecological-obstetric history were included. Each participant provided written consent for blood procedure, intravaginal ultrasound, and device use. Internal Committee for Research and Follow-up of Research Projects (CIESPI) of the Technical Industrial Teaching Center approved the study with the number PI-07-1820. All selected participants had a normal hormonal profile, did not use hormonal contraceptives, DIU dispositive, or any vaginal treatment such as lubricants, creams, or ointments for at least two months, and were willing to take protective measures during sexual intercourse. All women had regular pap smear reports. During the study, two participants were excluded by a hormonal disturbance in the second cycle and another one for pregnancy, staying only eleven. With prior training for device and mobile app use, all women auto-measured impedance with the Kegg device for two minutes daily in the morning. Measurements were made for three consecutive menstrual cycles starting the first day after bleeding in each cycle. The hormonal activity was monitored in urine, blood samples, and ovulation via vaginal ultrasound (Figure 1- c). For the correct use of the device, the dorsal position was obligatory.

Figure 1 (a) KeggTM device for EI measurement of CM. (b) The mobile application data register. (c) Timeline. Arrow 1. All subjects must finish vaginal bleeding to start measuring impedance. Arrow 2. All participants began to use the LH strip until getting a positive result and continued using the device. Arrow 3. Serum quantification of hormones in the blood once positive urine strip: LH, FSH, Estrogen, total testosterone, and prolactin. Vaginal ultrasound performed within 24 to 48 hours after LH peak. Arrow 4. Serum quantification of progesterone. This scheme was repeated for three menstrual cycles.
Electric impedance measurement
We used kegg device, model K-1 (Lady Technologies, Inc., San Francisco, CA), powered by a 50mAh battery that includes an electronic impedance circuit made with gold-plated stainless-steel electrodes, a mainboard to transfer all information via Bluetooth to mobile application (Android and IOS) and a vibration motor for patient feedback. The device is covered with medical-grade silicone for safety and comfortability and has been thoroughly tested according to IEC/ISO standards (Figure 1 a-b). For proper usage, the device is inserted into the vagina to reach the cervical fluid pool.
Urine and blood sample hormonal measurements
On the same day the patients started using the EI device, they tested their LH concentration with the Clearblue® strip (S.P.D., Swiss Precision Diagnostics GmbH, Geneve, Switzerland) on the first-morning urine daily. Once the strip test was positive, blood was collected by a venous puncture for hormonal determination of LH, FSH, estradiol, prolactin, and total testosterone employing immunoquimioluminiscence (Ortho, Vitros 5600, Inc. California, USA). Progesterone was determined in another blood sample by the same methodology on day 21 of each cycle.
Vaginal ultrasound
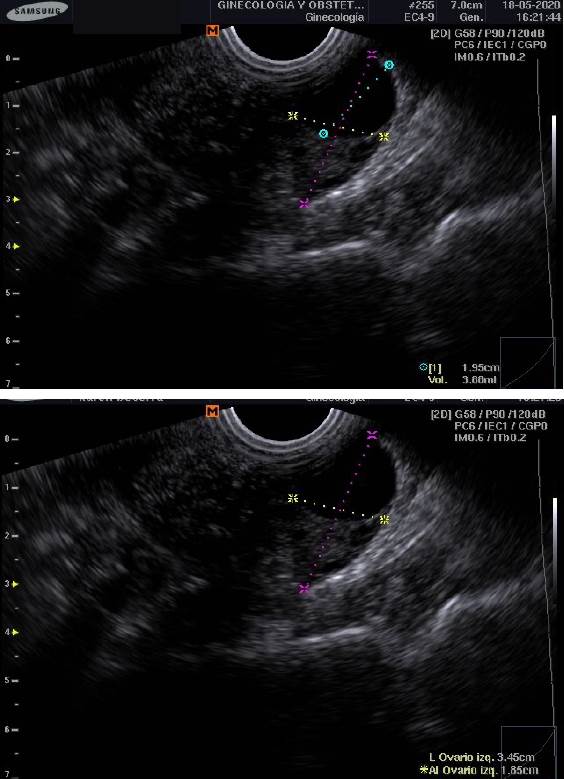
The following day after the positive LH strip, the woman underwent a vaginal ultrasound (SonoAceR3, Samsung Health Care. Seul, South Korea) to verify the amount and size of follicles in both ovaries.
Characteristic of EI device
The impedance measurement of the kegg device is based on a balanced bridge whose voltage is read by the microprocessor ADC. The processor generates a 1 kHz signal at a known voltage which is used to excites one electrode (called the tip), the voltage is then read on the other electrode (called the ring) through an op-amp. This procedure is then reversed, whereby the second electrode is excited and read by the first. The processor performs a calculation based on the known values of the other legs of the bridge, and a reference value (excitation voltage) is then established to determine the resistance. The measurement is made multiple times to create a sample of set of 50 readings which is then averaged for a final impedance value.
The communication process is activated when the device receives a command from the mobile app via Bluetooth; fifty readings are required during a single measurement session. These readings are transferred to an Android mobile app via Bluetooth Low Energy; then, the data are saved on the cloud and processed to determine which readings fall within the fiftieth percentile and calculate a median value labeled as the final impedance value. These values are entered into the database for each user's session. The Bluetooth is turned off during the actual measurement process.
Statistical Analysis
Data analysis was carried out using GraphPad Prism LLC version 8.01 software (San Diego, CA) and Medcalc software Ltd (Ostend, Belgium). Results are presented as means or medians. The raw impedance values of each phase were compared between them and to those of the other phases in the same woman and other subjects' values via the Mann-Whitney U test with Holm-Sidak correction and an alpha error of 0.05. The level of significance was set at P <0.05. Data were normalized as follows:
The means of the impedance values of the follicular Equation 1 (FOL) and luteal Equation 2 (LUT) phases of each cycle were obtained with the following formula:
This means the impedance value of the day of ovulation (Impov) (LH peak) of the corresponding cycle was subtracted from Equations 3 and 4. The ovulation impedance values of 3 cycles were added, and the mean was obtained, which was subtracted from each individual ovulatory impedance measurement. Equation 5.
With these values, multiple comparisons were made using the Friedman test and the ROC curve to compare the ovulatory phase against non-ovulatory phases (luteal and follicular).
RESULTS AND DISCUSSION
No participants reported any injury or collateral effect using the device to measure impedance in cervical discharge or discomfort by venipuncture for blood tests.
Subjects' metrics
Table 1 describes the mean age and standard deviation (SD) of the eleven participants at the beginning of the study, as well as blood values of LH, FSH, estradiol, prolactin, and total testosterone taken on ovulation day; only progesterone content was measured on day 21st of each menstrual cycle. Finally, to verify the ovulation, we also perform ultrasonography 24 to 48 hours after LH serum peak to visualize follicle size and number (Figure 2).
Table 1 Characteristics of the study subjects.
| Parameters | Values |
|---|---|
| Total participants (n) | 11 |
| Age (years) | 30.6(±8.2) |
| LH (mUI/ml) | 35.7 (±4.5) |
| Estradiol (pg/ml) | 179.3 (±14.2) |
| Prolactin (ng/ml) | 22.60 (±1.93) |
| Total Testosterone (ng/ml) | 0.4109 (±0.025) |
CM raw impedance values
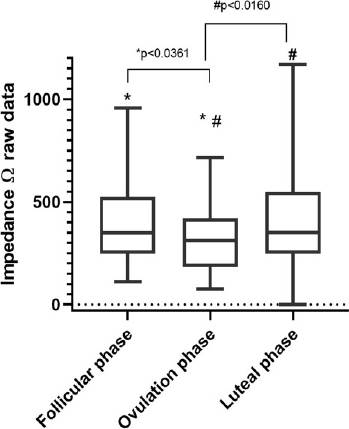
In total, there were 676 impedance measurements from cervical discharge from eleven participants. In Figure 3, we divided the menstrual cycle into three phases: follicular, ovulatory (LH peak), and luteal. Our results show that the difference between follicular and ovulatory phases were statistically significant in impedance measurements (median 349.1Ω, and median 311.8Ω, P value= <0.0361) concerning the luteal phase vs. ovulatory phase (median 350.3Ω, and median 311.8Ω, P value= <0.016). Finally, we performed Holm-Sidak correction with an alpha of 0.05 for follicular and luteal phase comparations against the ovulation phase (adjusted P value= <0.03 and adjusted P value= <0.02).
CM normalized impedance values
After data normalization, the Friedman test yielded a value of P = <0.0435 (Figure 4).
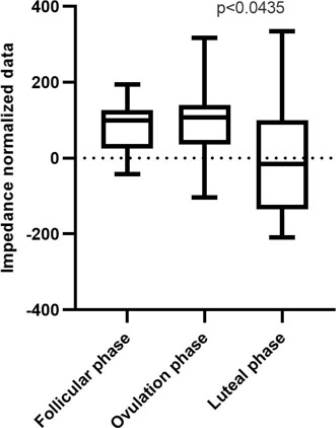
Figure 4 Box and whisker plot. Impedance normalized data of follicular, ovulation, and luteal phases. (*) Statistical differences were found for the impedance measurement between all phases (P < 0.0435)-Friedman test.
To evaluate the device as a valuable method to distinguish the ovulation phase from follicular and luteal phases of the menstrual cycle, we obtained a receiver operating characteristic (ROC) curve under bootstrap confidence interval (1000 iterations; random number seed: 978), an area under the ROC curve (AUC) of 0.713 (value of p = <0.0253), and a Youden index J of 0.4545 with a sensitivity of 63.64% and specificity of 81.82% (Figure 5. With these impedance measurements, we can discriminate between no ovulation period (follicular and luteal phases) and ovulation period (LH peak day).
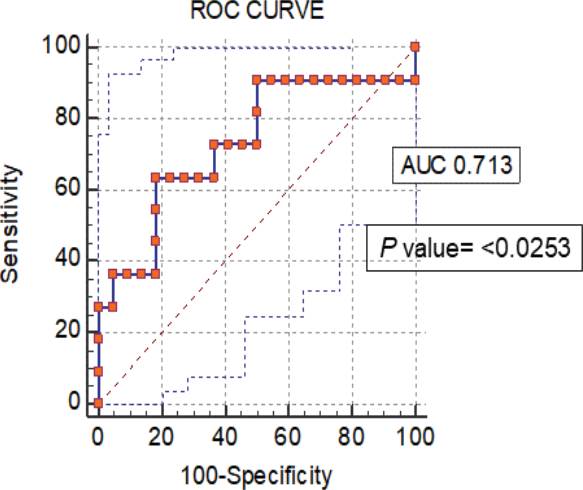
Figure 5 ROC curves from normalized data of impedance measurements of the non-ovulation and ovulation (LH peak day) periods (p value= <0.0253).
This study describes the application of electrical impedance measurement to investigate conductivity changes in CM during the menstrual cycle in healthy women of reproductive age. Our results revealed a lower impedance during the ovulatory phase compared with the follicular and luteal phases. It is well known that pH changes in CM play a pivotal role in sperm survival since during the ovulation period, the mucus becomes less acidic with a nearly neutral pH, and sperm is thus protected, leading to changes in electrical impedance [21].
In this sense, some research has monitored the dayto-day changes in CM by EI devices. Previous reports measured salivary or vaginal electrical resistance (SER or VER) with a CUE Fertility Monitor. In general, results show that the peak in LH occurred 4 to 5 days after the peak measurement in SER, and this had a strong positive correlation (r = 0.94) with the urinary LH surge. As for VER values, these diminished along with the preovulatory phase from day -3 until day 0. In this report, the VER mean at day 0 correlated with the LH surge; consequently, the nadir was the lowest value on the CUE Fertility Monitor. Moreno, et al. [13]. concluded that CUE Fertility Monitor has potential for use in natural family planning (NFP). In contrast, a prospective study on the reliability of the CUE Fertility Monitor [22] that analyzed sixteen cycles with signals (i.e., SER and VER) for the beginning and the end of the fertile period, could not find signals in two cycles; therefore, the researchers did not recommend the CUE Fertility Monitor utilizing the current algorithm for NFP.
In this work, the EI device was used only once a day to measure CM. The main objective was to simplify the daily CM evaluation making it practical and comfortable for women. The results of this study indicate a low impedance value coincident with the LH peak and the appearance of the dominant follicle, as seen by ultrasonography. However, several factors mentioned below in order of importance can affect the impedances recorded by the device and should be considered by the end-user. First, end-users must follow the manufacturer's instructions for the Kegg device for two complete ovulatory cycles.
The methodology carried out in this study provides enough data to the APP for analysis. Second, it is necessary to constantly monitor the LH in urine or serum to determine a correlation between the impedance values obtained in the first three months when the LH test is positive. The observation of the LH peak and the impedance value is fundamental because each woman has her own hormonal rhythms that influence the composition of the mucus in the different phases, there are ultrastructural changes such as the increase in pore size of the network of fibers that make up the mucus during the ovulatory phase that allows a greater flow of substances producing variations in resistivity and conductance [23]. Another factor is the water content of the mucus, which reaches up to 99% during ovulation, which has an impact on the decrease in impedance in this phase, as opposed to the follicular and luteal phases where the water content is 90 to 95%. Finally, mucus content and density may also have an influence, as there are noticeable changes in the follicular phase, with cervical mucus being more abundant and dense in the luteal phase compared to the ovulatory phase [24]. This last property depends on hydration, electrolyte content, exercise routine, nutritional habits, age, some vaginal infections, stressful conditions, etc. So, each woman needs to learn to know her hormonal levels and observe in time how they can affect CM production [25]. Third, in this study, users were asked to use protection in all sexual encounters to avoid direct contact of the device with the semen, as this could modify the impedance value. Once the proper cervical mucus values are gained, the recommendation is to allow 10-12 hours between the sexual encounter and the impedance measurement.
CONCLUSIONS
This study shows that the kegg device, model K-1, helps to identify the LH ovulatory peak. Indeed, serum and urinary increases of LH, together with the ultrasonographic documentation of a dominant follicle, detect a woman's fertile window with a sensitivity of 63.6% and specificity of 81.8%. Measurement of CM electric impedance with the Kegg device is more reliable than daily monitoring of urinary LH test alone, making this method cost-effective along with the ease-of-use benefits. Further studies exploring different disorders (polycystic ovary syndrome, endometriosis, hyperprolactinemia, premature ovarian failure, or imbalance in thyroid hormone) that can affect the sensitivity and specificity of EI ovulation values are required.

