


 nueva página del texto (beta)
 Inglés (pdf)
 Artículo en XML
 Referencias del artículo
 Enviar artículo por email
 Citado por SciELO
  Similares en
SciELO
Similares en
SciELO 
 Permalink
INTRODUCTION
Elevated temperature is frequently used as a factor to stimulate the aging process, also known as “accelerated aging”. This process is applied to different polymers that are used in the fabrication of medical devices and other materials applications from nuclear, space, and geomembrane industries [1] [2].
The objective of the accelerated aging process in the medical device industry is reducing the amount of time required for performance qualification of medical devices including their shelf life. The concept of shelf life must be incorporated into the product reliability during the process of medical device development for commercial distribution [1] [3].
The introduction of medical devices in the market requires to assure that they can be stored for an extended period in accordance with their labeling, without any decrease in the performance that may affect safety and efficacy when the device is used [3] [4]. The accelerated aging process provides experimental data in support of the performance and shelf life until real-time aged samples become available [4].
The accelerated aging techniques used in the medical device industry are well documented by Standards Development Organizations (SDO), such as Advancement of Medical Instrumentation (AAMI) in the Technical Information Report TIR17, entitled “Radiation Steri-lization Material Qualification”, and American Society for Testing and Materials (ASTM) in their standard F1980-7. Both SDO provide a method based on van’t Hoff’s observation and Arrhenius reaction rate function. This function, known as accelerated aging factor (AAF), states that a 10°C increase or decrease in temperature, the rate of chemical reactions increases by a factor of two. It can be expressed as in Equation (1).
Where, ∆T= T-Tref.Tref is a reference temperature that determines the effect of aging, and T is an accelerated temperature used to stimulate the effect of aging. This is also known as the Q10= 2 rule [1] [5]. This mathematical expression is a predictive equation from empirical observation that is considered into the approaches to accelerated aging methods. There are many approaches to accelerated aging that have been documented and summarized in the literature, from simple holding the materials at conditions as close as possible to the use conditions to minimize the aging factor, up to complex chemical and analytical methods [2]. Different studies of elastomer aging and their application to biomaterials have been reviewed by Hukins et al. [1]. Additionally, accelerated aging testing using the Arrhenius model with elevated temperatures has been studied to determine the failure modes of LEDs for medical applications [6].
Even though it has been demonstrated that the empirical method of Q10= 2 rule outlined in AMMI TIR17 and ASTM F1980-7 is reasonable and responsible, it is only valid for T ≤ 60 °C [1] [2]. In this condition it is difficult to obtain life data and have inferences about medical device reliability; therefore, critical concern in patients’ safety is not considered. Reliability analysis using accelerated degradation tests (ADTs) can often acquire a better accuracy of life estimation in comparison to accelerated life tests (ALTs) e.g., accelerated aging. Since, using accelerated degradation data directly relates reliability to a physical characteristic also known as critical performance characteristic [7] [8]. Furthermore, an accelerated degradation-based model characterizes the degradation process as a function of time. A typical degradation model is given by a stochastic process [9]. Degradation models based on stochastic processes have been particularly studied in the last years [10]. The different stochastic processes including the Wiener Process are described by Lim and Yum [9], Rodriguez-Picón et al. [10] and Rodríguez-Picón et al. [11].
The Wiener process is a non-monotone stochastic process, which suggests that negative increments may be present in the process. This process has been widely used in the reliability analysis of different applications [12]. For example, Pan et al. [7] validated a life estimation method using degradation dataset of the LED and the Wiener degradation process. Li et al. [13] used a Wiener process model to predict the remaining useful life (RUL) in two study cases, the first in gyroscopes used as critical component of the inertial navigation system (INS) and the second in the lithium-ion batteries, which are used as the energy solutions in many fields. Lyu et al. [14] applied the Wiener process to model the degradation-based in burn-in method to maximizing the mean lifetime to failure (MTTF) of a certain product.
On the other hand, in certain applications of ADTs, the measurements of the degradation level in the critical performance characteristic are destructive, so that only one measurement can be obtained from each test unit; this approach is based on accelerated destructive degradation tests (ADDT) [15] and some examples of the ADDTs applications have described below. Escobar et al. [15] applied an ADDT for assessing reliability using the strength of an adhesive bond. The considered test was destructive because the strength can only be measured once for each unit. Chih-Chun Tsai et al. [16] used an ADDT to assess the long-term reliability of a polymer material that was subjected to an alkaline environment at high temperatures; the critical performance characteristic was the tensile strength so that was destructive. Some studies have been conducted on ADDT planning; as described in [17] [18].
Driven by the above-mentioned works, the objective of this paper is to develop a ADDT model based on the Wiener process as an alternative approach to the accelerated aging method outlined in AAMI TIR17 and ASTM F 1980-7 that are used in the design and development of medical devices specifically intravascular catheters to provide evidence for claimed shelf life as part of the product reliability. An intravascular catheter is a medical device that is described in Food and Drug Administration (FDA) regulation, 21 Code of Federal Regulations (CFR) part 880.5200 as a slender tube that is inserted into the patient’s vascular system for short term use to sample blood, monitor blood pressure, or administer fluids intravenously [19]. For the ADDT performed in this paper, the critical performance characteristic selected is the tensile strength in the catheter tip (tip pull test). This test assesses the bond strength of polymeric thermal fusion between the distal tip and the catheter shaft to demonstrate that bond can withstand tensile forces greater than those that may be experienced during clinical use. The tensile force that separates the distal tip from the catheter shaft is a critical concern patients’ safety because a failure of bonds in the distal tip could lead to vessel damage, embolic risk (obstruction of blood flow) due to the device remnants within the vasculature, and their death, which may also potentially occur [20] [21] [22]. There are numerous adverse events and recalls reported on the medical device databases from FDA related with the distal tip separation. This information can be found in [23] [24].
The contents of this paper are organized as follows: Section 2 describes the devices under test (DUT), and the ADDT design whit the stress condition that is applied to the DUT over time. Section 3 explains the theory and modeling principle of the degradation model in terms of stress level, and the parameter estimation method. The theory of times to failure and the accelerated factor calculation are explained as well. Section 4 provides the results of the degradation model, and their estimated parameters which are obtained from the ADDT described in section 2. The degradation model parameters are used to calculate the estimated time to failure in the DUT, and an estimated acceleration factor. We concluded this paper in Section 5.
MATERIALS AND METHODS
In this section, a description of the DUT is presented. A description of the experimental conditions and obtained results is also presented.
Test Samples
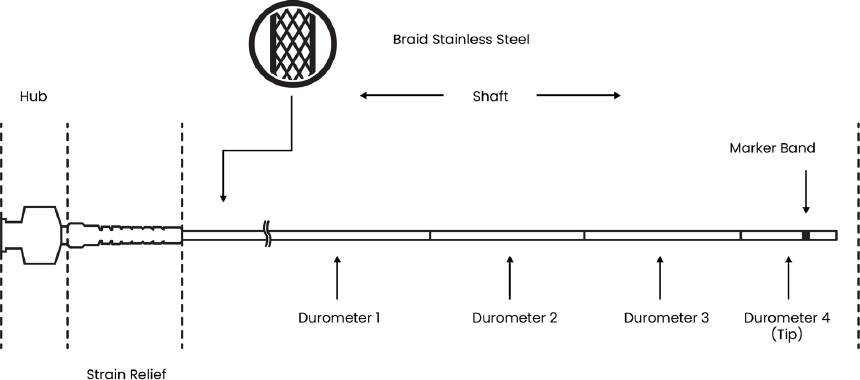
The DUT are intravascular catheters over the wire (OTW) single-lumen with atraumatic distal tip designed for use in the peripheral vascular system. The Intravascular catheter consists of a lubricious inner liner, a stainless-steel braid over the liner, and a shaft (outer layer) that involve different polymers. The shaft is bon-ded with a polymeric distal tip trough out a thermal fusion method. Additionally, a radiopaque marker band is positioned on the distal tip, and a hub is attached to the proximal end of the intravascular catheter. The distal tip is made from a polymer with low stiffness in comparison to the catheter shaft polymers. For the distal tip, low stiffness is required to passage through curved pathways in the vasculature in an easy and non-traumatic manner while the catheter shaft requires greater stiffness to achieve precise transmission of the movement carry on by the physician’s hand up to the tip of the device. This mechanical property is required to successfully navigate the vascular system [25]. The DUT have an outer diameter of 6 French size or 1.92 mm, an inner diameter of 1.58 mm, and they are available in a variety of lengths. An illustration of the DUT is presented in Figure 1.
Experimental Setup and Test Conditions
The DUT claim a shelf life of two years when they are stored in temperature-room conditions (from 20 °C up to 25 °C). Thus, the ADDT was based on thermal stress to obtain the tensile strength degradation data. The thermal stress was conducted in calibrated ovens with a constant aging temperature of 50 °C, 60 °C, 70 °C and 80 °C. The temperatures were defined with increments of 10 °C to adhere to SDOs, such as the test schemes defined in ASTM F 1980-7 and AAMI TIR17. The first accelerated temperature was defined as 50 °C to increase the aging rate, which would be less if the initial temperature was set at a lower value. Furthermore, maximum test temperature is suggested to be 60 °C [2] if the aging test is based on the van’t Hoff’s observation, as non-linear effects may be expected in the polymeric systems. Based on this, it is considered to extend the temperature beyond 60 °C to two more increments as 70 °C and 80 °C, in the aims of explore this non-linearity of the temperature effect. It should be noted that test temperatures below 60 °C are recommended given that the van’t Hoff’s observation gives an empirical estimation that tends to be linear across the temperature ratios in (1).
There were six tensile strength measurements obtained from the DUTs from 15 days up to 75 days (15, 30, …, 75) at the four different levels of temperature. In addition, the experiment included 6 units that were not subjected to the thermal stress at the beginning of the experiment. In total, 144 units were subjected to the thermal stress conditions and tested according to the time schedule. Figure 2 represents a schematic of the experimental set-up.
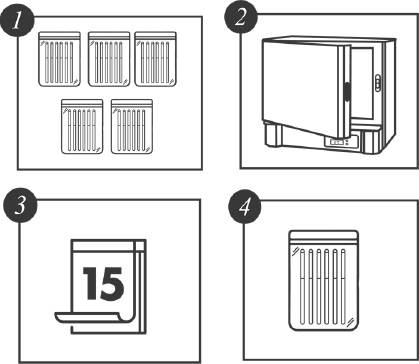
Figure 2 Accelerated Degradation Destructive Test Experimental Set-up. Five groups of six catheters each (1) per temperature were placed in the oven (2). Every 15 days, a group was withdrawn (3 and 4) and tested.
The tensile strength testing was performed according to the methodology described on Annex B of the ISO 10555-1:2013. This standard specifies the general requirements for intravascular catheters. Annex B describes the method for determining peak tensile force. Table 1 was used to select the test conditions; for a gauge length of the test piece of 10 mm, a test speed of 200 mm/min is obligatory. Using a calibrated Chatillon force measurement system, the tensile force was applied to the catheter shaft and distal tip bond until the test piece separates into two or more pieces. The peak tensile force in N reached by the tensile testing of the DUT was recorded. Prior to performing the tensile strength test, the DUT were conditioned in an aqueous medium at 37 °C ± 2 °C for a period of 2 hours, which represents the expected clinical conditions for the devices. Immediately after conditioning the tensile strength test were performed [26]. Figure 3 represents the test conditions.
Table 1 Accelerated degradation test plan.
| Temperature (°c) | Days | ||||||
|---|---|---|---|---|---|---|---|
| 0 | 15 | 30 | 45 | 60 | 75 | ||
| -- | 24 | 0 | 0 | 0 | 0 | 0 | 24 |
| 50 | 0 | 6 | 6 | 6 | 6 | 6 | 30 |
| 60 | 0 | 6 | 6 | 6 | 6 | 6 | 30 |
| 70 | 0 | 6 | 6 | 6 | 6 | 6 | 30 |
| 80 | 0 | 6 | 6 | 6 | 6 | 6 | 30 |
| Totals | 24 | 24 | 24 | 24 | 24 | 24 | 144 |
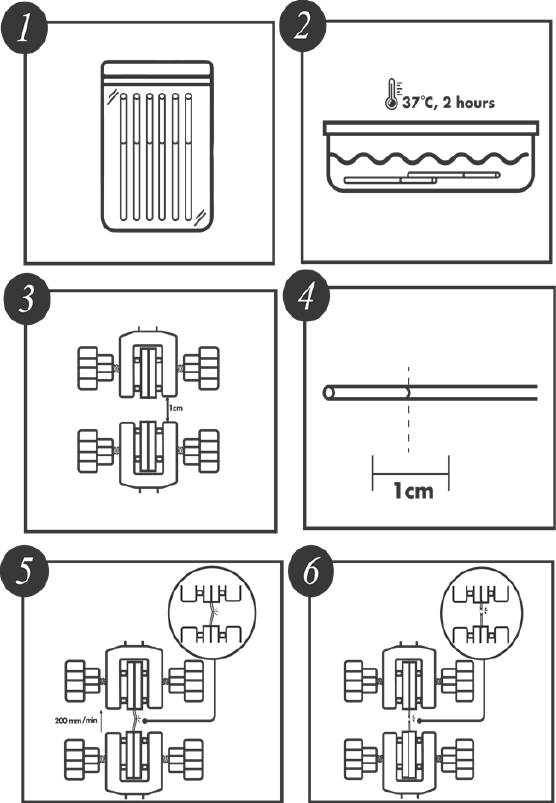
Figure 3 Accelerated Degradation Destructive Test Conditions. A group of catheters (1) is taken and conditioning in an aqueous medium at 37 °C ± 2 °C for a period of 2 hours (2) to reflect the expected clinical conditions. A gauge length in the Chatillon and test piece is measurement at 10 mm (3 and 4). The test piece is placed between the Chatillon’s clamps and a test speed of 200 mm/min is programed. The upper clamp is raising (5) until the test piece separates into two or more pieces (6).
Test Results
The degradation data obtained from the tensile strength tests are shown from Fig. 3 to Fig.6 for the thermal stress levels of 50 °C, 60 °C, 70 °C, and 80 °C respectively. From these figures, it can be observed that the tensile strength increases and decreases over time. For this reason, we adopt a Wiener process to characterize the degradation evolution of the DUT. Furthermore, it can be noted that in all temperature levels a set of six catheters were tested to measure their tensile strength with no accelerated aging, i.e., these catheters were tested at a room temperature condition of 23 °C. It can be noted that at room temperature, the tensile strength is between 60 and 80 N in all temperature levels. This variation is expected according to the specifications of the product. Moreover, in all temperature levels, it can be noted that the higher tensile strength is observed at 15 days of temperature aging. Then, from day 30 to day 75, the tensile strength diminishes, as may be expected given the high temperature exposure. Specifically in day 30, it can be noted that at 50 °C the six DUT are overlapped at a tensile strength of 80 N approximately. However, from temperature 60 °C to 80 °C it can be noted that the strengths of the six DUT are more disperse and tend to be lower, this indeed is also due to effect of the higher temperature levels. Similar behaviors can be noted at days 45 and 60, where the tensile strength tends to be lower as the temperature increases. It should be noted that the distal tip is a polymer that is bonded to the catheter shaft trough thermal fusion. Although, it is clear that the temperature affects the strength of the polymer bond, it appears that the tensile strength increases at 15 days of temperature exposure in all temperature levels, this may be due to the effect of the temperature on the polymeric bond.
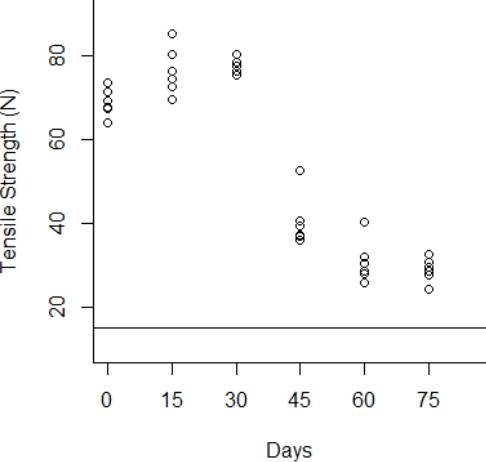
Figure 4 Behavior of the tensile strength degradation at 50 °C. The horizontal line at 15 N is the degradation critical level.
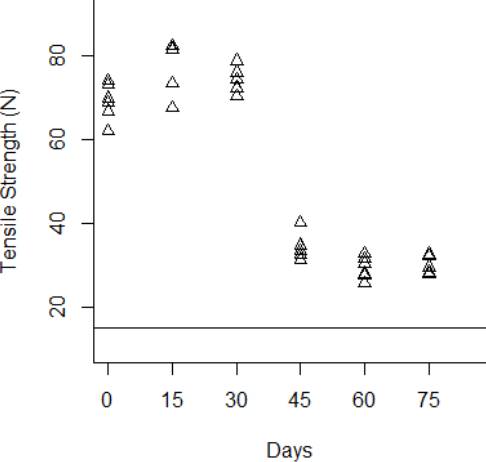
Figure 5 Behavior of the tensile strength degradation at 60 °C. The horizontal line at 15 N is the degradation critical level.
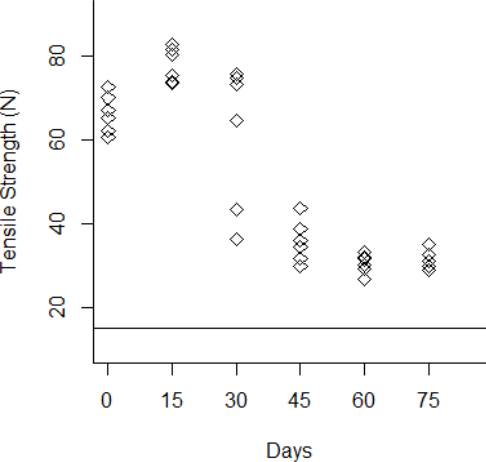
Figure 6 Behavior of the tensile strength degradation at 70 °C. The horizontal line at 15 N is the degradation critical level.
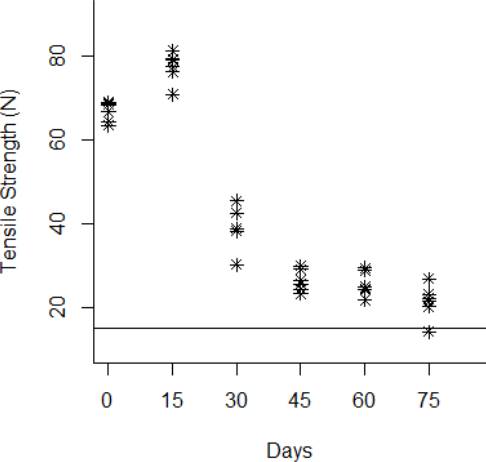
Figure 7 Behavior of the tensile strength degradation at 80 °C. The horizontal line at 15 N is the degradation critical level.
According to ISO 10555-1: 2013, a failure occurs when the tensile strength of the DUT reaches a critical level below 15 N [26]. Another difference of behaviors can be noted based on this critical level. Specifically at 75 days of exposure, it can be noted that from temperatures 50 °C to 70 °C none of the six DUT tensile strengths approaches to the critical level. However, the tensile strength for one DUT for the temperature level of 80 °C is below the critical level of 15 N, and the tensile strengths for the rest of the devices are close to this critical level.
Theory and Modeling
In this section, the used methodology in this study is described as the Wiener process with the drift parameter being considered as a function of the thermal stress level, in this case, the Arrhenius function, along with the parameter estimation method using maximum likelihood (MLE). In addition, the degradation model formulation allows performing the estimated times to failure and an accelerated aging factor in each thermal stress level.
Wiener Process and Arrhenius Relationship
The appropriate model for non-monotone degradation process as can be noted in Figures 3 to 6, is a Wiener process, which is defined as in Equation (2).
Where α is a drift parameter, the parameter σ
is known as the diffusion, and B(t) is the
Standard Wiener process. It is well known that the drift parameter
α describes the rate of the degradation process. In this
paper, it is represented as a function of the thermal stress level, the
diffusion parameter σ represents the common degradation
characteristics to all units in a population [7]. Thus, if an ADDT is considered the
degradation measurements Xik
(tj) of ith
unit i, i= 1, ..., n at the
corresponding time tj,
j= 1, ..., m for thermal stress level
k, k= 1, ..., r are
obtained. Per the independent increment property of the Wiener process, then
∆Xik
(tj)=
Xik
(tj)-Xik
(tj-1) are normally distributed
In Equation (3)α is the Arrhenius function given that ADDT uses a thermal stress. Arrhenius function is described as in Equation (4).
Where k is the reaction rate constant; A is frequency factor (a constant to be estimated); Ea is the Energy of activation (KJ/mol); R is ideal gas constant (8.314 KJ/ mol); and T is reaction temperature (°K). So that, (4) can be denoted as in Equation (5).
Where A= β1, and Ea/R= β2, for each thermal stress level Tk.
Parameters Estimation
For the PDF of the Wiener process in (3), there is a set of parameters denoted as θ= (β1, β2, σ) that need to be estimated. MLE was the parameter estimation method selected to obtain the model parameters in terms of the available degradation data.
Based on Equation (3), then the log-likelihood function for n test units, m measurements, and k stress levels can be denoted as in Equation (6).
The first partial derivatives of Equation (6) with respect to the unknown parameters θ are given in
Equations (7), (8), and (9) for β1, β2, σ respectively.
Then, the MLE of θ can be obtained by solving and maximizing the equations presented in Equations (7), (8), and (9). However, this calculation requires an iterative procedure, in this paper we considered the Newton-Raphson method, so that the Hessian or matrix of second partial derivatives of the log-likelihood function in Equation (6) is required. Let H denote the Hessian which is described in (10).
The second partial derivatives of Equation (6) with respect to the unknown parameters that conform the Hessian in (10) are given in Equations (11), (12), (13), (14), (15), and (16) for β1, β2, σ, β1, β2, β1σ, β2σ respectively.
First-Passage Time (Time to Failure)
The failure of the DUT will occur if the degradation trajectory given for the
tensile strength reaches certain critical degradation level, namely, when the
tensile force is below of 15 N according to ISO 10555-1: 2013.
For this given critical level indicated as ω, the
lifetime Tω of the DUT is then
defined as the first instant at which the trajectory
X(t)t≥0
exceeds the level ω= 15 N[26] [27]. On the other
hand, as the degradation process is described by a Wiener process as in Equation (3), then the first-passage
time Tω follows an Inverse Gaussian
distribution
Acceleration Factor
The acceleration factor is a calculated ratio of time to achieve the same level of physical property change at a stress accelerated and the use level condition (ASTM F1980, 2016). The acceleration factor denoted as L between a use level and a greater level of stress can be described as in Equation (18).
For the Arrhenius function in Equation (5), the acceleration factor in Equation (18) can be described as in Equation (19).
Where Lk is given for each thermal stress level Tk. Simplifying the acceleration factor in Equation (19), can be calculated as in Equation (20).
RESULTS AND DISCUSSIONS
In this section, the degradation modeling framework and the parameter estimates are presented to calculate the first passage time (times to failure) distribution, and acceleration factor using them as a reliability estimation approach.
Parameter Estimation
The parameters of interest θ= (β1,
β2, σ were estimated via MLE.
The maxLik function in the R software was used
to solve and maximize the log-likelihood function in (6) [28]. The code
presented in Appendix A was considered
and the obtained estimations for the parameters are presented in Table 2. By obtaining
Estimated First-Passage Time
Once the parameters of interest of the Wiener process, and the Arrhenius function
were estimated from the degradation data of the DUTs, the first-passage time
distributions for each thermal stress level were calculated. The
dinvGauss function in the R software was
used to characterize the PDF in (17), while pinvGauss function was used to
characterize the cumulative distribution function (CDF) and reliability function
R(t) [28]. The IG distribution mean
Table 3 First passage time distributions parameters for the different stress levels.
| Temperature (°C) |
|
|
|---|---|---|
| 50 | 103.79 | 146.69 |
| 60 | 100.48 | |
| 70 | 97.45 | |
| 80 | 94.68 |
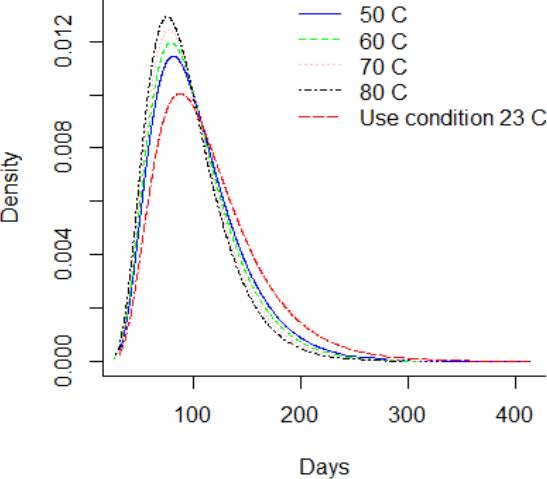
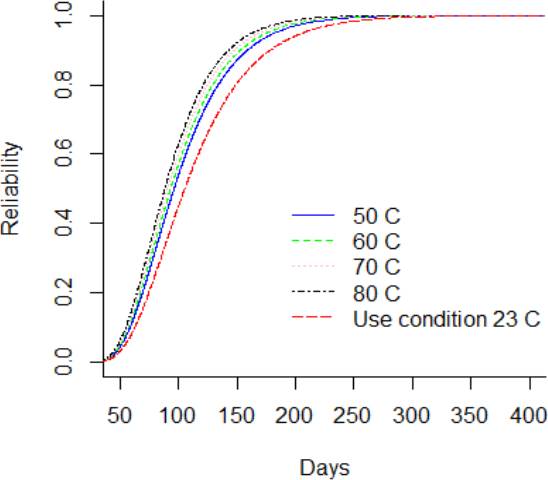
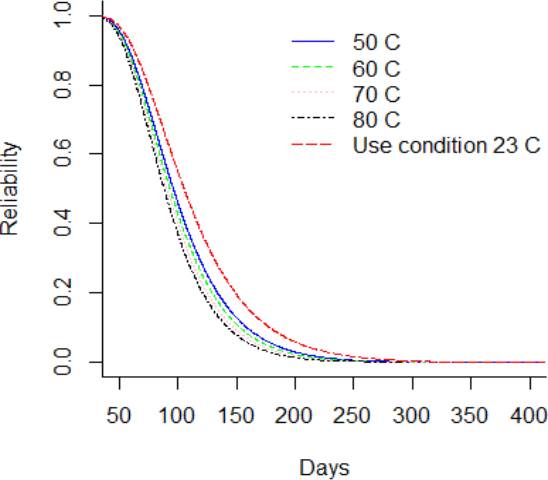
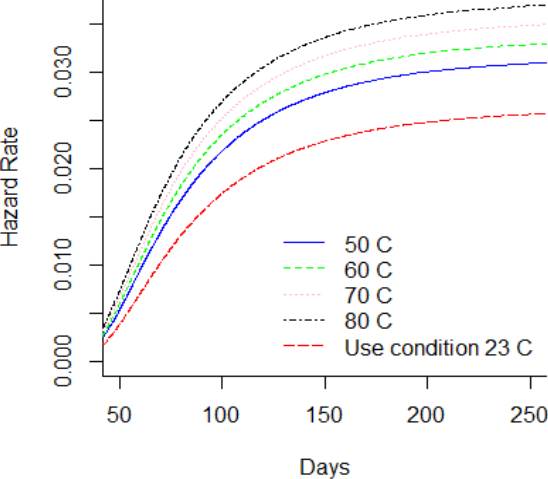
Considering, a storage or use condition temperature of 23 °C, it can be observed from Figure 8 that the PDF is lower in comparison to greater thermal stress level. Figure 9 and Figure 10 showed the CDF and their function of complement, which is the reliability function R(t). It is noted that the reliability function R(t) is greater for the DUT that are storage at use condition temperature in comparison to the DUT storage at 80°C. Also, it is noted that the reliability of the DUT storage at use condition differs from the shelf life claimed in the labeling. Otherwise, the hazard function h(t) in Figure 11 is lower for the DUT storage at condition temperature in comparison to DUT storage at 80 °C. Additionally, from Figure 10, it can be noted that the reliability of the DUTs rapidly decreases from day 60 to day 250 in all temperature levels. On the other hand, from Figure 11, it can be noted that the hazard rate rapidly increases until 150 days approximately and the stabilizes from then on. This behavior suggests that the probability of instant failure is low at 0 days of exposure to the thermal stress, then the probability increases and stabilizes as more days of thermal exposure are considered.
It should be noted that the van’t Hoff’s observation is an empirical method that has been deemed as conservative [2]. Furthermore, this method is used as an acceleration factor to estimate the time that is needed to subject a DUT under a thermal stress in the aims of simulate certain shelf life. Therefore, the aging test results in a reliability demonstration test, that considers the estimated time to subject the DUT under the accelerated thermal stress to finally test the DUT and demonstrate that the DUT has a successful performance, i.e., the tensile strength is higher than 15 N. Indeed, the ADDT presented in this study differs from this approach, given that it presents the possibility of modeling the behavior of the characteristic of interest under a certain stress factor, such that it is possible to determine a failure for a defined critical value of the characteristic under a determined stress level. This modeling of the evolution of the characteristic of interest complements the reliability estimation of the DUT beyond a reliability demonstration plan.
Estimated Acceleration Factors
The parameters of interest of the Arrhenius function denoted as β1 and β2 were estimated from the degradation data of the DUT. These parameters were used to calculate the acceleration factor for each thermal stress level based on the function in (19). The acceleration factor estimated is presented in Table 4.
Table 4 Estimated acceleration actor for each temperature.
| Temperature (°C) | 𝑳𝒌 |
|---|---|
| 50 | 1.10 |
| 60 | 1.14 |
| 70 | 1.17 |
| 80 | 1.21 |
From Table 4 it can be easily found that the acceleration factor becomes smaller as the thermal stress decreases. For 50 °C, the acceleration factor is 1.10 while for 80 °C is 1.21. That means that the ratio of time to achieve the same level of change in the tensile strength tends to be one, as the accelerated temperature approaches to the temperature of the normal use condition. Otherwise, a higher acceleration factor compensates for the effect of thermal stress to estimate the normal use condition. These acceleration factors are smaller compared to the ones that can be estimated based on the van’t Hoff’s observation. As previously discussed, the van’t Hoff AAF tends to stablish conservative estimations. Based on the function in (1) and the estimated acceleration factors in Table 4, the Q10 that must be considered for the characteristic studied in this paper results in Q10= 1.03. This differs from the Q10= 2 empirical value which may result in early failure of the DUT, even before their expiration date.
CONCLUSIONS
This paper presents an ADDT as an alternative to the accelerated-aging policies based on standards and guidelines.
Many accelerated aging methodologies are available to evaluate the reliability of the medical devices during their design and development. However, currently, there is not an official method. ADDT performed in this study can be used as a helpful custom method based on a critical performance characteristic of the medical device specifically intravascular catheters, under the assumption that the tensile strength follows a Wiener process and the constant-stress loading used is the temperature. It is noted that the proposed method can determine the lifetime distribution in function of time and thermal stress levels to provide data that support the shelf life, and the storage ambient conditions claimed in the medical device labeling. However, the results to support the shelf life found in this study differs from the results obtained from the traditional method of accelerated aging Q10= 2. Therefore, real-time aging data continue to be necessary to validate the shelf life.
Future work could tackle several topics, one of them is to estimate the Ea as a random parameter. The constant activation energy and constant reactant concentrations is an assumption that has been used in this study. This assumption may be evaluated differently, as a parameter to be estimated to provide a highly accurate estimate of real performance. Another topic, consist in consider the unit-to-unit heterogeneity, in theory, the intravascular catheters use the same materials and manufacturing process, however, in the practice there are differences, so that, the degradation rates for the individual system are different. For this reason, the heterogeneity among the units should be incorporated into the Wiener process in the diffusion parameter. Finally, as a validation process it may be possible to test intravascular catheters under a certain condition until failure in the aims of confirm the MTTF estimation presented in this paper. Finally, an important topic for future research may be to subject an efficient sample size of DUTs to validate the estimated MTTFs for every temperature level. Although, it must be considered that the accelerated test is destructive with constant stress levels, which means that the equipment’s must be used for large periods.

