


 nueva página del texto (beta)
 Inglés (pdf)
 Artículo en XML
 Referencias del artículo
 Enviar artículo por email
 Citado por SciELO
  Similares en
SciELO
Similares en
SciELO 
 Permalink
INTRODUCTION
Epilepsy is the most common neurological disorder, affecting around 30 million people worldwide [1]. At a neurological level, epilepsy manifests itself as electrical discharges in neuron populations, that can produce muscular contractions and loss of consciousness [2] [3] [4] [5] [6]. These disorders affect the daily life of patients and impedes them from performing certain tasks at work, driving, and swimming when unsupervised; hence, the interest in researching new ways to diagnose and treat epilepsy.
Current treatments for epilepsy involve drugs that can reduce the incidence and/or intensity of seizures up to a 70% of patients. For the remaining 30%, who have drug-resistant epilepsy, other treatments are being tested. Of these, brain surgery has been the most successful [4]. Brain surgery, however, is not a viable treatment in all cases, and even when performed, only 58% to 73% of patients will be free of impairing seizures [7] [8].
Despite the ratio of success of surgical procedures and drug treatments, patients who suffer impairing epileptic seizures are also prone to suffering other psychiatric affections, such as anxiety and depression [7] [8], both caused by the uncertainty as to when the next seizure will occur. The unpredictable nature of epilepsy and the lack of understanding of how epileptogenic conditions emerge in the brain, have led to the development of several techniques for estimating the beginning or onset of an epileptic seizure [8]. The aim is to understand the conditions that lead to seizures and use this information in seizure prediction models in order to prevent the onset of epileptic crises in patients.
Most seizure prediction models (SPMs) are based on the analyses of recorded electroencephalographic signals (EEG), a common diagnostic procedure. SPMs derived from analyses of EEG signals are constrained to physiological and mathematical assumptions [9]: the former holds that changes in brain activity and its associated electrical signals appear before seizures and can be acquired by EEG, while the mathematical assumption refers to a commonly implicit, but not well understood, statistical relationship between past and future observations of the EEG signals. These two assumptions lead to consider that is possible to predict seizures based on EEG recordings [9].
In general, SPMs based on EEG signal processing, consist of three stages [10, 11]: preprocessing the EEG signals, extracting features from them, and classifying of brain electrical activity. One current challenge in this approach is to successfully o discriminate the different epileptic seizure stages such as interictal, preictal, ictal and post-ictal stages [9] [10] [11] [12] [13] [14].
Depending on the method used in feature extraction, SPMs can be classified as: time-frequency methods, nonlinear measures, or statistical parameters of the signals [8] [10] [14]. Most of the time-frequency methods -e.g. as spectral power and connectivity- only function under certain limitations related to a limited temporal resolution. Additionally they assume linear interactions of the signals and disregard non-stationary properties [15]. Nonlinear methods are preferred since it is assumed that they preserve the nonlinear nature of EEG signals [10] which is closer to their real behavior [16].
Phase synchronization analysis of EEG signals is now a promising approach for understanding brain dynamics because it has shown that some changes occur in the synchronization and connectivity of brain networks during seizures [17]. The premise is that different areas of the brain may come to be connected between each other during an epileptic seizure [6]; that is. two distinct brain regions with oscillatory electrical activity will show phase synchronization though they are not anatomically adjacent. This phenomenon is known as functional connectivity. It has been widely reported that functional connectivity can be affected by brain pathologies, such as epilepsy [21].
In the past decade, synchronization indexes have been used in epilepsy analyses during preictal/ictal stages, Haitao et al. for example, showed that synchronization between distant areas of the brain increases in epileptic patients [18]. While Alaei et al. [19] proposed the mean phase coherence index as a feature to determine the preictal stage in patients, and Detti et al. [12] proposed an SPM whose features, obtained from synchronization measurements in ictal and preictal stages, was able to predict the onset of seizures with high accuracy. These features were obtained by analyzing phase synchronization between each pair of EEG channels and selecting the most appropriate pair by inspection.
In this work, we propose the instantaneous phase difference index (PDI) as an alternative approach for analyzing EEG signals to discriminate the preictal/post ictal and ictal stages. To this end we compared the performance of our index against Phase Locking Value (PLV), Phase Lag Index (PLI) and Phase Linearity Measurements (PLM) in two EEG databases and applied a Kruskal-Wallis test based on characteristics of their phase differences or synchronization value distributions in each epileptic stage.
MATERIALS AND METHODS
Databases
In this work we analyzed two databases. The first consists of EEG recordings and the second of intracranial EEG recordings (iEEG).
Database 1
These EEG signals were obtained from Zenodo “A dataset of neonatal EEG recordings with seizure annotations” [20]. This dataset contains 79 recordings of neonates acquired by a clinical team due to suspicions of seizure activity. The EEG recordings have an average recording time of 74 min, and were recorded with a NicOne EEG amplifier using a sample frequency of 256Hz, with 19 electrodes positioned according to the 10-20 International System with referential montage. Two additional channels were included in the recording, which contain ECG and respiratory signals from the patients. Three experts (identified as A, B and C) were asked to individually annotate seizures with a clear onset of abnormal electrical activity. Seizures were defined by a duration of over 10 seconds
Of the 79 initial recordings of patients in database 1, 29 were chosen for further analysis because they showed lateralized epileptic seizure annotations. However, based on the criterion that at least two of the experts had to agree on the starting times, only 20 seizure events were chosen.
A window containing 15 seconds before and 15 seconds after the starting time of the seizure was cropped from the original recording and preprocessed for further analysis.
Database 2
Database 2 consists of iEEG signals, obtained from the “American Epilepsy Society Seizure Prediction Challenge”. It contains a variable number of interictal/ ictal test samples of one second iEEG recordings for each subject. For our work only the first 20 interictal samples and the first 20 ictal samples per subject were chosen for further analysis. The number of channels also varied from subject-to-subject, but all channels available from each subject were used in the subsequent analysis.
Methods
Phase synchrony metrics has been proposed as a way to estimate the degrees of functional connectivity [2]. Most of the approaches proposed to analyze connectivity are based on the frequency domain and operate under certain assumptions such as: stationary signals and limited temporal resolution. These techniques also assume linear behavior and interactions between signals [15]. But these considerations are not always consistent with the real behavior and properties of EEG signals.
We consider EEG to be the result of nonlinear dynamic processes in the brain, and seizure events as a non-stationary process [16] that may be evidenced by changes in phase synchrony indexes before and after the onset.
Phase Locking Value (PLV)
In literature, several phase-based indexes have been proposed, one of which is the Phase Locking Value (PLV), proposed in [15]. PLV was the first synchronization index approach to determine the synchronization between two signals in terms of their phase, φ1 and φ2 as:
where ∆φ is the phase difference between two signals whose synchronization is being estimated.
In this sense, PLV has a range of 0-1, where 0 corresponds to no synchrony and 1 represents total synchrony between signals. Lachaux et al. introduced the N term in order to test the synchrony of both signals against N trials, expecting a reduction of spontaneous synchronization.
Phase Lag Index (PLI)
Another approach to determining the synchrony between two signals is the Phase Lag Index, (PLI), proposed in [22]. In this case, synchrony is analyzed in terms of phase difference, ∆φ, as
where sign [] is the sign function and ⟨⬚⟩ is the mean operator. PLI returns an index of synchronization in a range of 0-1. A PLI index equal to 1, means that the phase difference between two signals modulus is equal to zero, i. e. both signals contain information from the same brain source, and this value does not represent true synchronization.
Phase Linearity Measurement (PLM)
A third method is Phase Linearity Measurement (PLM), proposed by Baselice et al. [23]. PLM analyzes phase differences as a function of time in narrow frequency bands, from -B to B, that can be determined as
This approach introduces a first order model phase differences that is dependent on the instantaneous frequency of the signal, instead of a constant one, as in the PLV and PLM indexes.
Phase Difference Index (PDI)
From Equations (1), (2), and (3) we can observe that the PLV, PLI and PLM indexes are surjective functions over the ∆φ set. However, the use of surjective functions does not preserve the full relationships between the elements of the set applied to, resulting in information loss.
Phase difference ∆φ is a discrete variable, with values in a range of π to -π, whereas the PLV, PLI and PLM functions all have a range of 0-1. This limited range also results in information loss that can be demonstrated by calculating the probability of any outcome δ1 for the ∆φ and the probability of the outcome x1 for any variable X in a range from 0-1; thus P(δ1)<P(x1). Through Shannon’s entropy definition [24], we can show that:
so variable ∆φ has greater entropy than X.
This difference in entropy from ∆φ to X led us to consider that this reduced range of the codomain of the PLV, PLI and PLM functions might be hiding part of the chaotic behavior of the EEG recordings. Hence, to avoid surjective functions we propose the Phase Difference Index (PDI), as an adequate means of analyzing the phase synchronization of EEG signals:
where φ1 and φ2 are two phase vectors of k length.
The use of phase differences to analyze EEG scalp signals could lead to the detection of spurious phenomena caused mainly by volume conduction [22] [23]. In order to test whether this phenomenon affects the ability of phase differences to discriminate preictal/ ictal signals, we calculated the phase differences: PLV, PLI and PLM indexes for database 2, which consists of intracranial EEG recordings (iEEG), where volume conduction effects are not present.
Figure 1 depicts a block diagram of proposed algorithms, where we can see the different stages in the processing of EEG signals.

Database pre-processing
In both databases a band-pass filter was applied with a bandwidth of 4Hz-6Hz (i. e. theta range). Specifically, we applied a zero phase FIR filter of 20th order, due zero padding and floating-point values of the FIR filter which results in non-zero DC gain. In this way, the DC component in the filtered signals was removed. Additionally, since the EEG signals in database 2 had a sampling frequency of 500Hz to 5000Hz, all recordings were downsampled to 500Hz.
Instantaneous phase calculation
As our aim was to obtain phase values from each sample of the signal, we considered each recording as an array of N signals obtained from electrodes placed on the brain according to the 10-20 International System.
In order to retrieve the instantaneous phase for each EEG signals (s(k)n for n = 1,2…N), we constructed an analytic signal as
where
For each phase vector φn(k) obtained from the EEG signal, we can compute the degree of phase synchronization between these EEG signals. PLV, PLI, PLM and PDI were calculated using a window of half-second or 128 samples, sliding one sample at a time. The size of the window was selected as a trade-off between the capacity to observe brain network reorganization on the sub-second time scale, as reported in [25] and to detect synchronization on the second-scale, as described in [15] [16] [17] [18] [19] [20] [21] [22].
Synchronization and phase difference matrices
For database 1, the synchronization values for PLV, PLI, PLM and PDI were obtained from s(k) n for k = 0 and stored in a 19×19 matrix. Each cell corresponds to a possible combination of the n available channels. Since Eqs. (1), (2) and (3) do not preserve the sign of the phase difference, therefore PLV, PLI and PLM are commutative between a pair of signals. As a result, the synchronization matrix will be symmetrical, with the main diagonal representing the synchronization of a given signal with itself. The diagonal of the PDI matrix will have a value of zero since it corresponds to the difference between signals from the same source. The same procedure was applied to the next sample of each sequence s(k)n for k = 1 and the resulting new 19x19 matrix was stacked behind the previous one until the sliding window reached the last sample s(k)n for k = 7554. This resulted in a 3D matrix with 19x19x7554 elements for each synchronization index PLV, PLI, PLM and PDI for each seizure event selected from database 1.
The matrices obtained can be used to show how synchronization or phase differences change over time when sliced them along the k dimension, see Figure 2.
Figure 2 Synchronization/phase difference matrix structure. The red slice can be extracted to visualize changes in synchronization/phase differences over time.
The column index from which the slice is extracted defines the reference signal to determine the temporal evolution of the synchronization or phase difference, respectively.
Since each matrix contains information pre- and post- seizure onset, the onset information will be in the center, along the k length, as Figure 2 shows. We can split each matrix in two along the k length to separate the information from preictal to ictal stages (see Figure 3.
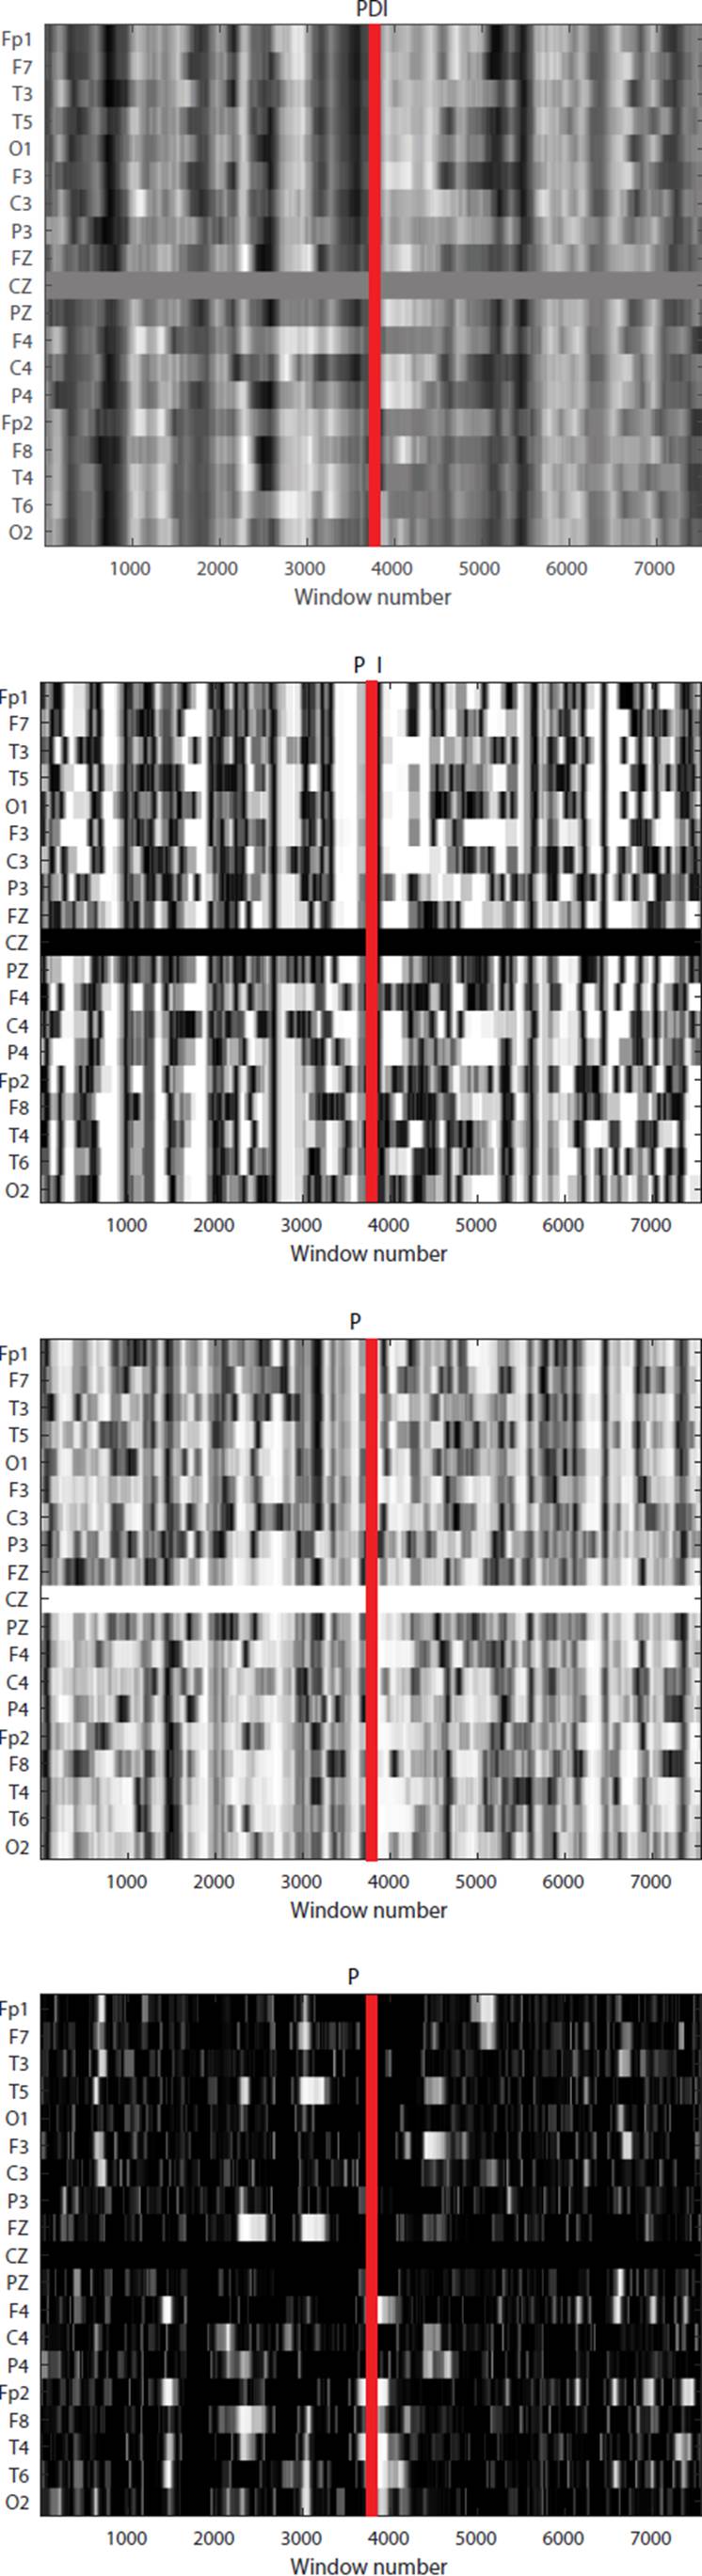
Figure 3 Grayscale map of slices along the Cz channel of the PDI, PLV, PLI and PLM matrices. A darker shade indicates a lower synchronization level. The line indicates the onset of the seizure.
For the database 2 recordings, the data processed by means of PLV, PLI, PLM and PDI were stored in matrices with the same structure as before. The only difference was in their dimensions, since each of the subjects’ recordings had distinct number of available channels.
Distributions of synchrony/phase difference values
Each matrix has dimension N×N×k, to analyze how the synchrony indexes and phase difference change as a function of time during the different epilepsy stages, we took a N×N matrix along the k dimension and generated a vector of length N with the average synchrony or phase difference values of each channel. The first element of the vector corresponds to the average value of the channel 1 in the first N×N matrix. We then proceeded to the following N×N matrices until reaching the last one. At the end we obtained k number of vectors of N length. Finally, we plotted the histogram of values of all the resulting vectors and then repeated the process with all the matrices.
Given that the ictal matrices were separated from the preictal/interictal ones, we displayed the histograms from between the ictal and preictal events. For both database 1 and database 2 recordings. We compared the ictal histograms to the corresponding interictal histograms.
Finally, we averaged the histograms per subject and analyzed how the distribution varied from the ictal stages to the interictal/preictal stages. We observed that the histograms corresponding to the interictal/ preictal stages tended to have greater dispersion than the ictal ones, these changes in dispersion led us to choose the numeric distance between the first, Q1 and the third quartiles, Q3, as a discriminator for the ictal and interictal/preictal stages of an epileptic event. A Kruskal-Wallis test was performed to probe our hypothesis.
RESULTS AND DISCUSSION
Figures 4 and 5 show box plots of the mean phase differences and mean values of the PLV, PLI and PLM histograms for the ictal and preictal/interictal states, retrieved from an EEG recordings in databases 1 and 2. We observed that changes in the distribution of the mean values of the histograms between the ictal and interictal stages of the seizure were more evident when the recordings were analyzed by PDI, whereas the distribution of the mean values of the histograms for PLV, PLI and PLM indexes showed only small changes between seizure stages.
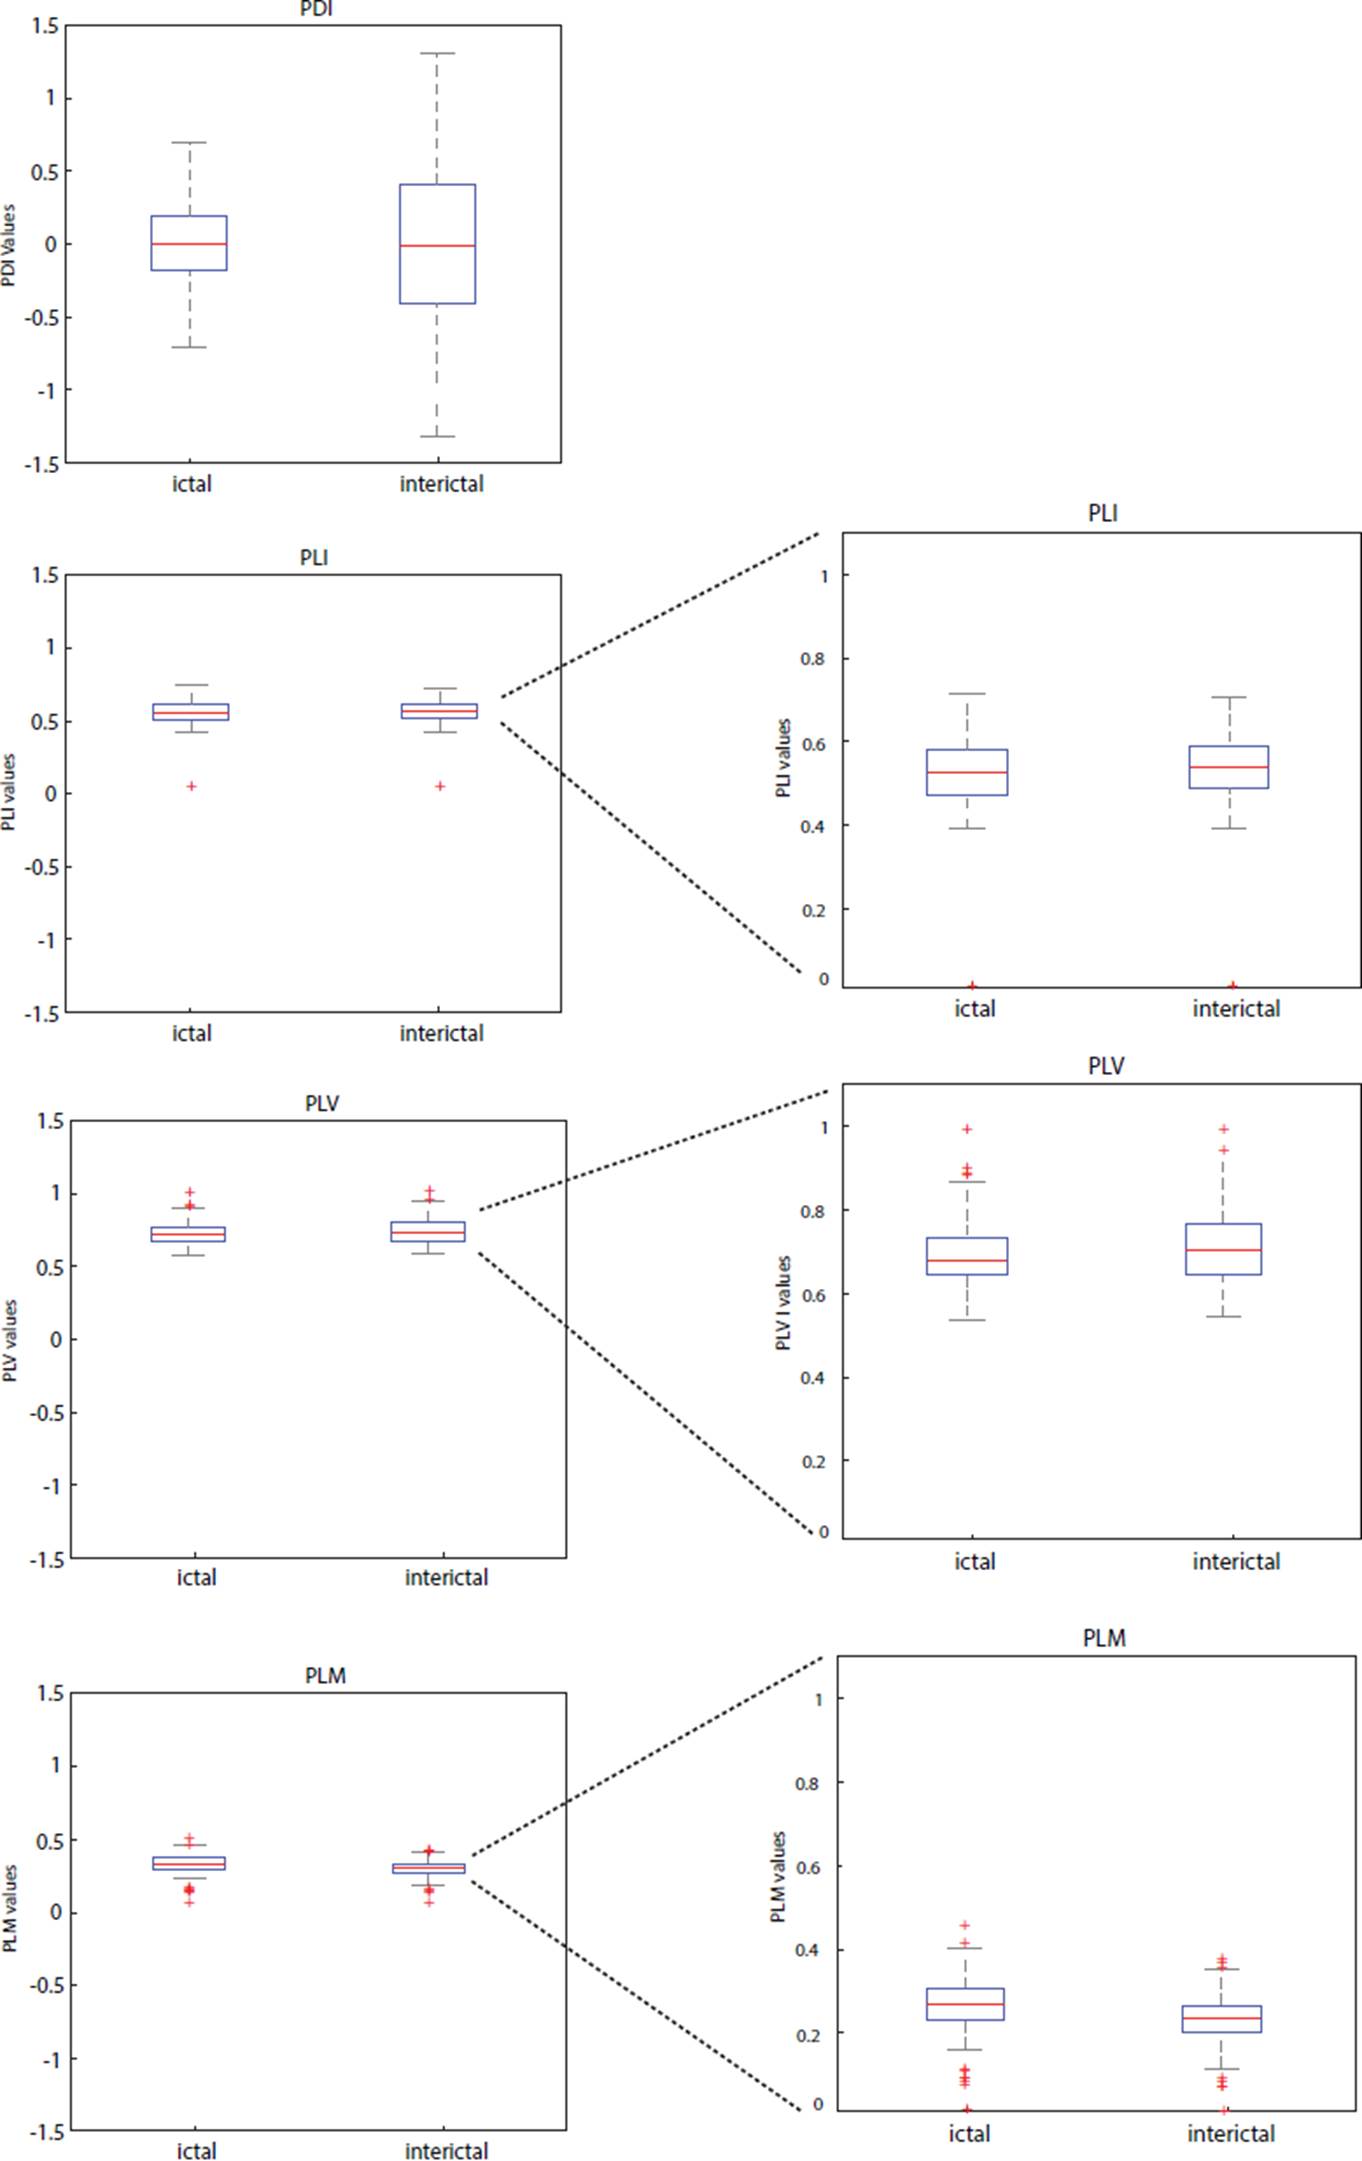
Figure 4 Grayscale map of slices along the Cz channel of the PDI, PLV, PLI and PLM matrices. A darker shade indicates a lower synchronization level. The line indicates the onset of the seizure.
Figure 5 Distributions of the mean PDI, PLV, PLI and PLM values for a crisis selected from database 2. The left column shows the distributions at the same scale; the right column shows the zoomed-in distributions of PLI, PLV and PLM.
Tables 1 and 2 summarize the results of the KruskalWallis test applied to the indexes computed from the recordings in databases 1 and 2, respectively. In both cases, the PDI performed better than PLV, PLI and PLM indexes under our testing conditions. Tables 3 and 4 summarize the Q1, Q2 and Q3 values of the distributions of the mean histograms for the PLV, PLI, PLM and PDI indexes for the ictal and preictal stages.
Table 1 Kruskal-Wallis test results for each index of the database 1 EEG recordings
| Index | p-value |
|---|---|
| PLV | 0.2235 |
| PLI | 0.3169 |
| PLM | 0.6263 |
| PDI | 0.0008 |
Table 2 Kruskal-Wallis test results for each index of the database 2 EEG recordings
| Index | p-value |
|---|---|
| PLV | 0.0615 |
| PLI | 0.4132 |
| PLM | 0.0086 |
| PDI | 0.0013 |
Table 3 Q1, Q2 and Q3 values for the mean histograms of the for PLV, PLI, PLM and PDI values computed for Database 1.
| Index | Q1 preictal | Q2 preictal | Q3 preictal | Q1 ictal | Q2 ictal | Q3 ictal |
|---|---|---|---|---|---|---|
| PLV | 0.091618 | 0.11099 | 0.12004 | 0.083648 | 0.098677 | 0.11634 |
| PLI | 0.08535 | 0.10345 | 0.12568 | 0.080434 | 0.094336 | 0.10965 |
| PLM | 0.061742 | 0.077533 | 0.10111 | 0.068173 | 0.083978 | 0.11099 |
| PDI | 0.40871 | 0.74746 | 0.94231 | 0.26251 | 0.36316 | 0.52263 |
Table 4 Q1, Q2 and Q3 values for the mean histograms of the for PLV, PLI, PLM and PDI values computed for Database 2.
| Index | Q1 preictal | Q2 preictal | Q3 preictal | Q1 ictal | Q2 ictal | Q3 ictal |
|---|---|---|---|---|---|---|
| PLV | 0.2369 | 0.31682 | 0.37125 | 0.15321 | 0.28253 | 0.37855 |
| PLI | 0.58824 | 0.66667 | 0.70588 | 0.58824 | 0.64706 | 0.70588 |
| PLM | 0.32242 | 0.38348 | 0.45536 | 0.2595 | 0.35476 | 0.4189 |
| PDI | 2.3803 | 2.8566 | 3.2211 | 2.0286 | 2.5791 | 3.0129 |
A similar performance was observed for the recordings from database 2. As the PLI and PLM indexes were developed to reduce spurious synchronization values caused by volume conduction, but PLV and PDI are susceptible to this, database 2 provided a scenario with no advantage to any index. In this case it was evident that under no volume conduction effects, PDI also performed better than the other three indexes, suggesting that PDI preserves information that is useful for discriminating the stages of epileptic seizures. This results are consistent with the results reported previously in [26] where the authors found no significant changes in the PLI mean value between the preictal and ictal stages.
Overall, our proposed index, PDI, showed a better performance in feature extraction based on the distribution analysis of phase synchronization values than other indexes developed previously. Implementing our proposed index in the processing stages of SPMs offers a feature that was not previously revealed by existing phase synchronization indexes.
CONCLUSIONS
We found that changes in synchrony occur during the onset of a seizure and could be detected by phase analysis of EEG signals. The changes in the distribution of synchronization values before and after onset identified with the proposed PDI index suggest non-stationary behavior of EEG signals as reported in [16].
The phase difference index (PDI) can be used as a feature to discriminate ictal and preictal/interictal stages with good accuracy. It offers the advantage of using a simple algorithm that results in less intensive computational tasks and has potential applications in the development of SPMs which can operate in almost real time, and be implemented in portable devices. Further development of feature extraction using PDI can be extended using of broadband phase estimation methods.
The main limitations of the PDI approach is the need for a narrow frequency band in order to obtain interpretable results, this means that a priori knowledge of the spectral distribution of energy of the seizure events is required. We recognize that this approach neglects interactions that may occur between different frequency bands. Although approaches to calculating broadband synchronization between signals have been developed [26] [27], they still have the limitation of being surjective functions that, as the presented work shows, can obfuscate information contained in the EEG recording.

