


 nueva página del texto (beta)
 Inglés (pdf)
 Artículo en XML
 Referencias del artículo
 Enviar artículo por email
 Citado por SciELO
  Similares en
SciELO
Similares en
SciELO 
 Permalink
INTRODUCTION
The analysis of medical images is a recurring process in the medical branch in order to obtain correct results on the detection and location of objects that determine a diagnosis or the course of a treatment to monitor changes obtained by medical methods depending on the disease, the success of a diagnosis depends significantly on the ability of a professional to visualize the object of study.
In the methodology of an artificial vision system, the segmentation stage is carried out in order to locate the objects of interest to determine the existence of any disease or results of surgery or treatment. The digital images obtained from the photographs taken to the fundus of the eye (Retinographies) give the opportunity to search for lesions that obstruct the patient's vision that leads to total loss of sight or even to be able to observe the results of a treatment applied to prevent the damage from expanding and see the positive results of medication or any surgical intervention.
Diabetes mellitus is a major health problem worldwide that is estimated to reach 592 million in 2035 [1]. In different specialized magazines, DR is the most frequent complication of long-term diabetes mellitus [2].
In the “Encuesta Nacional de Enfermedades Crónicas” (ENEC) or The National Survey of Chronic Diseases (NSCD) reports that, in Mexico, diabetes mellitus has been identified as a serious public health problem with alarming numbers that rank from 12 to 14 million people with this disease, of which it stands out that approximately 40% suffer from retinopathy [3].
DR is the third leading cause of irreversible blindness in Mexico and is presented as the main disease in people of productive age between 14 and 64 years in developing countries. The patients with Diabetes Mellitus, 10% have visual limitation and 2% suffer from total and irreversible blindness [4].
This visual complication is becoming more and more frequent among the young population and that brings with it the increase in cases of disability pensions, due to the partial or total loss of the sense of sight that results in a significant economic expense. See Figure 1.

The lesions that occur with DR vary in size and color; this is a relevant feature that allows classifying one from the other. The present work covers the most common types of lesions that allow early detection of DR: Exudates and Microaneurysms. See Figure 2.
Computer-aided programs exist for the detection of glaucoma, macular degeneration, and the detection of retinopathy of prematurity; however, the main screening application focuses on the early detection of diabetic retinopathy.
Computer-aided diagnosis is one of the most common and essential tools today, where medical images play an important role in the creation of image processing techniques. Usman M. Akram [5] developed a proposal to detect dark and bright lesions within a retinography, taking these two as the main descriptors of the objects of interest.
As an antecedent, the method proposed by Balazs Harangi and Andras Hajdu [6] is taken into consideration, which creates an algorithm divided into 3 stages, which are the extraction of candidates, precise segmentation of contours and labeling of candidates with true or false values, which is based on grayscale morphology that allows to identify the bright regions and then extract the precise limit of the objects presenting a method based on active contours to increase the precision of the segmentation. Then, a regional classifier is applied to eliminate false positives considering the characteristics based on regions and thus obtain the appropriate descriptors to train a Naive-Bayes classifier with which they obtained a sensitivity of 0.92, a specificity of 0.68 and an accuracy of 0.82.
Microaneurysms are a lesion to which several investigations have been assigned for the automatic detection of these, researchers from the University of Guadalajara in conjunction with researchers from the merida technology [7] developed a methodology based on the creation of masks that allowed to separate and identify the objects of a digital retinography and using the area size descriptor according to the number of pixels of each object.
There are segmentation algorithms [8] in order to identify objects that are not part of the disease, such as blood vessels, since they are present in all retinographies in order to eliminate objects that do not represent an injury to the eye, a semi-automatic method developed to measure and quantify the geometric and topological properties of vascular trees in which 3 stages are proposed: thinning, branching and crossing, where the insertion points are identified to segment the union between them, labelling and storing a code chain. This method recognizes areas and angles, obtaining geometric data and connectivity information.
There are computer-assisted diagnostic systems such as RISA [9] that, using the morphology of the vascular tree, allow the detection of veins and arteries, allowing the rest of the scene to be isolated and separated, leaving only foreign objects on the retina. It is a scalable system that can be nourished by this type of research and more robust methods. RISA transforms a retinography into a binary image, obtaining the objects of interest to obtain information from their characteristics using morphological changes of the images.
The objective of this type of methodologies is to generate the necessary information to carry out training of learning algorithms, if the quality of segmentation and certainty are high, better results are obtained during training.
MATERIALS AND METHODS
The data set used for the experimentation of the two proposed methodologies is MESSIDOR, which is a database established to facilitate studies on the computer-assisted diagnosis of diabetic retinopathy. The database contains 1200 color images obtained by ophthalmology departments using a non-mydriatic TRC NW6 ophthalmoscope with a 45-degree field of view, of which 800 photographs were taken of patients with dilated pupils and 400 without dilatation. The images were captured using 8 bits per color and with the following sizes: 1440x960 pixels, 2240x1488 pixels and 2304x1536 pixels [10]. Derived from the variation in sizes, a standard resize is applied to 512x512 to avoid variations in the results.
A methodology is proposed for the detection and extraction of shiny lesions that signify the presence of exudates in the retina, due to the color and intensity of brightness, these objects can be highlighted over the others to achieve an extraction of the objects in question, the proposed methodology includes by 3 stages: Preprocessing, Exudate extraction and Elimination of false positives (FP).
a) Preprocessing
Because the retina does not have any type of internal illumination, the little or no illumination can be uniform and with a low contrast, which is why preprocessing is used to highlight and contrast the objects that exist in the scene [11].
The image preprocessing consists of three steps on the original image, in a specific order to enhance the objects and give more probability of success to the next phase, the steps are: Elimination of noise, Extraction of the green channel and Conversion to scale of gray.
Noise is an effect that appears in all existing digital images, it is the random appearance of signals captured by an acquisition device, which do not belong to the original scene [12]. It is a very noticeable effect in the images that are taken in places with low luminosity, such as the back of the eye. For this case, the Gaussian smoothing filter was chosen since it is the most effective in eliminating noise in medical images due to the noise inherently generated by the capture sensor due to the low level of illumination and its own temperature, and even more. due to the circuits of the devices that cause their own noise of the electronic circuit and to blur the image in such a way that the gradient of the shiny objects is more uniform and thus distinguish from their soft edge to their hard shape. The Gaussian filter is a low-pass filter whose coefficients are assigned by the Gaussian distribution function [13].
Figure 3 shows the transformation that results when applying the Gaussian filter to an image.
One element that serves as a powerful descriptor is color, which greatly simplifies the task of detecting and extracting objects from any scene. The colors that exist in the taking of a scene are the combination of the primary colors Red, Green and Blue in different intensities to cover the great variety of colors of the RGB Model.
With the opinion of Konstantinos Rapantzikos [14], for this methodology it was selected to choose the green channel (G for RGB) because it enhances and contrasts the shiny objects over the image background, facilitating the segmentation of the objects of interest more effectively.
Computer programs use a simple method of converting a color image to grayscale. An addition of the three RGB channels is made to obtain a single shade of gray taking different percentages of intensity of each one, for Red use 30%, Green 59% and Blue 11%, which, according to expert studies, this it is the closest way in which the human eye captures the intensity of light according to its color [15].
The function for the conversion to grayscale from the RGB color model is a mathematical expression that is applied to each one of the pixels of the image to obtain a new gray palette with different ranges of clarity. The Equation 1, is as follows:
Finally, the result of the preprocessing is shown in Figure 4, with each of its steps so that the details of the shiny objects are highlighted and the stage of obtaining characteristics can be advanced.
b) Extraction of exudates
In this second stage, the processes that lead to the identification of the shiny objects that are of interest are proposed, for this, two steps are used, which are Calculation of the histogram and Binarization to obtain all the potential candidates for shiny lesions (Exudates).
Histograms are one of the most important techniques applied for representation and management of information in a digital image and is relevant for the enhancement or segmentation tasks. There is a wide variety of software that performs this function and due to its low consumption of resources and speed it has made it essential in real-time processing tasks [16].
The group of biomedical engineers from the University of Valladolid [17] propose the use of the histogram to identify exudates in retinographies after normalizing the image to a gray scale where the exudates are transformed into objects with high gray intensities, using the average quantity of 200 pixels to identify lesions with greater intensity, the disadvantage of a fixed value is that they depend on external lighting and the ophthalmoscope focus may not perceive exudates that are captured with little lighting detail, even ignoring those that are find a recent appearance on the retina.
The resulting statistics from the histogram calculation is a graph with two axes (horizontal and vertical) in which the horizontal axis represents the gray levels that can be found in a left grayscale image where the darkest value is black at right where the maximum value is white. The rest of the clarity levels are uniformly distributed according to the number of pixels that contain the same level of gray and that set of pixels of the same tone corresponds to some object in the image.
In Figure 5 the graph that results from the grayscale image obtained in the preprocessing stage is shown in which a range of pixels that tend more to a light color is chosen because the lesions we are looking for are bright and clear.
Binarization is one of the most basic techniques of segmentation [18] with which the background of an image and the different objects that constitute it are divided. Binarization selects the pixels that have a specific value that is interpreted from the histogram calculation and thus be able to identify the objects in the image according to their brightness.
c) Elimination of false positives
Due to the similarity of brightness intensity between the exudates and the optic disc (OD), it can become confusing at the time of binarization, therefore, after performing the feature extraction stage, the OD is previously removed identified. In Figure 6 the result of the extraction step is observed, and the elimination of false positives is carried out.
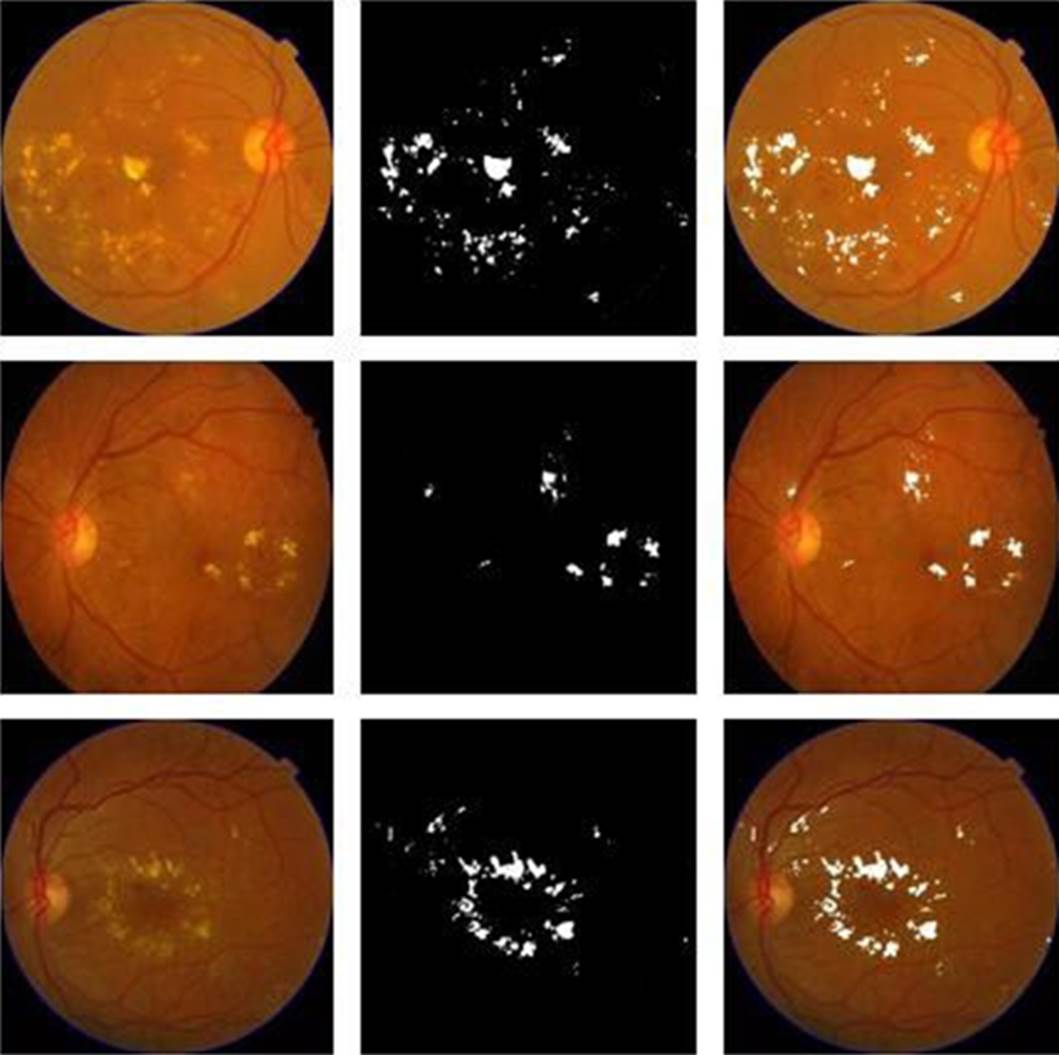
Hard and soft exudates were uniformly detected, looking for the particularity of being shiny objects and thus facilitating their detection. In Figure 7 are shown examples of original retinographies, detection of exudates in binary image and the superposition of the images as a sample of the results obtained.
The proposed methodology for the detection and extraction of microaneurysm lesions by means of digital retinographies has three stages to carry out the detection of the objects that interest us: Preprocessing, Microaneurysm extraction and Elimination of FP.
a) Preprocessing
Due to the contrast and great variety of red tones in the images, this stage is of great importance to be able to carry out the detection of microaneurysms and discuss.
The LAB color model [19] is a system that measures the three colors of RGB light in the context of specific lighting, combining lighting, color and reflective surface. Each LAB acronym includes a spatial axis in which L is light in a range from white to black, A occupies the colors between green and red, and B for the colors that are between blue and yellow [20].
After obtaining the Luminosity channel of the LAB model, an inverse or negative operator is applied that creates an inverse image from the LAB input image, being of great help in the medical field since it optimally contrasts inconspicuous objects. The transformation function is given by Equation 2.
A median filter is applied to the resulting image to remove noise. Finally, an enhanced edge enhancement is made to highlight the changes in image intensities and to be able to detect the location of the lesions more accurately. In Figure 8 the result of each step and end of the preprocessing stage is shown.
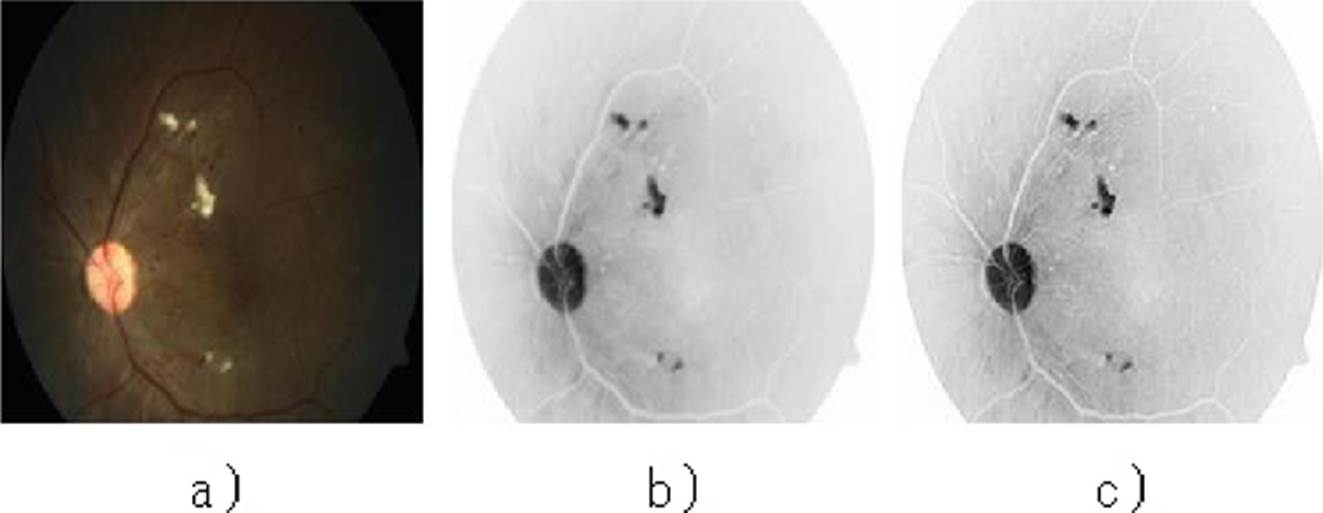
Figure 8 Preprocessing stage. a) Original image, b) Inverted L, c) Noise removal and increased edge enhancement.
The detection of microaneurysms has been studied for a long time since it is the main lesion that, if detected in time, would allow a rapid medical response to start with the pertinent treatment that can prevent vision loss. Various articles develop different types of methods for their localization, some use mathematical morphology [21] [22], some others opt for an analysis based on the characteristics of the lesions [17] [24] size, perimeter, intensity, etc. And other methods based on eigenvalues.
The purpose of these steps is to normalize the contrast of the image to have a greater range of success in the detection of microaneurysms, a suggestion proposed by Alan D. Fleming [23].
b) Extraction of microaneurysm
Based on the method proposed by J. H. Hipwell [24], the elimination of background variations is of great importance to highlight the characteristics of small round objects and classify them based on their size and intensity.
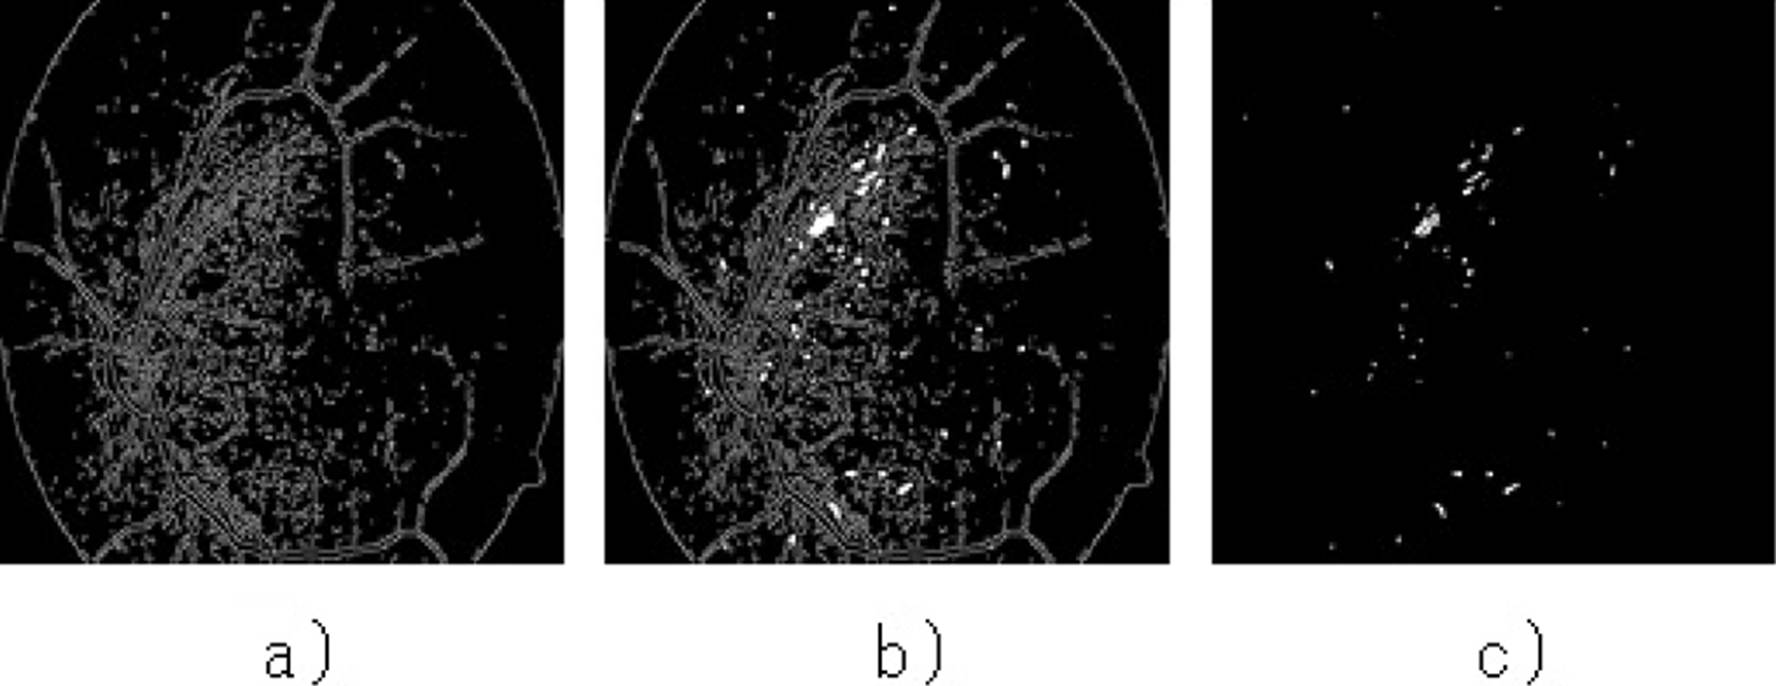
After applying an increased edge enhancement in the preprocessing stage, it is helpful at the beginning of the extraction stage as applying the Canny edge detection algorithm greatly improves the detection of the contours of objects of interest in the field.
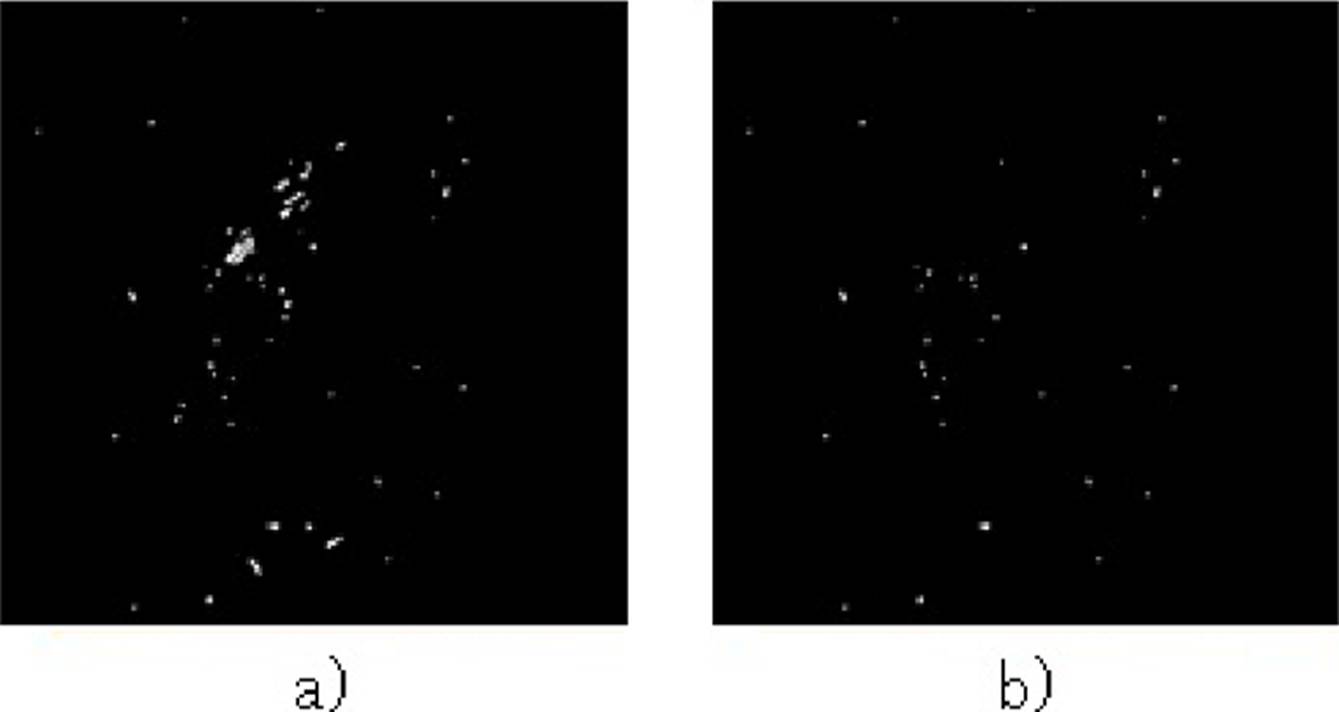
The next process consists of filling in the identified contours and subtracting the image resulting from the Canny algorithm to eliminate the edges, leaving only a binary image with the detected lesions as shown in Figure 9.
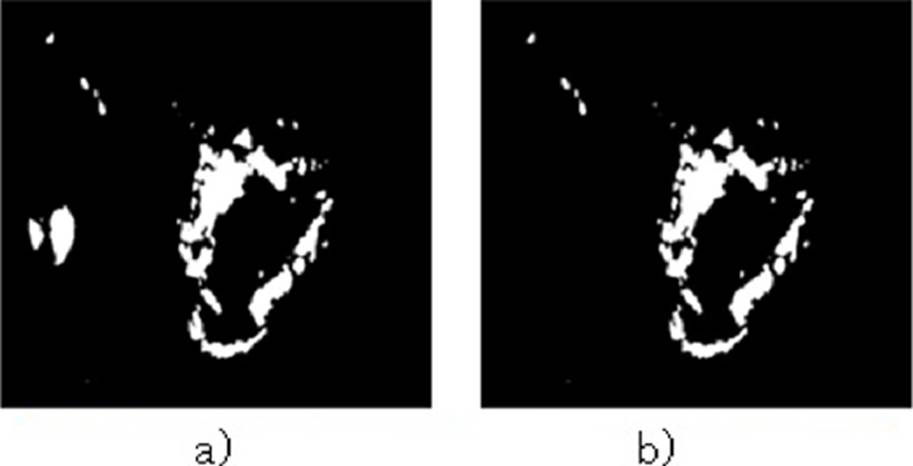
c) Elimination of false positives
The similarity of shapes between lesions can cause the detection of objects that are not microaneurysms, even the OD can become confused and appear in the final binary image to eliminate FP of this type, a function is carried out that detects the size in pixels of the detected objects, in this case retinographies of a size of 512x512 were used and the established value was no greater than 20 and the objects of greater size are eliminated.
In some cases, it was possible to identify hard exudates that coincided with the size and shape of the microaneurysms, for the elimination of these FP the first mentioned methodology was applied and with the two final images of the methodologies a subtraction of the exudates was applied to the resulting from the microaneurysms that eliminated the shiny lesions.
d) Microaneurysm detection results
The detection of microaneurysms was based on the shape of the objects, locating their edges by changing the intensities of the gray levels.
The algorithm was conceived for automatic execution, speeding up the obtaining of results from several images in a reduced time. Through the support of a specialist ophthalmologist, he verified the result of the methodology and resolved a general precision value of 0.92, number that was obtained from the division of the correct detections and the total of images processed.
In Figure 11 the result is shown, compared to the original image.
RESULTS AND DISCUSSION
For the evaluation of both lesion segmentation methodologies, a confusion matrix is made as shown in Table 1, to calculate the specificity and sensitivity of said detection algorithms and thus verify their efficacy against healthy and diseased retinographies.
True Positives (TP): It is the type of result that indicates when the algorithm has detected a lesion in a retinography where it is known that the lesion exists.
False Positives (FP): It is the type of result that indicates when the algorithm has detected a lesion in a retinography where it is known that the lesion does not exist.
True Negatives (TN): It is the type of result that indicates when the algorithm has not detected a lesion in a retinography in which it is known that there is no lesion.
False Negatives (FN): It is the type of result that indicates when the algorithm has not detected any lesion in a retinography in which it is known that there is any injury.
Table 1 Confusion matrix
| WITH LESION | NO LESIÓN | TOTAL | |
| POSITIVE DETECTION | TP = 237 | FP = 12 | 249 |
| NEGATIVE DETECTION | FN = 6 | TN = 189 | 195 |
| TOTAL | 243 | 201 | 444 |
Specificity indicates the efficiency of the algorithm to detect cases that are negative, and its formula is as follows:
Interpreting the specificity formula with the data from the confusion matrix we obtain that E= 189/ (189+12) gives a result of 0.94.
To calculate the sensitivity to obtain the efficiency of the algorithms when correctly detecting the lesions as positive, the formula is the following:
Where applying the results of the confusion matrix gives us the operation of S= 237/(237+6), and we obtain a sensitivity level of 0.975.
CONCLUSIONS
This article proposes two methodologies for the arrest of two types of lesions in the fundus of the eye from retinographies taken by an ophthalmoscope at low cost, making use of free use technologies. These processes, divided into 3 stages, are part of the development of an artificial vision system for the early detection of diabetic retinopathy to support ophthalmologists for the primary detection of the disease and to be able to treat and prevent loss of sight.
The principle of each methodology consists of enhancing the details and characteristics of the objects of interest from a first pre-processing stage to facilitate the extraction of lesions and eliminate false positives and perform the correct segmentation of the lesions.
For the detection of exudates, one of the main steps was the choice of the green channel of the RGB color model that enhances the bright objects in the scene to facilitate the localization of lesions using the data provided by the histogram and thus find the ideal threshold to terminate the binarized and segmented image. On the other hand, in the methodology for the detection of microaneurysms, the enhancement of the image edges in the preprocessing stage and its smoothing was prioritized to improve the efficiency of the Canny edge detection algorithm, which serves as the main detector of lesions and then apply the filling of the detected contours that results in the microaneurysms.
The running time of the microaneurysm detection algorithm is 0.10504865400000085 seconds per image of a size of 512x512 on a computer with a 7th generation Intel Core i7 processor, with 16 GB of RAM and solid-state disk for higher speed of writing, while the exudate algorithm was not measured because the threshold in each image varies and an average value does not give the desired results when generated automatically and they are processed individually to obtain optimal results.
Although the techniques used in both methodologies are basic, they have shown good results and a low consumption of resources, being able to execute them on computers with basic characteristics.
The results of both methodologies demonstrate a better performance than that of previously published research [6] [7] comparing specificity and sensitivity, taking specificity as the most important value when checking the efficiency of the algorithm, being able to quantify the capacity to correctly identify negative cases. Other objects that can be found in the retina such as blood vessels, optic disc, macula, and haemorrhages must be detected to proceed to the training stage to classify them by normal and abnormal objects and be successful in the stage of classification that several authors recommend the creation of a vector support machine. This article is part of a series of documents published on each stage of development of a complete machine vision system.

