


 nueva página del texto (beta)
 Inglés (pdf)
 Artículo en XML
 Referencias del artículo
 Enviar artículo por email
 Citado por SciELO
  Similares en
SciELO
Similares en
SciELO 
 Permalink
Introduction
COVID-19 is spreading across the world at an alarming rate, making the global outbreak a significant public health problem 1. One of the main reasons for the large-scale spread of COVID-19 is that an estimated 80% of carriers are asymptomatic or have mild symptoms 2. Thus, many infected people could unknowingly spread the virus 3,4. Since the COVID-19 virus remains on surfaces and in aerosols for many days under certain conditions, people may get infected by touching contaminated objects long after the carrier has departed 5.
Consequently, opportune testing of suspected cases is crucial for clinical management and outbreak control. According to the World Health Organization, the decision to test an individual should be based on clinical (symptoms) and epidemiological factors (contact with a confirmed case) associated with the likelihood of infection 6.
For suspected cases, nucleic acid amplification analysis (RT-PCR) 6 is recommended for COVID-19 testing. In some towns, cities or countries, unfortunately, the resources for such tests may be limited. Therefore, a criterion is needed to determine when to perform a test once the growing number of cases begins to surpass the resources available. Moreover, in the event that people could assure themselves of a high risk of exposure to infection, they would be more prone to self-quarantine even if they are asymptomatic.
The aim of the present study was to develop a method for evaluating the risk of exposure to COVID-19 infection based on geolocation data. The risk is expressed as a score that will be instrumental in optimizing the application of the COVID-19 test to suspected cases representing the highest probability of exposure. To implement the method, a webpage is created for uploading the geolocation data of confirmed COVID-19 cases of the previous days. The geolocation data of a suspected case is then entered into the same webpage in order to calculate an exposure risk score. The latter is computed based on the number of places where one or more confirmed cases and the suspected case were near each other within over-lapping periods. A time window after the departure of the confirmed cases is contemplated to reflect the virus survival time.
Materials and methods
Geolocation data
Modern smartphones have a variety of sensors capable of registering the coordinates, accompanied with timestamps, of the routes taken and places visited by the user. Such data could be saved as a JSON file to create a history of geolocation data, considering two attributes of interest (AOI):
Google location data
Google allows owners of a device (e.g., a smart-phone) to request the history of location data at https://www.google.com/maps/timeline. The data is sent to the e-mail account of the user in the form of a zip file containing a folder for each year that Google has collected this information. Location data for each month is stored in a JSON file, which contains data for every day of the month in the form of data objects. The placeVisit objects register the places where the user stayed for some period of time. From these data-objects, the AOI can be retrieved.
Registering confirmed cases
A person confirmed to be infected with COVID-19 should provide the location data available in a JSON file. Subsequently, an authorized person (most likely a health authority in charge of the system) uploads the file into a web service offering cloud computing services. The web service reads and parses the JSON data corresponding to the AOI of the previous N days by analyzing each placeVisit object in the file. The values are registered into a relational database, storing only the places and times but not the identity of the confirmed case to conserve the confidentiality of the data. Finally, it is possible to make queries by entering data of suspected cases into the web service.
Computing the exposure risk score
The JSON data of a person who wants to evaluate his or her risk of exposure is utilized similarly, extracting all the placeVisit objects within the last M days. The proposed method is based on the hypothesis that a person (suspected case) has a determined risk of COVID-19 infection whenever they were at the same place of a confirmed case in the same time lapse (or within a given time window following the departure of the latter).
Let ATS, DTS, ATC and DTC be the arrival and departure times of the suspected and confirmed cases, respectively. Examples are illustrated in Figure 1 of suspected cases at high, medium and low risk of expo-sure, depending on their arrival and departure times to a specific place. If there is an overlap of periods between the suspected and infected cases, a high risk of infection is assigned. When the arrival time of the suspected case is after the departure time of the confirmed case, the virus survival time must be taken into account. In the event that the arrival time is within the window of virus survival on surfaces, a medium risk of infection exists 5. If the suspected case has a departure time before the arrival of the confirmed case or an arrival time after the virus survival time, it is possible to designate low risk. A Sigmoid function is employed to compute a risk score Rk for each place k of coincidence of a suspected case with a confirmed case within the defined time window, depending on the difference between the arrival time of the suspected case and the departure time of the confirmed case (i.e., ∆(ATS -DTC):
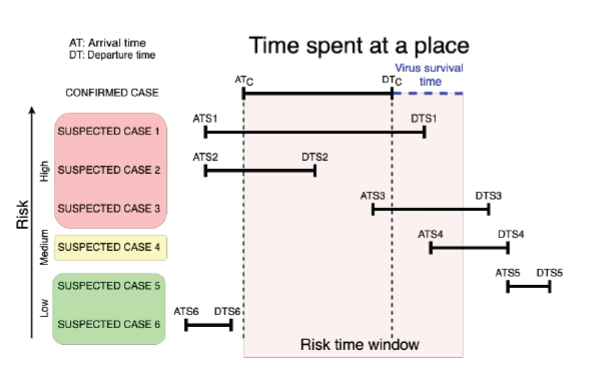
Figure 1 Diagram of the risk of infection based on the arrival and departure times of confirmed and suspected cases.
Where μ is the value in hours representing the difference between the arrival time of the suspected case and the departure time of the confirmed case that gives a score of 0.5. The real difference (∆) is subtracted from μ. The parameter λ is a constant that determines the slope of the transient region of the Sigmoid curve, allowing for control over which values of ∆ converge to a risk score of 0. As the difference between the departure time of the confirmed case and the arrival time of the suspected case increases, the risk score for the corresponding place will decrease at a rate dependent on the values of λ and µ.
Finally, a total risk score (R) is computed by adding the risk score of all the places where the suspected case and any of the confirmed cases were near according to the following rules:
The latitude and longitude of the place visited by the suspected case are equal to the latitude and longitude of the place visited by the confirmed case.
The numerical value of the arrival time of the suspected case is less than that of the departure time of the confirmed case, and the value of the departure time of the suspected case is greater than the arrival time of the confirmed case (examples 1 and 2 in Fig. 1); or the value of the arrival time of the suspected case is greater than the arrival time of the confirmed case and less than or equal to the departure time of the confirmed case plus a given range ∆T representing the virus survival time (examples 3 and 4 in Fig. 1).
Results and discussion
The present method was implemented by using Python 3.7 in the Flask web development framework 7. The geolocation data employed was extracted from the JSON files downloaded from Google and stored in a MySql database. The places where a suspected case was at risk of exposure are indicated in a map via folium 8. The system was deployed into a virtual environment by means of Ubuntu 16.04.
The method was evaluated by a simulation based on data from four people (A, B, C and D) during 20 days. The four healthy individuals signed informed consent formats and downloaded the data from the Google Takeout service (https://takeout.google.com/). They voluntarily provided the downloaded data for the sake of the simulation.
Persons A, B and C work in the same building but do not necessarily have exactly the same schedule. A and B met in a mall for 3 hours on a particular day. A and D met at a party on one of the days under study. For this exercise, A is assumed to be infected throughout the period being analyzed. For the sigmoid function that determines the exposure risk score during the virus survival time, the values of λ= 0.1 and µ= 12 were adopted. These values were defined to generate a score near 0.5 and 0 when the time elapsed following the departure of the confirmed case was about 12 h and 24 h, respectively.
Risk scores were assigned for each place at which person B was near person A within the time window (Table 1).
Table 1 Exposure risk data for person B.
| k | ATc | DTc | ATs | DTs | Rk |
|---|---|---|---|---|---|
| 1 | 3/2/20 9:10 | 3/2/20 13:21 | 3/2/20 9:09 | 3/2/20 15:35 | 1.00 |
| 2 | 3/3/20 8:26 | 3/3/20 13:31 | 3/4/20 8:57 | 3/4/20 16:05 | 0.32 |
| 3 | 3/4/20 8:27 | 3/4/20 13:41 | 3/4/20 8:57 | 3/4/20 16:05 | 1.00 |
| 4 | 3/5/20 8:36 | 3/5/20 11:12 | 3/5/20 16:37 | 3/5/20 16:44 | 0.66 |
| 5 | 3/9/20 8:22 | 3/9/20 13:19 | 3/9/20 10:06 | 3/9/20 10:42 | 1.00 |
| 6 | 3/9/20 8:22 | 3/9/20 13:19 | 3/10/20 10:25 | 3/10/20 14:38 | 0.29 |
| 7 | 3/10/20 7:18 | 3/10/20 12:39 | 3/10/20 10:25 | 3/10/20 14:38 | 1.00 |
| 8 | 3/10/20 7:18 | 3/10/20 12:39 | 3/11/20 9:03 | 3/11/20 14:13 | 0.30 |
| 9 | 3/11/20 8:24 | 3/11/20 13:10 | 3/11/20 9:03 | 3/11/20 14:13 | 1.00 |
| 10 | 3/11/20 8:24 | 3/11/20 13:10 | 3/12/20 9:18 | 3/12/20 9:30 | 0.31 |
| 11 | 3/12/20 7:52 | 3/12/20 8:57 | 3/12/20 9:18 | 3/12/20 9:30 | 0.76 |
| 12 | 3/12/20 7:52 | 3/12/20 8:57 | 3/12/20 14:49 | 3/12/20 15:07 | 0.65 |
| 13 | 3/13/20 12:39 | 3/13/20 13:36 | 3/13/20 10:19 | 3/13/20 14:15 | 1.00 |
| 14 | 3/17/20 12:42 | 3/17/20 13:48 | 3/18/20 10:11 | 3/18/20 10:17 | 0.30 |
| 15 | 3/19/20 10:11 | 3/19/20 13:32 | 3/19/20 9:39 | 3/19/20 13:34 | 1.00 |
| 16 | 3/19/20 14:07 | 3/19/20 14:19 | 3/19/20 14:08 | 3/19/20 14:17 | 1.00 |
| Risk Score | 11.59 |
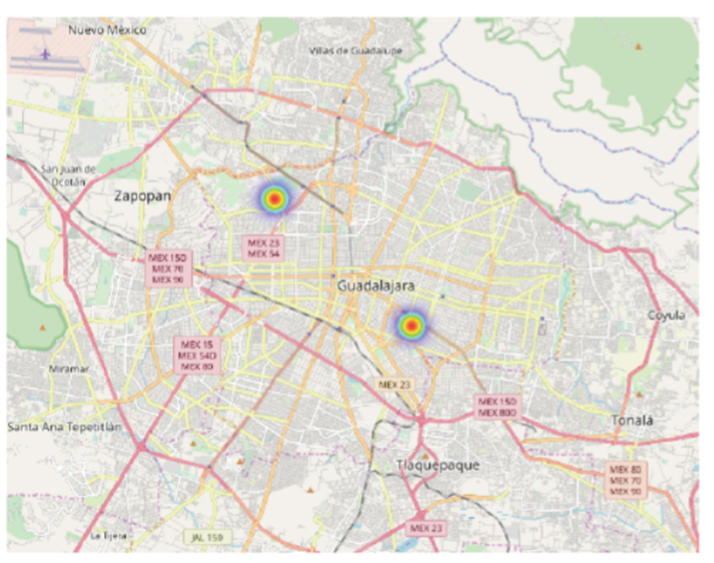
In the event that the arrival time of the suspected case was after the departure time of the confirmed case but within the virus survival time, the score is less than one. A map denoting two infection foci (Figure 2) identifies the places where person B was at risk of exposure (the workplace and the mall). The total risk score for person B is R = 11.59, which is considerably high in the current scheme.
Risk scores were designated for each place where person C was near person A within the time window (Table 2). As with person B, some of the place scores are less than one (for the aforementioned reason). The first two scores (k=1 and k=2) correspond to the same period for the confirmed case.
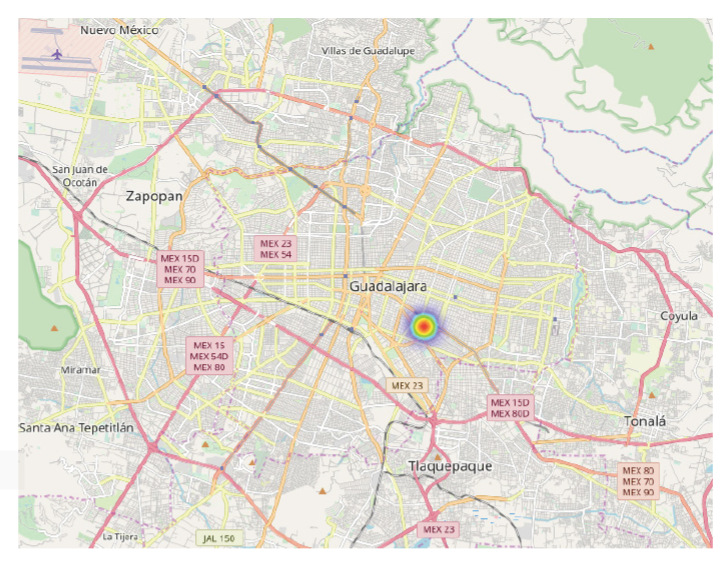
Table 2 Exposure risk data for person C.
| k | ATc | DTc | ATs | DTs | Rk |
|---|---|---|---|---|---|
| 1 | 3/2/20 9:10 | 3/2/20 13:21 | 3/2/20 7:35 | 3/2/20 9:20 | 1.00 |
| 2 | 3/2/20 9:10 | 3/2/20 13:21 | 3/2/20 10:50 | 3/2/20 16:03 | 1.00 |
| 3 | 3/2/20 9:10 | 3/2/20 13:21 | 3/3/20 7:43 | 3/3/20 9:19 | 0.35 |
| 4 | 3/3/20 8:26 | 3/3/20 13:31 | 3/3/20 7:43 | 3/3/20 9:19 | 1.00 |
| 5 | 3/3/20 8:26 | 3/3/20 13:31 | 3/4/20 7:48 | 3/4/20 13:53 | 0.35 |
| 6 | 3/4/20 8:27 | 3/4/20 13:41 | 3/4/20 7:48 | 3/4/20 13:53 | 1.00 |
| 7 | 3/4/20 8:27 | 3/4/20 13:41 | 3/5/20 7:53 | 3/5/20 8:44 | 0.35 |
| 8 | 3/5/20 8:36 | 3/5/20 11:12 | 3/5/20 7:53 | 3/5/20 8:44 | 1.00 |
| 9 | 3/5/20 8:36 | 3/5/20 11:12 | 3/5/20 16:48 | 3/5/20 16:59 | 0.65 |
| 10 | 3/6/20 10:42 | 3/6/20 14:18 | 3/6/20 16:52 | 3/6/20 19:14 | 0.72 |
| 11 | 3/9/20 8:22 | 3/9/20 13:19 | 3/9/20 7:53 | 3/9/20 9:42 | 1.00 |
| 12 | 3/9/20 8:22 | 3/9/20 13:19 | 3/10/20 7:39 | 3/10/20 8:44 | 0.35 |
| 13 | 3/10/20 7:18 | 3/10/20 12:39 | 3/10/20 7:39 | 3/10/20 8:44 | 1.00 |
| 14 | 3/10/20 7:18 | 3/10/20 12:39 | 3/11/20 7:37 | 3/11/20 8:41 | 0.33 |
| 15 | 3/11/20 8:24 | 3/11/20 13:10 | 3/11/20 7:37 | 3/11/20 8:41 | 1.00 |
| 16 | 3/11/20 8:24 | 3/11/20 13:10 | 3/12/20 7:49 | 3/12/20 8:48 | 0.34 |
| 17 | 3/12/20 7:52 | 3/12/20 8:57 | 3/12/20 7:49 | 3/12/20 8:48 | 1.00 |
| 18 | 3/12/20 7:52 | 3/12/20 8:57 | 3/12/20 15:36 | 3/12/20 19:10 | 0.63 |
| 19 | 3/13/20 12:39 | 3/13/20 13:36 | 3/13/20 15:50 | 3/13/20 16:42 | 0.73 |
| Risk Score | 13.79 |
During that time, person C left the building for some time and came back later. The total risk score is even greater for person C (R = 13.79) than person B.
A map is shown with only one place highlighted (the workplace), at which person C was exposed to the risk of infection (Figure 3). A risk score was assigned for a single place and time, representing the occasion person A and person D were at the same party (Table 3).
Table 3 Exposure risk data for person D.
| k | ATc | DTc | ATs | DTs | Rk |
|---|---|---|---|---|---|
| 1 | 3/12/20 15:14 | 3/12/20 19:33 | 3/12/20 15:01 | 3/12/20 19:16 | 1 |
| Risk Scire | 1.00 |
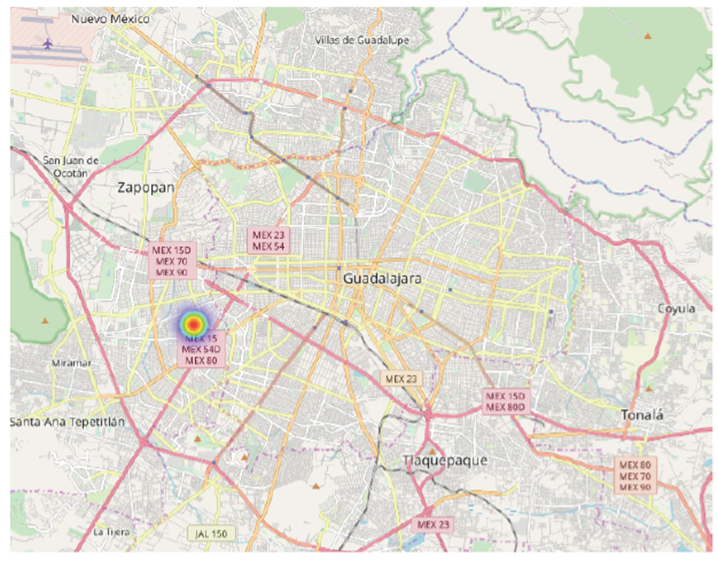
The risk score is R = 1 because there was only one occurrence. A map depicts the single place (a party) of the exposure of person D to the risk of infection (Figure 4).
The present results demonstrate that the proposed model can provide reliable exposure risk scores automatically, evidencing the feasibility of its implementation. The computed risk of exposure together with an analysis of the places and circumstances involved (with a risk score >0) may be useful for determining whether a person should be given a PCR-based test. For example, person D has a risk score of 1 due to being in the same place as the confirmed case for only 4 h on one occasion. Thus, he or she is probably not a candidate for testing if asymptomatic, since the time spent at the same place with an infected person was relatively short. However, in the event that person D shows symptoms, he or she is a likely candidate for testing, considering his proximity to a confirmed case. Persons B and C, on the other hand, are good candidates for PCR testing even if they have no symptoms because of sharing the same space with an infected person on repeated occasions for long periods of time.
An obvious limitation of the proposed model is the need for geolocation data. Although this information can be requested from the Google Takeout service, it will probably not be available for all the confirmed and suspected cases. The owner of the mobile device may not have configured a Google account in their mobile device or the location feature might be turned off.
A plausible alternative is the incorporation of a web-based questionnaire or interactive map allowing people to manually enter the locations of places visited and the corresponding times. Nevertheless, the manually entered information has the risk of being less accurate than the data obtained with the Google location files.
Implementation issues
There are two important issues to be considered for the implementation of the current methodology. Firstly, the tracking of user locations records very sensitive data. Secondly, the possibility of entering false information into the system must be confronted. Consequently, the proposed method should be implemented by a central health authority (HA), who could assure the validity of the data entered into the data-base and the anonymity of the users. The procedure for logging data into the system is illustrated with a flow diagram (Figure 5).
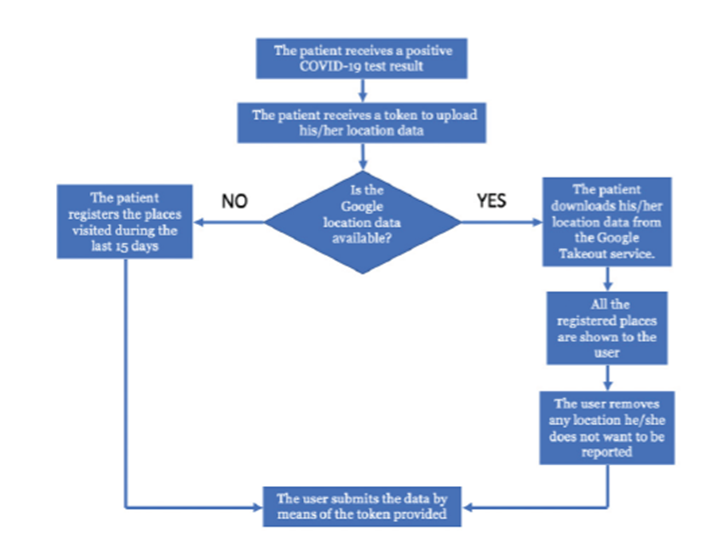
It is essential to emphasize that the computation of risk scores does not involve any information related to the owner of the device (e.g., smartphone), such as his/ her name, age, gender or address. Since public trust in the anonymity of the data collection procedure is crucial, the procedure for registering data must automatically discard any existing confidential information before uploading files to the database.
According to the proposed model, the right to upload data to the system requires a token provided by the HA to the confirmed case at the time he/she receives a positive diagnosis. The token will be generated independently of patient identity information to assure the anonymity of the data. If the confirmed case is connected with the Google Takeout service, he/she can download and review the data. The only factor that could possibly reveal the identity of the owner of the device is the location data itself. Therefore, the data collection procedure has to include an option for the interested party to remove any sensitive location data (e.g., the location of residence). After making any necessary adjustments, the user will upload the data into the system.
Conclusions
Quarantine and social distancing are recommended measures for helping to contain the epidemic 2. However, it may be complicated to impose quarantine over long periods of time since the personal and global economy is affected. Hence, a method was herein developed to confront the challenge of controlling the spread of the virus and prioritize COVID-19 testing when resources are limited.
Moreover, the information collected with the proposed procedure could lead to a better understanding of the patterns of dissemination of the virus based on the identification of the most critical places and times involved in infection. This might result in improved models of prediction for use in containing the spread of viruses.

