


 nueva página del texto (beta)
 Inglés (pdf)
 Artículo en XML
 Referencias del artículo
 Enviar artículo por email
 Citado por SciELO
  Similares en
SciELO
Similares en
SciELO 
 Permalink
Introduction
Coronaviruses (CoV) are a large family of viruses that cause symptoms ranging from the common cold to more serious illnesses which mainly target the human respiratory system. Outbreaks of coronavirus (CoV), including severe acute respiratory syndrome (SARS) -CoV and the Middle East Respiratory Syndrome (MERS) -CoV, have been previously described as a major threat to public health 1.
Notwithstanding, COVID-19 is an infectious disease caused by a new coronavirus that has not been previously identified, called Severe Acute Respiratory Syndrome Coronavirus 2 (SARS-CoV-2), which was first called a new Coronavirus 2019 (2019-nCoV). The SARS-CoV-2 causes a flu-like respiratory illness such as coughing and fever and can even reach pneumonia 2. This virus also demonstrated the ability to cause severe diseases among certain groups, including the elderly and individuals with health problems such as cardiovascular disease and diabetes 3.
COVID-19 spread from the city of Wuhan in December 2019 to other surrounding cities in China and then around the world. On March 11, 2020, the World Health Organization (WHO) declared the COVID-19 epidemic a pandemic, due to the steady increase in the number of confirmed cases worldwide, making the current coronavirus epidemic a global health threat.
By March 15, 2020, there had been more than 81,000 confirmed cases and more than 3,200 deaths in China due to the COVID-19 2,4. As a result, international air traffic was reduced and the province of Hubei was closed around 3 weeks after the start of the COVID-19 epidemic.
Despite many countries have implemented flight restrictions to China, the daily reported cases increase significantly with and without a travel history to China. These developments lead to many concerns about potential unspecified and unreported international cases of COVID-19, which could lead to new local disease hotspots.
As of March 8, 2020, the total number of cases of COVID-19 had reached 80,859, including 3,100 deaths in China, the number of infections having rapidly increased after the massive growth of Hubei province, the epicenter of the disease 4. Following the closure on February 15, 2020, the daily number of new cases reported in China began to decrease across the country, although Hubei Province reported 128 cases per day during the week of March 2-8 2020. As the epidemic continues to decrease in China, more than 700,000 cases of COVID-19 have been reported in more than 200 countries and territories outside of China, and hot spots of the disease have formed in the United States, Italy, Spain, Iran, Japan, Germany, France, and Morocco 4. Given the continuing increase in confirmed cases of COVID-19 international, it is not clear how that further outbreaks of uncontrolled virus can be prevented.
In particular, Italy has become one of the countries most affected by COVID-19, as it has registered an increasing number of cases in recent days. Therefore, it is important to monitor the evolution of these epidemics and to assess the effects of various public health measures, including measures of quarantine and social distancing in real time. A potential scenario indicates that COVID-19 cases outside of China may spread and remain undetected for a period of time, delaying countermeasures in many countries. For example, in Italy, the first case of COVID-19 identified on January 31, 2020. After 20 days, the number of cases increased rapidly, resulting in 10,149 cases including 631 deaths on March 10, 2020. Some officials believe that the spread of the virus with the unreported or undetected cases is the cause of many confirmed cases, which means that at the time where the country realize the propagation of the COVID-19, there were many chains of transmission that are difficult to contain.
On March 9, 2020, the government of Italy under Prime Minister Giuseppe Conte imposed a national quarantine, restricting population movement except for necessity, work and health conditions, in response to the growing epidemic of COVID-19 in the country. With additional lockdown restrictions mandated the temporary closure of non-essential shops and businesses. This measure is seen as a way to stop the spread of the virus that has hit Italy’s aging population. Italy’s Civil Protection Chief and Coronavirus Emergency Commissioner Angelo Borrelli said that 45% of those that have died were aged between 80 and 89, and 32% were in their seventies, 14% were over 90, 8% were in their sixties and 2% were aged between 50 to 59. Some bars and restaurants are still open, but they operate in limited hours without any commercial activities (except for supermarkets) that are scheduled to take place after 6 pm. Schools and universities are still closed; the national lockdown continues until April 3 5.
The purpose of our study is to estimate those who do not respect the national closure and then endanger their lives and those of others, by creating arguments for not staying at home. Then we investigate the effect of this population on control measures against COVID-19, for example, awareness-raising programs, and treatment control even if there is no effective drug for COVID-19. To do this, first, we present a new mathematical model that describes the evolution of the COVID-19 in a population based on the classical SIRS model.
In this model we divide the population into six groups, Susceptible, Partially controlled, Totally controlled, Infected, Recovered, and Dead individuals. We incorporate in the model we propose the awareness programs and the treatment. In view of the fact that there is no effective vaccine for the COVID-19, the recovered people after a while become susceptible again.
Second, by using a nonlinear least-squares method, we estimate the model parameters by fitting the model to real data for both cases of Italy and Morocco to predict the situation in these countries by April 2020. Finally, we investigate several scenarios of optimal control strategies to discuss the best control that should have been followed to bring the situation under control in Italy and Morocco.
Materials and methods
Presentation of the model
Nowadays, diseases can move faster than ever because of the increasing movement of people between cities, regions, and countries. However, with digital technology, information can move faster, offering individuals and societies the opportunity to protect themselves before the disease itself occurs. Public awareness is important to manage the spread of infectious diseases. Individual measures, such as increasing attention to personal hygiene and avoiding crowds, can reduce the spread of the COVID-19.
Awareness programs also help to quickly identify and deal with new cases and facilitates group responses, such as school closings or public transit systems. Over the past two decades, with Internet availability and usage increased worldwide, people get information mainly through this novel alternative method 6.
Due to the lack of efficient treatment to the COVID-19, almost all authorities around the world adopt the national lockdown, social distancing, self-isolation, and national quarantine combined with great public awareness control strategies. In response to this pandemic, Chinese, Italian, Moroccan, and other governments have ordered a nationwide school closure as an emergency measure to prevent the spread of infection. The confinement of the population determines all hygiene and social dispersal procedures, known as "barriers," according to regulations related to maintaining one meter of distance between each other in public places, and bars and restaurants put tape on floors for their customers to follow, which has been defined at the national and local levels in response to the COVID-19 in Italy. In the hours following the nationwide lockdown announcement, supermarkets in Rome and Naples were hit by panic buying 7. The Italian government was forced to reassure its citizens that the supermarkets would remain open and stored in the market around the clock 8.
Over the past two weeks, Italy has been divided between those who have been storing provisions, and one that has even ignored the basic rules, for example by organizing home parties in the affected areas.
The government hopes that the new measures will help curb these instincts 7. Despite all of this, the number of confirmed COVID-19 cases still rising, this means that something is wrong. One possible reason is the lack of respect for the national quarantine and the underestimate of the contagiousness of the SARS-CoV-2.
During the first phase of the COVID19 epidemic, by improving the media reporting response rate to the severity of COVID-19 and by improving the response rate of public awareness of media reports, both can bring forward peak time and reduce peak size of infection significantly.
These results suggest that in addition to improving medical standards, media coverage can be seen as an effective means of mitigating the spread of the disease at the initial stage of an epidemic 9. Therefore, we incorporate in our model the effects of media reporting and awareness programs to reduce the susceptible population.
All these efforts made by the authorities to aware people of the danger and rapid spread of this virus, motivated us to consider two new classes of people. The first class is the aware individuals who know about the virus and the nationwide lockdown, called the Partially controlled individuals (P), because this population could not respect the national quarantine for one reason or another and could be considered as laws violator.
The second category is people who respect the national quarantine by staying at home from the start of the closure. This population is called a totally controlled population (C). Based on the classical compartmental models, we define the Susceptible (S), Infected (I), Recovered (R), and Dead (D) individuals and the rest of the classes studied here as follows:
S: Susceptible people, people at risk or not yet infected and people who have not benefited from the awareness program.
P: Partially controlled people, people who create arguments to leave their homes during the quarantine and can, therefore, be considered as people not respecting the quarantine.
C: Totally controlled people, those who do not leave their home during quarantine and can, therefore, be considered as people respect the nationwide quarantine.
I: Infected people, who are able to spread the COVID-19 to those in susceptible and partially controlled groups.
R: Recovered people from the epidemic, but may return to the susceptible class due to the loss of individual immunity in the short term.
D: The death toll from covid-19.
All these considerations lead to the following system of difference equations:
With initial conditions S0 ≥ 0, P0 ≥ 0, C0 ≥ 0, I0 ≥ 0, R0 ≥ 0 and D0 ≥ 0 and where Ni = Si +Pi +Ci +Ii +Ri is the total size of the population at the instant i. Without loss of generality, we consider the recruitment rate equal to the natural death rate due to the restricted time window of the epidemic, that is Γi = μNi, is the newborn people which considered susceptible individuals, μ is the natural death rate.
After one unit of time, susceptible individuals may remain in the susceptible
compartment, or become infected with a contact with infectious individuals (
Partially controlled individuals may stay in P compartment or
get infected with a reduced probability with a contact with infectious people (
Where “c” modeling the reduced chances of a partially controlled individual to be infected where 0 ≤ c ≤ 1.
The totally controlled individuals never leave their compartment until they die.
The infected individuals may stay in the infected compartment or get recovered at per capita γIi or treated at per capita ƬIi and move to the recovered compartment, or die due to the infection at a per capita αIi and move to the dead compartment, or die naturally.
The recovered individuals may remain in its compartment or lose the immunity and move to the susceptible compartment at a per capita ρRi, or die. Where Ƭ is the treatment rate, α is the infection death rate, γ is the recovery rate and ρ is the losing removal individuals’ immunity rate.
We note that the population size Ni is not constant in time i, in fact
Hence the population decreases until the end of the epidemic. A summary of the description and values of the parameters is given in Table 1.
Table 1 Parameters description and values, initial data are corresponding to the 19 March 2020 for Morocco and January 31 for Italy 10.
| Parameter | Description | Estimated values for Morocco | Estimated values for Italy |
|---|---|---|---|
| Γi | The recruitment rate | μNi | μNi |
| β | The infection rate | 0.400000000163557 | 0.588699489613117 |
| c | The reduced chances of a partially controlled individual to be infected | 0.741241139596395 | 0.250892755438833 |
| θ1 | The recruitment rate of susceptibles to the partially controlled class | 0.0551738035422604 | 0.0200000000000233 |
| θ2 | The recruitment rate of susceptibles to the totally controlled class | 0.118144493564252 | 0.0300000000000233 |
| μ | Natural death rate | 0.00239997152652586 | 1.94812917550124×10⁻¹² |
| α | Death due to the infection | 0.011000000000024 | 0.012174533433782 |
| 𝒯 | Treatment rate | 0.00201633557279791 | 0.00459926081689683 |
| γ | Recovery rate | 0.0106341154978583 | 0.0114981237192988 |
| ρ | Immunity loss rate | 2.43785373724565×10⁻¹⁴ | 1.98628130425312×10⁻⁷ |
| S0 | Initial susceptible population | 34500000 | 60480000 |
| P0 | Initial partially controlled population | 0 | 0 |
| C0 | Initial totally controlled population | 0 | 0 |
| I0 | Initial infected population | 63 | 2 |
| R0 | Initial recovered population | 2 | 0 |
| D0 | Initial dead population | 2 | 0 |
Estimation of the parameters
In response to the current public health emergency, the CSSE Center for Systems Science and Engineering at Johns Hopkins University has developed and hosted an interactive web dashboard to view and follow up on reported cases in real-time 11.
The dashboard was first released on January 22 and shows the location and number of confirmed COVID-19 cases, deaths, and recoveries for all affected countries. It was developed to provide researchers, public health authorities and the general public with an easy-to-use tool for tracking disease outbreaks when they occur. Besides, all the data collected and displayed is provided free of charge in the GitHub repository 10.
Every 15 minutes, the cumulative number of DXY (An online platform run by members of the Chinese medical community, 12) cases is updated for all provinces in China and the affected countries and regions. Case numbers are updated manually throughout the day for countries and regions outside of China (including Hong Kong, Macao, and Taiwan) and when new cases are identified. Before manually updating the dash-board, case numbers are confirmed using regional and local health services, the China Disease Control Center (CCDC) 13, Hong Kong Department of Health 14, Macau Government 15, Taiwan CDC 16, European CDC (ECDC) 17, the World Health Organization (WHO) 4, as well as city and state-level health authorities.
Our study focuses on the February and March period concerning the real data for Italy, and on the March period concerning the Moroccan data. This is due to the rapid response of the Moroccan government by applying the nationwide quarantine after only 63 cases and 2 deaths on March 20 compared to Italy, which announced the closure of the country after 6,387 cases and 366 deaths on March 9.
To verify the reality of that model, we use nonlinear least-squares regression to fit the model to actual observations. Therefore, the following process has been followed for parameters estimation:
With MATLAB, the system of difference equations is solved numerically, the initial values being chosen for the parameters and the case variables of Table 1. The results of the model are compared with field data and the Levenberg-Marquardt optimization algorithm defines a new set of parameter values with the results of the model better suited to field data.
After determining the values of the new parameters with this optimizer, the system of difference equations is solved numerically using the value of these new parameters and the results of the model are again compared with field data. This iteration process continues between the updating of the parameters and the numerical solutions of a system of difference equations using iterative diagrams until the criteria for convergence of the parameters are fulfilled. In this process of estimating the parameters, around one thousand values, are chosen using a random process for each of the parameters to be estimated.
In Figure 1 we can see that our model fits correctly the real data of Morocco, especially the data of infected cases, see the sub-figure (a). In (b), we can see the estimation of the R function where it can be seen that there are some errors plotted with the filled area, while in (c) we can see the estimation of the D function with some errors between a range plotted with the filled area. To provide a prediction based on the estimated parameters given in Table 1 we simulate our model from the beginning of the quarantine on 19 March to 07 May, see Figure 2. This figure depicts the continuous increase of the three functions I, R and D, albeit at a weak form they wouldn’t stop.
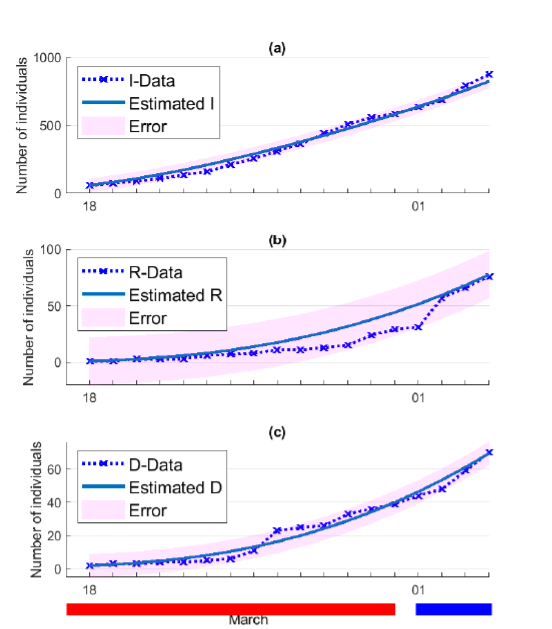
Figure 1 Data fitting for the data from March 18 to April 04, 2020 of Morocco. The markers represent (a) the active number of confirmed cases, (b) the number of recovereds, (c) the number of deaths. The solid curves are the best fitting curves of model (1) to these data.
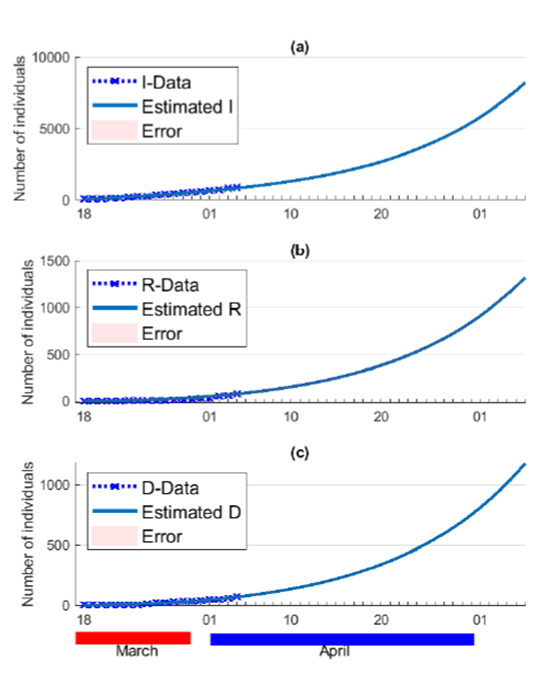
Figure 2 Estimating the situation of COVID-19 in Morocco by April and the first week of May 2020. The markers represent (a) the active number of confirmed cases, (b) the number of recovereds, (c) the number of deaths. The solid curves are the best fitting curves of model (1) to these data.
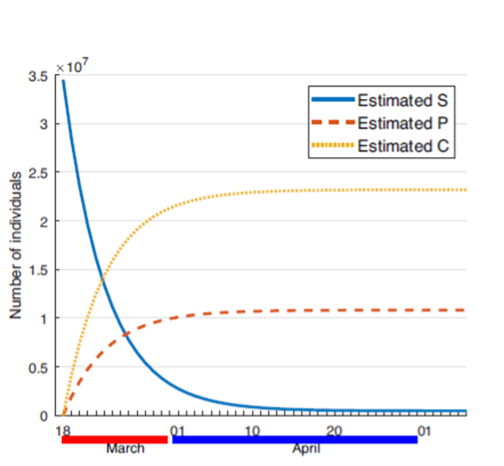
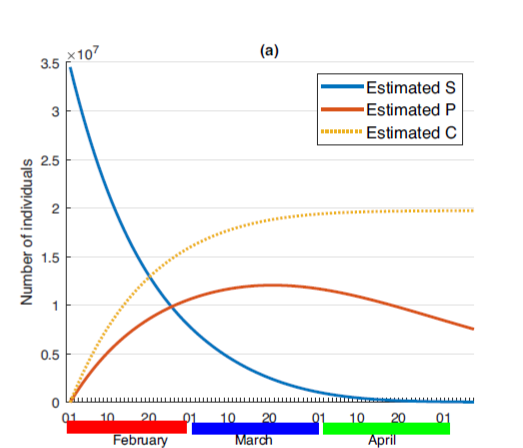
Figure 3 depicts the estimation of the controlled population, where it can be seen that after about 10 days all the population is considered controlled where the susceptible population takes about zero values at the end of April, and the partially controlled and the totally controlled population rise towards about 15 million and 20 million respectively. That figure shows the efficiency of the awareness control in reaching all the population, but it can be seen that this control is not sufficient to bring the situation under control. The Moroccan authorities must apply more serious movements restriction to reduce the number of partially controlled population which represents the high-risk population.
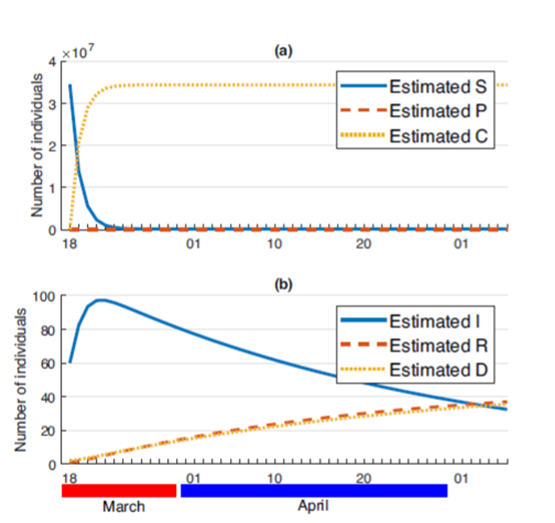
To show the impact of this population on the control of the COVID-19 in Morocco, we consider a scenario when all the population respects the quarantine which means that there is no partially controlled population, that is θ1= 0. We can see from Figure 4 that from the beginning of the quarantine, the number of infected cases starts to decrease continuously, while the number of dead people would not exceed 40 individuals. But this scenario is more theoretical than real, since the total lockdown is more costly and can lead to serious economical damages.
This simulation shows that it is necessary to think about controlling this population to achieve more satisfactory results. To investigate a more realistic scenario we consider in the following section an optimal control approach that aims to stop the infection process with an optimal cost.
In Figure 5 we can see that our model also fits correctly the real data of Italy from January 31 to March 30, especially the data of infected cases, see the sub-figure (a). In (b), we can see the estimation of the R function where it can be seen that there are some errors between a range of ±875 individuals, while in (c) we can see the estimation of the D function with some errors between a range of ±725.
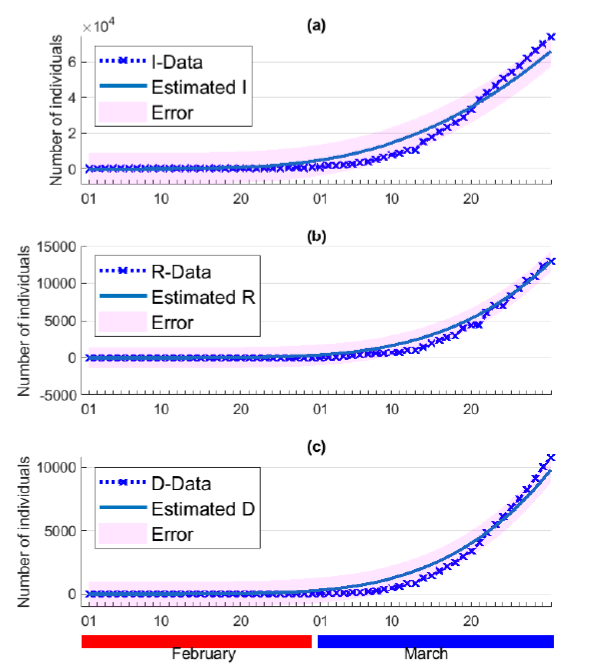
Figure 5 Data fitting for the data from February first to March 31, 2020 of Italy. The markers represent (a) the active number of confirmed cases, (b) the number of recovereds, (c) the number of deaths. The solid curves are the best fitting curves of model (1) to these data.
To provide a prediction based on the estimated parameters given in Table 1 we simulate our model from January 31 to May 07, see Figure 6.
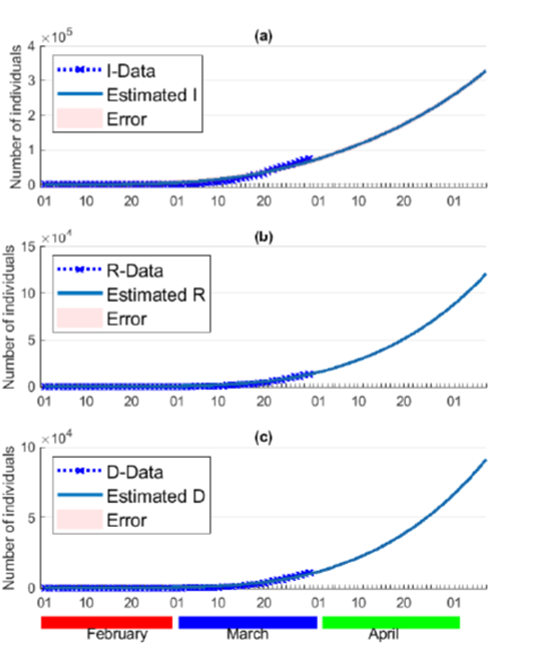
Figure 6 Estimating the situation of COVID-19 in Italy from February to the first week of May 2020. The markers represent (a) the active number of confirmed cases, (b) the number of recovereds, (c) the number of deaths. The solid curves are the best fitting curves of model (1) to these data.
This figure depicts the continuous increase of the three functions I, R and D, which would reach huge numbers by the end of April.
Figure 7 depicts the estimation of the controlled populations, where it can be seen that the susceptible population decreases which show the effect of the awareness programs on increasing the number of controlled individuals. While the number of partially and totally controlled individuals increases slightly, which can be interpreted by the non-serious behavior of people regarding the spread of this pandemic.
This explains the high number of infections in Italy and the insufficiency of the control strategy pursued by the Italian authorities so far. In the following section, we will discuss the strategy of control that should have been applied in Italy to avoid this huge number of deaths and infections.
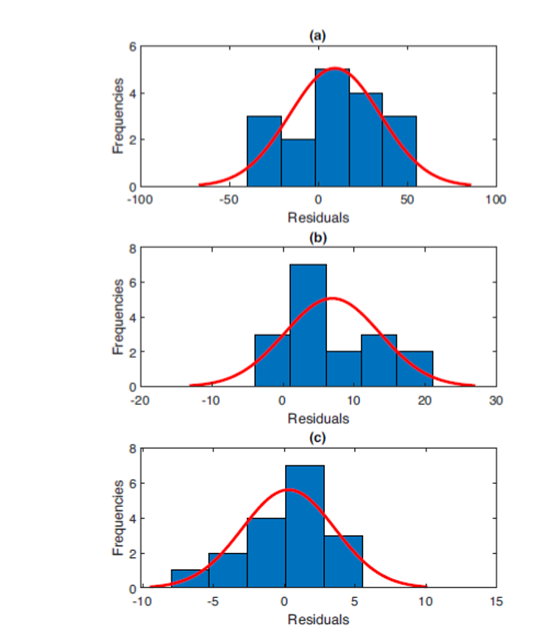
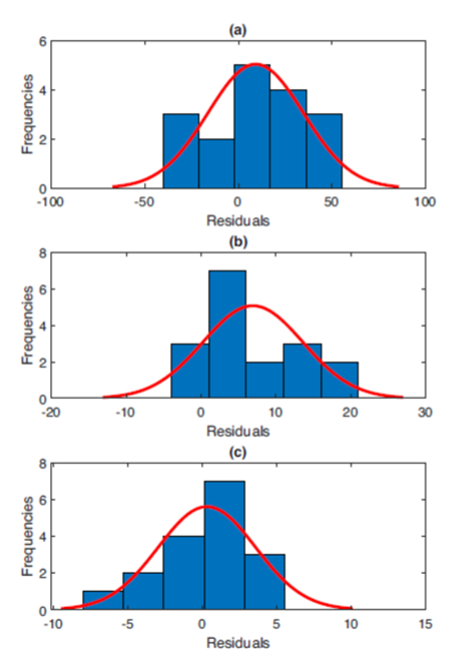
Because the residuals need to be determined numerically, we examine the accuracy of the normality of the estimation of the parameters. In order to carry out this examination, we generate the residuals of the infected, removed and dead populations for Morocco and Italy.
Figure 8 displays the corresponding histograms of Ik -Ikdata in (a) and Rk - Rkdata in (b) and Dk - Dkdata in (c) for the estimation of the parameters for Morocco with their corresponding normal distributions. While Figure 9 depicts the corresponding histograms of Ik - Ik data in (a) and Rk - Rkdata in (b) and Dk - Dkdata in (c) for the estimation of the parameters for Italy with their corresponding normal distributions. These figures show that the estimated parameters are reliable and predict correctly the observed data, especially the number of infections.
The objective of this part of the article is not to predict what will happen in the coming months but to validate the proposed model by fitting the model’s outputs to real data, then to estimate the high-risk population in these countries during the period used to estimate the parameters. Therefore, contribute to the control of this pandemic by suggesting an optimal control strategy to make the national closure more effective in reducing new infections and saving more lives. Knowing that these countries could use additional controls such as new treatment, massive tests, the obligation of masks, or more restrictions of movement, after the period of estimation of the parameters, which would make the predictions of our model exaggerated.
An optimal control approach
Authorities provide all necessary assistance to residents to stay at home during the quarantine period. By spending financial values on poor families and by dispensing certain useless occupations in the course of this period. Consequently, people who break quarantine can be considered as violating the laws, as they will take the maximum penalties, which reach the prison.
In this section, we introduce in the model a control variable that represents the previous severe reactions of the authorities against people who do not respect the national quarantine, denoted by ui. Thus, the controlled model is given by
With initial conditions S0 ≥ 0, P0 ≥ 0, C0 ≥ 0, I0 ≥ 0, R0 ≥ 0 and D0 ≥ 0. The main objective of all the countries affected by COVID-19 is to reduce as much as possible the infected and partially controlled people while reducing the costs of control u, which can be translated mathematically to the seek of an optimal control u* such that:
where 𝒥 is the functional defined by:
and where the admissible control set u is defined by:
K1, K2 and K 3 represent constant severity weights associated with functions I, P, and , respectively.
Existence of the optimal control
Theorem. There exists an optimal control u* ∈ U such that
subject to the control system (3) and initial conditions.
Proof. Since the parameters of the system are bounded and there are a finite number of time steps, that is S, P, C, I, R and D are uniformly bounded for all uin the control set u, thus J(u) is also bounded for all u ∈ U. Which implies that inf u∈U J(u) is finite, and there exists a sequence un ∈ U such that
and corresponding sequences of states, Sn, Pn, Cn, In, Rn and Dn.
Since there is a finite number of uniformly bounded sequences, there exists u* ∈ U and S*, P*, C*, I*, R* and D* such that, on a sequence,
Finally, due to the finite dimensional structure of the system (2) and the objective function J(u), u* is an optimal control with corresponding states S*, P*, C*, I*, R* and D*. Which complete the proof.
Characterization of the optimal control
By using a discrete version of the Pontryagin’s maximum principle 18,19,20,21,22, we derive necessary conditions for our optimal control problem. For this purpose, we define the Hamiltonian as:
Theorem. Given an optimal control * and solutions S*, P*, C*, I*, R* and D*, there exists ζk,i, i = 0... T - 1, k = 1,2,...,6, the adjoint variables satisfying the following equations:
where ζ1,T = ζ3,T = ζ5,T = ζ6,T = 0, ζ2,T = K2, ζ4,T = K1 are the transversality conditions. In addition
Proof. Using the discrete version of the Pontryagin’s maximum principle 18,19, we obtain the following adjoint equations:
With ζ1,T = ζ3,T = ζ5,T = ζ6,T = 0, ζ2,T = K2,ζ4,T = K1.
To obtain the optimality conditions we take the variation with respect to controls (ui and vi) and set it equal to zero
Then we obtain the optimal control
By the bounds in u of the control in the definitions (6), it is
easy to obtain
Results and discussion
Numerical simulation
Here, we provide the numerical simulations related to the optimization problem mentioned above. We write the code in MATLABTM and simulate our results using different data from Table 1. The optimality systems are solved based on an iterative discrete method which converges after an appropriate test similar to that for FBSM. The state system is resolved with the initial assumption forward in time, then the adjoint system is solved backward in time due to the transversality conditions. Next, we update the optimal control values using the state and co-state values obtained in the previous steps. Finally, we implement the previous steps until the tolerance standard is reached.
To demonstrate the efficiency of the optimal strategy of control that we propose, and to give a comparison with the case when there is no optimal control, we choose to simulate the controlled model in the months of February, March, and April in the case of Italy, and in the months of March and April in the case of Morocco.
Our model correctly corresponds to the Italian data (see Figure 5) and predicts that the number of COVID-19 cases will continue to increase if the Italian authorities do not take other measures such as the appearance of a new treatment, see Figure 6. While in Figure 10 we can see that the number of infections reaches the peak by about 9000 infected individuals on April first, and then starts to decrease. And the number of deaths does not exceed 6000 (see the sub-figure (b)) by the end of April. By following these strategies of control, the partially controlled population remains almost null, see the sub-figure (a), which gives the healthcare authorities the necessary time to save more lives. From the sub-figure (c) we can see that by May first, there is no more need for this control, where the function u takes null values since that time.
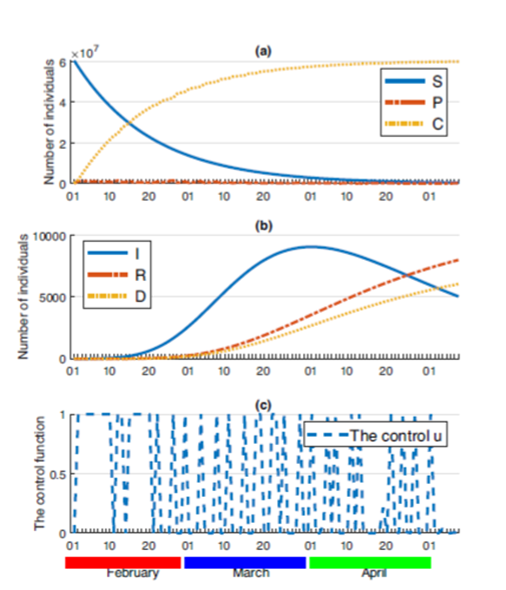
Figure 10 The controlled model (2) simulated with the parameters of Italy. (a) The three functions of susceptible S, partially controlled P, and totally controlled C population. (b) The three functions of infected I, recovered R, and dead D population. (c) The control function.
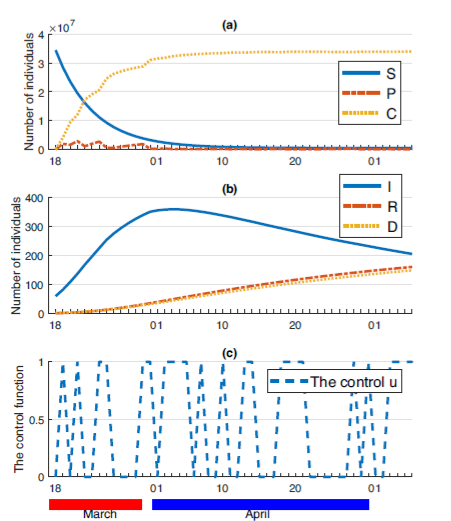
Figure 11 depicts the efficiency of the control u in reducing the number of partially controlled individuals, and increasing the number of totally controlled people (a) in Morocco, and then reducing the number of new cases of infection, and the number of deaths (b), which would not exceed 150 by 07 of May, while this number exceeds 1000 dead individuals at the beginning of May, in the case when there is no control u, see (c) of Figure 2. While it can be seen, from the sub-figure (c) of Figure 11, that the control function u takes discrete values separated by null values, while we can see that this control is needed until the end of this simulation. To achieve this satisfactory results, the control starts from the beginning of the closure to inverse the direction of the course of events, while the number of the partially controlled people rise to about 11 million individuals and stabilize there until the end of April, when the control u is not applied yet, see Figure 3. But, when the optimal control u is applied, the number of the partially controlled people starts decreasing towards zero to take almost null values by about April first, see (a) of the Figure 11.
Discussion
In recent work, Zhou et al. in 9 studied the effects of media reports on mitigating the spread of COVID-19 in the early stage of an outbreak, where the authors discussed a mathematical model that provided a detailed scheme in the early stage of the COVID-19 outbreak, and included the ODE model. Their findings indicate that, in addition to improving medical standards, media coverage can be considered an effective way to mitigate the spread of the disease in the first stage of the epidemic. Based on this fact, we incorporate in our model the effect of media reporting and the awareness programs to reduce the number of susceptible population (the parameter θ = θ 1+θ 2), but our principal aim is to estimate the high-risk population in countries under quarantine (lockdown) not in the early phase of the propagation of the pandemic compared to the model proposed in 9, and then to contribute in the control of this disease.
Other work presented in 23 assesses different scenarios, based on an estimate of the number of identified and unidentified cases, and studies the effectiveness of different policy responses to contain the epidemic in Iran. The authors have shown that in many cases the number of unidentified cases, including asymptomatic individuals, can be much higher than the reported numbers, and the control strategy they suggest is to combine effective social spacing to extensive testing, even for those without symptoms and isolate active cases. This control strategy can work in Italy; however, it is not applicable in developing countries like Morocco due to the limited medical protection equipment, fragile health resources and infrastructures which do not allow a number of enough daily tests. Whereas, in our control strategy, we suggest only optimal self-isolation to make the state of emergency more efficient and this shows satisfactory results in Italy and Morocco regardless of medical resources.
Tian et al. in 24, adopted the interrupted time series method and developed the SEI / QR model for analyzing data from Anhui in China, which is divided into three phases. During the first phase, general awareness of the severity of the disease was low and infections might be treated like the common cold. In the second phase, the public began to realize the severity of the epidemic after the closure of Wuhan and the closure in other cities in Hubei soon after. In the third stage, central quarantine management measures were adopted for close communication in Anhui and resulted in a decrease in the possibilities of communication between residents. The authors concluded that the closure of Wuhan and the timely central quarantine procedures in Anhui had significantly reduced the speed of transmission of COVID-19. This work focuses on the different stages of the detection of epidemics in China, but the virus and the disease of SARS-CoV-2 (COVID-19) were identified before the declaration of the first cases in Italy and Morocco, which makes the analysis of 24 not applicable in these countries.
All the above-mentioned models are continuous, but the model we propose here is in discrete-time. One of the reasons for the rise of discrete time models is that these models have advantages for describing infectious diseases, since epidemic data are generally collected in separate time units, which would make them easier to use and ease with which data can be compared to simulated results.
To avoid what are the things going to in other countries, the optimal and efficient way to bring the situation under control is the optimal control strategy we propose here. It can be seen that in this strategy of control, there is no need for more medical care or medical equipment. The Moroccan authorities need to use restraining measures, stipulated in the decree by law, to deter violators, who underestimate the lives and safety of citizens, and put them at risk.
The absence of anti-COVID-19 treatment and an effective vaccine against COVID-19, and limited medical resources are all factors that make it more difficult to stem the transmission of this pandemic. Therefore, it is necessary to consider other means of interventions. Travel restrictions have been implemented in most countries of the world, effectively reducing the movement of millions, quarantine, and health emergencies require people to stay indoors during the COVID-19 outbreak to reduce contact with others, which already contributes to the prevention and control of the disease, with all these strategies of control, the new infection cases still recorded in Italy and Morocco which give us the opportunity to contribute in the containment of this dangerous pandemic by proposing the optimal strategy of control that appears to be more efficient by bringing forward the peak and reducing the size of the infection peak in both countries under investigation.
Many countries have taken advantage of the experience of China and Italy in fighting this pandemic. This saved him time to try to contain the severe spread of the COVID-19 infection. And learned them that this spare time must be used efficiently and effectively. Morocco is one of these countries, where the emergency home education plan was meticulously implemented 25. Schools and teachers make tremendous efforts at all levels to create and deliver online courses via TV and Internet broadcasts in record time. The new virtual semester has just begun across the country, and various online courses are offered in a good manner 26. These measures help alleviate the concerns of many parents about the educational attainment of their children by ensuring that school learning is not greatly interrupted and then help people to stay at home. Financial aid for poor families and for hanging crafts. Imposing early quarantine. Some posts went so far as to say that Morocco preferred its people over its economy.
Despite all of this, we can see that overcoming this pandemic will not be an easy task. When interpreting our results, however, several limitations must be considered. Thus, although this is the first study to use a mathematical model to estimate high-risk populations in countries subject to emergencies and quarantine in general and in Italy and Morocco in particular, there are potential limitations with regard to the degree of risk of COVID-19. Where, the degree of risk of developing COVID-19 depends mainly on age, male gender and the presence of comorbidities (obesity, diabetes, heart disease, lung disease and kidney disease) 27, and therefore other results may be assessing the development of COVID-19 in these people. However, we have estimated the prevalence of COVID-19 in these countries regardless of age, gender and complications. In addition, errors in data collection cause the model to reduce or potentially overestimate future propagation projections. Another limitation is that the authorities frequently change their control strategy by adding some additional controls such as masks commitment, more restrictions on movement ... all of which can lead to massive errors in our prediction, however, our optimal control strategy is still more efficiency even if there are different numbers of the population, and this is verified in this paper by analyzing data of two countries with different initial states.
Conclusion
In this paper, we have presented a new mathematical model describing the evolution of the COVID-19 in countries under the nationwide lockdown. In which we have considered two new classes of people. Those who underestimate the quarantine and then left their home for their reasons, we called them the partially controlled people and those who respect the national quarantine by staying at home we called them the totally controlled people. First, we estimated the amount of these populations in Italy and Morocco, by applying a nonlinear least squares method on real data collected and published by the John Hopkins University. In Italy, we found that the number of the partially and totally controlled individuals rose slowly compared to the case of Morocco, this shows the rapid response to quarantine and the efficiency of awareness programs in Morocco. In order to contribute to the control of the COVID-19 in Morocco and Italy and other countries, we have investigated an optimal control problem that aims to reduce the number of partially controlled and infected people with minimal costs. Where this strategy of control we present here adopts the no-medicine control which can be used in all developing countries. We simulated what would have been happened in Italy and Morocco if this strategy of control was applied early. We have provided several simulations through-out the paper to illustrate the efficiency of each part of the manuscript.

