


 nueva página del texto (beta)
 Inglés (pdf)
 Artículo en XML
 Referencias del artículo
 Enviar artículo por email
 Citado por SciELO
  Similares en
SciELO
Similares en
SciELO 
 Permalink
Dear Editor,
The use of saliva in the diagnosis of COVID-19 using the Reverse Transcription Polymerase Chain Reaction (RT-PCR) technique has been implemented largely because it is a minimally invasive technique despite the approximate percentage of accuracy that it allows obtaining (72%) 1,2. The Fourier transform infrared spectroscopy (FTIR) is a technique that allows analyzing the molecular structure of a sample through a signal or FTIR spectrum produced by the vibrations of the chemical bonds that make up said sample when impacted by frequencies belonging to infrared radiation 3. By producing molecular changes 4,5, viral infections are potentially identifiable by FTIR spectroscopy, so this technique can be advantageous to perform examinations in a more agile way than RT-PCR (72 hours on average) 6 since the spectrum capture takes approximately 15 minutes including the drying time of the sample. Conducting timely tests to identify and isolate infected people is the most efficient methodology as there is no treatment or vaccine against the virus.
Through different regions of the FTIR spectrum, it has been possible to detect characteristic changes of different types of cancer, Parkinson’s disease, and diabetes, among other diseases 7,8,9, however, related to viral infections, Supti R, et al., and Eyal A, et al. 10,11, indicate that viral infections mainly affect the protein region, specifically the region attributed to amide I (1700-1600 cm-1). Spectral changes are reflected by the growth or decrease in a region of the FTIR spectrum, so transforming the spectrum, Figure 1a, through the use of derivatives, Figure 1b, helps to highlight such changes as in the work of Supti R, et al. 10.
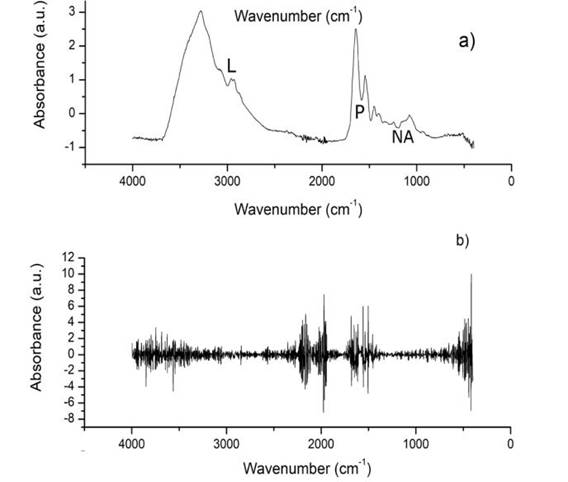
Figure 1 a) Main macromolecules of the saliva spectrum, L: Lipids (3000-2800 cm-1), P: Proteins (Amide I and Amida II, 1700-1600 and 1560-1500 cm-1), and NA: Nucleic acids (1250-1000 cm-1). b) Approximation to the second derivative of the spectrum.
Despite the advantages above, it is necessary to consider the following challenges presented by saliva analysis using FTIR spectroscopy: excess water, mixing of bonds of different components, and variations in absorbance/transmittance levels. Because saliva is made up of approximately 99% water 12, the amount of H-O-H bonds makes it difficult to appreciate the structure presented in Figure 1a., to solve this problem, it is necessary to submit the saliva sample to a drying process. Related bond mixing, the problem is that the more complex the sample composition is (proteins, organic molecules, and electrolytes for saliva 13), the more complicated the spectrum becomes, making it difficult to associate a peak with a specific molecule. The above mentioned avoids the reliable identification of the molecule or molecules affected by a specific disease. Despite this, each component's number of bonds varies considerably depending on the macromolecular group to which they belong, which allows a specific region of the spectrum to be attributable reliably to a macromolecular group such as those indicated in Figure 1a. In studies such as those of H. Lin, the variability in absorbance/transmittance levels associated with age will have repercussions at the height of the spectrum (absorbance/transmittance) 14, so a change in this factor is not necessarily an indicator of the disease. The differences in absorbances in spectra even of the same population, together with the overlap of the sample bonds, make it difficult to select a region with an exclusive pathology behavior.
In this sense, the machine learning area could present an interesting option to support preliminary clinical detection through FTIR spectrum. In works such as that of Alexandra S, et al. 15, it has provided an over-view of the most promising techniques to be used, highlighting the use of artificial neural networks (ANN) compared to support vector machines (SVM) and techniques based on distances such as K-nearest neighbors, allowing to reach percentages of 100% in specificity for breast cancer detection, so it turns out to be the most promising technique. The main advantages of ANN and SVM are that they are non-linear techniques for the characterization of signals, while in ANN, non-linearity is achieved through the implementation of an activation function for its neurons, in SVM it is achieved through a transformation of the signal to a higher dimension using the technique called kernel trick. In a dimension equal to or greater than R3, the characterization of the signals using a hyperplane is less complex than in R2, allowing an accuracy of 100% in some cases, as presented by Alexandra S, et al. 15.

