


 nueva página del texto (beta)
 Inglés (pdf)
 Artículo en XML
 Referencias del artículo
 Enviar artículo por email
 Citado por SciELO
  Similares en
SciELO
Similares en
SciELO 
 Permalink
Introduction
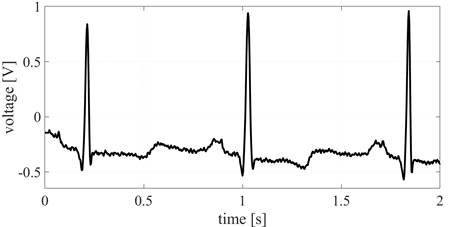
Heart Rate Variability (HRV) is currently the most common digital application of analysis of the ECG signal trace. It refers to a precise time measurement (usually in the order of milliseconds) of the intervals between each heartbeat, represented in Figure 1, labeled as R-R interval [1].

Figure 1 A pair of heartbeat cycles as observed by the electrocardiograph, indicating the major 4 points of reference in electrocardiographic analysis: the T and P waves, as well as the QRS complex. The period between two R-peaks is also represented in the picture and is of great importance for HRV acquisition [6].
The object of interest when analyzing variations in heart rate is autonomic nervous system (ANS), which is a division of the peripheral nervous system that acts in the regulation of bodily functions such as heart rate, respiratory rate and digestion [2].
It is largely regarded as the primary control mechanism of the fight-or-flight reaction (or hyper-arousal) [3].
In the past few decades, researchers have discovered correlation of the HRV analysis with many different health related issues, ranging from the autonomic function of insulin-dependent diabetic patients [4] to the aftereffects of myocardial infarction [5].
The most usual method of extracting HRV data is the detection of R-wave peaks in an ECG trace plot. Therefore, when dealing with acquired signals, the HRV can be compromised by the occurrence of artifacts originated by electrode motion, respiration motion (baseline wander) or even irradiated electromagnetic noise [7]. Considering that the relevant information to the HRV analysis is the reliable detection of the R peak, the design of filtering methods for this purpose is slightly different from the popular methods used for ECG filtering [8].
The signal to noise ratio (SNR) is a dimensionless ratio comparing the signal and noise power in a given channel [9].
This ratio is described in Equation 1 in its most usual form, where P 𝑠 stands for the power of the signal being analyzed and
The electrical engineering academic consensus is that 3dB in signal-to-noise ratio is the minimum value for the system to be considered acceptable in terms of the fidelity of signal output [11], This threshold was obtained using Equation 1.
The Wavelet Transform is represented in its most general form in Equation 2 for a given function f(x), having 𝜓 as a continuous function for the mother Wavelet, accepting two parameters: a for scaling and b as the translational value. It can be used as a denoising method and is especially useful dealing with sharp transients in the signal.
Different methods using Wavelet have been developed over the years. Wavelet Shrinkage provides a great filter with low computational power [12]. Some other well-known Wavelets denoising methods are known as Bayes, BlockJS, Minimax, SURE and Universal Threshold [13], all of which have been gaining on popularity since being incorporated into programming libraries on different platforms such as MATLAB and Python.
This paper proposes to analyze the process of extracting the HRV from a progressively noisier ECG channel in order to find out what is the minimum SNR with which SURE Wavelet denoising is still sufficient. The aim is to determine the limitation of this method of filtering specifically for HRV analysis.
Materials and methods
The ECG signal used for the HRV analysis was obtained from the MIT-BIH Arrhythmia ECG database [14]. This database was selected due to the long monitoring duration of each single patient (6-hour periods) available, enabling the collection of a sizeable sample of R-R intervals. From the records available, a 30-minute ECG record from a healthy patient (i.e. without observed arrhythmias) was chosen.
A short sample of the signal used is represented in Figure 2. It is important to consider that this signal has not yet went through the R-R identifying algorithm.
Application of filtering methods and general signal preprocessing were made through the software Mathworks MATLAB 2016b with the custom library BioSigKit V1.0 [16] which was used for the extraction of the R-peaks through the Pan-Tompkins algorithm.
Signal was sampled at 360 Hz and filtered with the SURE Wavelet Transform as a denoising method with 5 levels of decomposition. This particular method of denoising was chosen because of its availability in most Wavelet toolboxes, its low demand in processing power and its good performance for biophysiological signal processing (especially for ECG and EEG applications) [17].
The R-peak detection algorithm (specifically the Pan-Tompkins implementation [16]) is implemented onto the signal represented in Figure 3 after it is filtered.

Figure 3 The same portion of the database represented in Figure 2 after the implementation of the Pan-Tompkins algorithm. Location of the R-peaks are marked with a red dot.
Points marked with red in Figure 3 were used to create the HRV vector. The process is a simple subtraction between the time values associated with two consecutive R-peak points, repeating the process all along the record.
This is done once in order to obtain the real mean HRV (which consists of an arithmetic mean of all of the R-R values contained in the HRV vector) observed in the original 30-minute ECG record. The ECG signal is then summed with a matrix with random noise, this process is repeated in order to generate an ECG matrix with escalating noise level (each time noise power is incremented by 0.1).
Every newly generated noisy signal then undergoes the same SURE Wavelet method of denoising presented before, which in turns created the final matrix. From this final matrix, HRV is then extracted, also it is labeled with its SNR level using Equation 1 which will reflect the white noise added to it. This whole process is repeated 21 times, creating the matrixes in different noise-levels that will be needed for the analysis.
A possible way to represent HRV extracted from the progressively nosier channel is utilizing a Poincaré plot [18]. Which is a recursive plot since its axis represent a current measurement (called RR(n)) and a future measurement (RR(n+1)) repeated for many instances [18]. In a completely stable phenomenon, all points of the plot should be grouped together as tight as possible. When the subject is the human heart, that doesn’t always happen for different reasons.
If the Poincaré in Figure 4 were data gathered from one subjects heart-rate variability, points observed in the extremities of the plot could either be the representation of some kind of intermittent cardiac function abnormality or the malfunctioning of the R-peak detection algorithm induced by noise in the signal.

The correlation between mean HRV and the SNR observed in the ECG channel (after the noise adding and SURE Wavelet denoising process described) reveals the point in the curve where the level of noise is not compatible with the HRV extraction (i.e. the point where the values being extracted are not representative of the signals coming from the patient’s body, but are mostly caused by the noisy ECG).
Results and discussion
The chosen portion of the signal is filtered through the SURE Wavelet denoising tool and a small part of is represented in Figure 5.
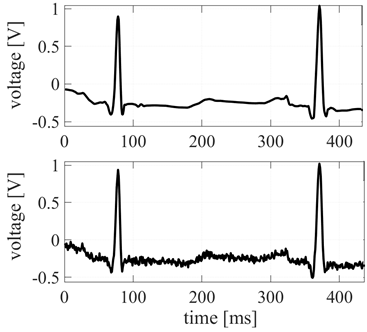
Figure 5 Below: Regular electrocardiographic signal (as extracted from the database). Above: the same portion of the signal filtered with the SURE Wavelet denoising method for 5 levels of decomposition.
The Pan-Tompkins R-peak detection algorithm shown in Figure 3 is implemented on the filtered signal in order to extract the locations of every R-peak detected throughout the recording.
A Poincaré plot is used to represent the extracted HRV distribution in Figure 6. It useful here because it makes possible the visual analysis of increasing noise. As expected from a filtered low-noise channel, the higher density of points in the center of the plot is visually recognizable.
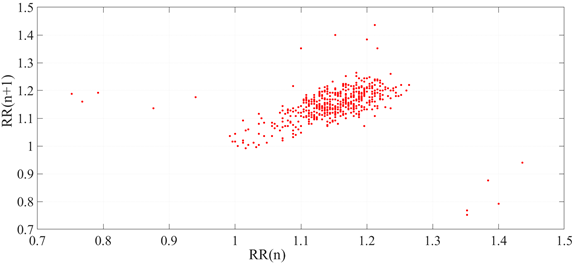
Figure 6 HRV Poincaré plot extracted from electrocardiographic signal from the database before random noise is added, filtered through SURE Wavelet.
Such artifacts are expected as HRV analysis usually focuses more on the total distribution of the plot and less on the outlier points [19].
White noise is added to the original database electrocardiographic signal and is then filtered with the aforementioned Wavelet method. This process is repeated 21 times, increasing the white noise power linearly in each iteration by a factor of 0.1.
The R-peak detection and HRV analysis are repeated for each iteration, calculating the mean HRV value for each new noise-contaminated ECG signals.
All of the signals are shown in Table 1. The first one, of infinite SNR, represents the original signal, without white noise being added to it. The subsequent signals represent every increase in white-noise power added to the original signal.
Table 1 Simulated SNR (dB) and Mean HRV (ms) values.
| Calculated SNR (dB) | Mean HRV (ms) |
|---|---|
| ∞ | 52.385 |
| 21.949 | 52.385 |
| 21.949 | 52.385 |
| 15.923 | 52.384 |
| 12.402 | 52.385 |
| 9.909 | 52.386 |
| 7.981 | 52.385 |
| 6.385 | 52.384 |
| 5.050 | 52.384 |
| 3.894 | 66.384 |
| 2.858 | 80.867 |
| 1.940 | 80.867 |
| 1.127 | 109.131 |
| 0.366 | 179.036 |
| -0.320 | 206.385 |
| -0.970 | 274.298 |
| -1.560 | 327.727 |
| -2.113 | 283.082 |
| -2.657 | 508.656 |
| -3.166 | 504.919 |
| -3.628 | 445.768 |
| -4.061 | 627.981 |
Considering that the first measurement is made without adding noise to our channel, the correct mean HRV for the 30-minute recording is 52.385ms. Therefore, any alteration in the calculated mean HRV can be interpreted as an error introduced by the random noise added to the original ECG signal.
Calculated values are consistent with prior knowledge about SNR considerations in signal transmission quality. Alterations on the calculated mean HRV can be observed after the signal-to-noise ratio drops below 5 dB.
The effects of the noisy ECG can be observed in the Poincaré plot of the HRV as represented in Figure 6. The scattered points are more frequent and can be found further away from the centroids location.
In this case, calculated mean HRV is 274.298ms which is not a physiologically meaningful value, since it exceeds even the highest possible expected heart rate variation.
Experimental values as described in Table 1 are represented graphically in Figure 7 and a trend curve is fitted using the Smoothing Spline method.

Figure 7 HRV Poincaré plot extracted from ECG signal with SNR equal to -0.970. A high concentration of points in the extremities of the plot indicate that the channel with this noise-level may be unsuitable for HRV analysis.

The graph shows the mostly linear behavior of the HRV calculation algorithm applied to the filtered channel when SNR is higher than 5dB and the exponential behavior of the mean HRV calculation when noise component increases.
Conclusions
This paper has demonstrated the limitations of one of the more common filtering techniques applied to ECG channels for this particular HRV distribution. Results suggests that a standard Wavelet denoising method (in this case SURE method with 5 levels of decomposition) looks to be insufficient to ensure reliable HRV extraction when SNR is under that of approximately 5 Db. In order for it to be confirmed a study using many different databases has to be done in the future.
These findings could be important both to research and to industries that work on health-monitoring wearable devices, since we were able to define with precision the level of noise in which HRV reading will stop being reliable.
Future research in this area should focus on the development of a filtering method specific to HRV analysis in order to better preserve nominal values of mean HRV calculated from noisy ECG signals and of course, extend this study to include many more different databases.

