


 nueva página del texto (beta)
 Inglés (pdf)
 Artículo en XML
 Referencias del artículo
 Enviar artículo por email
 Citado por SciELO
  Similares en
SciELO
Similares en
SciELO 
 Permalink
Introduction
Exposure to pulsed light results in non-visual physiological responses in humans [1] [2] [3] [4] [5] [6] [7] [8] [9]. The present study aims to investigate whether such non-visual effects are influenced to a greater extent by the frequency of flickering or by the combination of colours of lighting, this research obeys to a previous experiment in which an intervention of Blue Pulsed LED was used as an addition to a task lamp in order to improve the state of alertness in humans when a continuous stream of pulses at 100 Hz was delivered to a conventional workspace [10]. The actual study was developed in order to find the electroencephalogram (EEG) behaviour to determine differences among flickering frequencies in order to determine which one evokes the most and apply it to a prototype desk lamp.
It is known that light influences physiologically to all species, humans among them of course. When situation is in an outdoor scenario the main source is sunlight, but nowadays in the modern world, artificial lighting is of great influence to humans on work efficiency and health [11]. There are visual effects caused by light, denoted as visual effects and non-visual or non-image-forming (NIF) effects that are also elicited.
Regarding the type of light, evidence shows that exposure to blue light delivers the strongest non-visual effect [12]; some other research indicated that blue light has an increased pupillary constriction effect [13], also blue elicits alertness [14] [15] [16] [17], improves cognitive performance [18], suppresses melatonin [19] and changes the phase of circadian rhythms [20].
Furthermore, there are reports that have revealed the greater non-visual responses evoked by intermittent pulses rather than a continuous beam of light [21] [22] [23]. In a parallel study from a joint research, the mixing of short pulses (100 μs) of blue light with a white light background, was observed an increase in pupillary constriction due to the blue light intervention although blue color was not perceived by the participants in a way that they could continue their work without feeling that the workplace surface or area was changed to a bluish tonality [10] [24]. This type of result show that blue can be added to general illumination as long as it is not perceived by human eye, the effect can be delivered without affecting perception and may allow worker to maintain a high arousal level as the one needed in Hospitals, Schools or an Office setting.
It is of a high importance to make studies like this as in certain jobs the state of alertness has to be high due to the relevancy of the decisions taken; a typical example is in the so called blue rooms in Hospitals where careful attention has to be taken into the interpretation of results. Other cases like nursing stations also in Hospitals or quality control sections in the manufacturing industry also require; needless to say to evoke alertness in students or office workers can be of a good benefit for the outcomes on their respective duties.
When talking about light, sometimes there is a misunderstanding about the use of it in regards to quantity or intensity of light. Let us remember that irradiance of light refers to the radiant flux, either power or quantity, received by a surface per unit area (in our case μW/cm2). Therefore “intensity” is the term so assigned to it (μW/cm2/sec). And, as mentioned before, if short pulses of blue light elicits alertness [14] [15] [16] [17], then, the aim of this study has a compelling compromise in to research on the non-visual effects of irradiance by a flickering light in order to verify the most suitable and less perceivable frequency for the end user.
In recent years there has been some developments in regards to provide sources of light in benefit of health; desk lamps that provide blue light for depression or seasonal affective disorder treatments, as well as circadian light programmed in the cell phones or computers to avoid eye strain; but commercially available devices that can provide alertness for shift workers or precision task functions are seldom seen, so this is actually the area we are attempting to revise and provide some knowledge to it.
Back in 2002 a novel photoreceptor was found in the mammalian retina [25], this photoreceptor, called intrinsically photosensitive retinal ganglion cells (ipRGC), was confirmed to respond to blue light (short wavelength) of around 480 nm. Then, ipRGC activity has a parallel photo response to the pupillary behaviour related to the course of amplitude and time when constriction of pupil is elicited. Green light has also been researched as an alerting effect source when applied to an ambiance light and, as in other studies the ipRGCs´ activity have been reported to be related to the effect of light on alertness and cognitive performance we measured pupillary constriction as a way to corroborate the ipRGCs activity with the alpha and beta waves presence. Assuming that if we have a remarked constriction in pupil that may confirm that the presence of alpha or beta waves is related to the presence of blue light and not to a different influential factor.
In previous study we found that the pupillary constriction under a 100 µs pulsed blue light condition was significantly greater than that under a steady blue light condition; the two conditions had equal blue light components [31] [32]. Here we conducted an experiment based on different flickering’s of light taking into account previous studies that were working with short pulses of light this in order to investigate the effect of a continuous stream of pulses on physiological responses. Selection of frequencies had to be above 100Hz to avoid any danger in the participants, duty ratio was defined following previous researches in order to define the frequency that could elicit the most alertness and not being perceivable by the naked eye [31].
Analysis on pupillary constriction, electroencephalogram (EEG), and subjective evaluation on flickering perception were done.
Expected results were placed in a more specific understanding of the non-visual effects of flickering light in different frequencies but at the same duty ratio in order to define the most suitable frequency to adapt to a task lamp designed for this type of jobs by delivering a greater state of alertness for the user and not disturbing the ambiance lighting conditions in their perception.
Methods
Subjects: 11 young males (age: 24 ± 4 years) with normal vision participated in the experiment. Each subject was exposed to different continuous stream of pulses of monochromatic BP and BGP LED light conditions; pulses at 100, 200, and 400 Hz over two background light colors (BLC) (2700 K at 30 lx and 6500 K at 30 lx) for a total of 12 conditions.
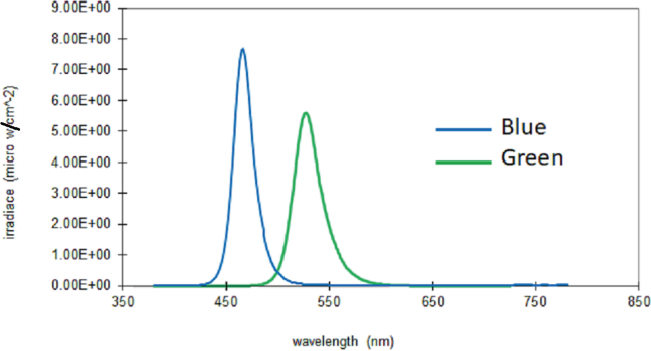
Duty ratios were the same for the different frequencies (Figure 1), and the irradiance was set to 200 μW/ cm2 for each of the LED colors and the Blue LED, and Green LED spectral power distribution (SPD) are shown in Table 1 and Figure 2 [41].
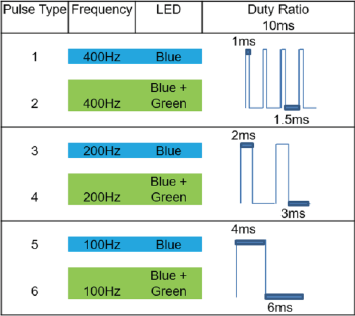
Table 1 Irradiance settings
| Light Condition |
Irradiance (µ/Wcm2) |
Photon Density (photons/cm2/S) |
Photopic Illumination (1x) |
Scotopic Illumination (1x) |
|---|---|---|---|---|
| Blue | 200.00 | 4.8x10.14 | 150 | 2235 |
| Green | 200.00 | 5.4x10.14 | 1130 | 2514 |
| Blue + Green | 400.00 | 1.0x10.14 | 1265 | 4800 |
The number of participants requested was small as per the type of experimental procedure performed which was as a continuous variable type to be measured.
When the sample definition took place, a single group of individuals has to be evaluated by a crossover type of experiment as a repeated measurements type. It is needed then to measure the effect on each individual on every treatment, as there is no control group, each person is considered his own control, and with this we can eliminate the effect of subject variation in data and eliminate the possible interindividual variability.
Age group was also selected in a close range to avoid significant differences in EEG readings as some studies demonstrate that age reduces the effect of light on brain functions [33] [34] [35].
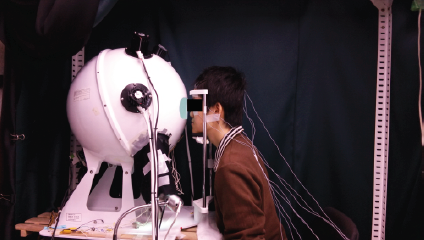
The experiment was conducted between 10:00 a.m. and 12:00 pm. In the space where measures were taken, a chair and an integrating sphere were placed along with a head and chin rest device to avoid any movement of the face while recording the pupil behaviour.
Temperature was controlled by an air conditioner unit; maintained at 21 °C with an SD of ±1.6 °C and no windows were in the room. One access door was kept closed to avoid any noise or outside light contribution; there was no activity involved in the participant’s intervention other than keep looking into the inside of the integrating sphere, hence no additional experimental noise was influencing the test (Figure 3).
The process to obtain the EEG data was performed through the use of a MP150 System, BIOPAC Systems Inc. ®. Placement of electrodes (BIOPAC Systems Inc. ®, EL254S; Silver-silver chloride,-Ag-AgCl) were located at the frontal lobe (Fz), occipital (Oz) and the central (Cz) scalp locations according to the International 10−20 system. Thus, as a non-invasive procedure; in a way that the placement of the electrodes was done by measuring the scalp and identifying the locations of placement, then, by adding conductive paste (Elefix, Z-181JE) and fixing them manually. A fourth electrode has to be placed on the earlobe as a point of reference (‘ground’) of the body’s baseline voltage due to other electrical activities (noise). Due to natural eye movements during the test, Electro-oculogram (EOG) measurements are generated, so four electrodes were also placed; this EOG’s electrodes are located one above and one below each eye over the Orbicularis oculi muscle. All electrodes impedance was kept at < 5KΩ, and revised with impedance measurement device MaP811 (Nihon sound tech MAP No. 116-032).
Selection of Occipital and Central locations in the scalp were taken as the presence of light and the primary visual cortex is most related to the Occipital lobe rather than the frontal lobe where Cognitive work in brain is normally measured [33] although, frontal lobe was also measured for countercheck. EEG data was acquired at 1 KHz, 1 second epochs were taken but full raw data was considered as the base measure; EOG’s artefacts were removed by bypass filtering the channels (BIOPAC Systems Inc. ®, Acknowledge software V4.1). Then, data was processed by Fast Fourier Transform function (FFT) and data is band pass filtered at 4-8 Hz for Theta waves, 8-13 Hz for Alpha, 13-30 Hz for Beta and 31-45 Hz for Gamma waves; were the ranges used for posterior analysis in frequencies of brain responses.
The BP-LED flickering rate was generated using a pulse width modulation signal delivered by a programmable board (mbed®, NXP LPC1768, LPCXpresso BOARD, ARM Corp. LTD.), and then verified using an oscilloscope (TEKTRONIX®, TPS 2024B). The pulse rate was maintained at 100 Hz in which 1 ms for ‘on’ state and 1.5 ms for ‘off’ state. At 200 Hz the rate was 2 ms for ‘on’ state and 3 ms for ‘off’ state; and at 400 Hz the rate which was 4 ms for ‘on’ state and 6 ms for ‘off’ state (Figure 1). The type of LED used in the flickering lamps were of the type high power blue LED and green LED (16 W 24-AB2S, KASHINOKI SOGYO CO., LTD.).
The irradiance was set at 200 μW/cm2 for the different LED lights and checked by using the CL500A, Konica® Minolta Optics Inc. meter (Figure 2 and Table 1). The peak wavelength and the full width at half maximum (FWHM) for the short- and long-wavelength lights were 470 nm with an FWHM of 25 nm; and 630 nm with an FWHM of 25 nm, respectively.
Pupil size was recorded by using pupil diameter (PD) taken by a camera and equipment (EMR-8B, NAC Image Technology Inc.) placed in front of the participant and inside the integrating sphere and then calculated the % pupil constriction in two different periods of the exposures. As per previous research from Takahashi et al. [13] in which estimated that the irradiance level at which the role of rods in pupillary constriction were replaced by ipRGCs was around 4.54 μW/cm2 ipRGCs, it was proposed in Katsuura et al. [31] that the blue pulsed light of strong irradiance induced significantly greater pupillary response. Therefore we compared this statement to what we obtained as a result; with the difference that, the present experiment delivered a continuous stream of pulses rather than a single pulse with time in between pulses for the pupil to recover as in those previous studies.
The constriction ratio (CR) was calculated by two formulas, considering 2 different periods of exposure. For the T1 period (CRT1), all data were analyzed considering the same sample size for each of the conditions; and, the average pupil diameter (PD) of 1 sec Prior Pulse Insertion (“PPI”), and, the minimum PD value in the Ffirst 5 Seconds (“F5s”) after pulse insertion for the first analysis (Formula 1) and for the T2 period of time (CRT2); considered the average of 1 sec prior pulse insertion (“PPI”) and the average value in the second segment of 5 seconds (“S5s”) after pulse insertion for the first analysis (Formula 2).
Equipment used at the laboratory is not for clinical diagnostics, devices are designed to record data for only a non-invasive experimental type of procedures.
Procedure
Sequence and procedure obey to a true experimental type of design. It is considered a longitudinal analysis, as all participants received every treatment in a counterbalanced procedure (Multiple crossover); therefore, there was no control group; thus, repeated measures were taken as a single blinded type of experiment [36] [37].
By applying the Balanced Latin Square Design [38] [39] for counterbalanced procedures, the treatments were sorted to avoid any carry over effect or fatigue during the exposures. To avoid participants knowing the type of treatment they were going to receive, the previously counterbalanced sequence was randomly assigned to each subject. Participants were instructed to avoid consumption of alcoholic or caffeinated beverages so as to have a good sleep the previous night; they were also asked if they have had worked in shifts or travelled across time zones in the previous month. As part of the experimental procedure the participants were informed about it and they signed the inform consent according to the Ethics Committee of Chiba University, in Japan, where it took place.
The participants arrived to the experiment on the selected day; the time when it was conducted was between 10:00 am to 12:00 p.m. this was to coincide with what is recognized as the lowest melatonin secretion time during the day [40]. During the first 30 ±5 min, the electrodes of the EEG and the pupil size camera detector measuring device were placed and adjusted. Simultaneously, the participants faced the integrating sphere (Figure 4), which had already been set for the background light condition to be measured; this was the adaptation period.
Only one participant per day was exposed to the whole sequence with one background light condition of that day, then in a different day but at the same time, the other background light condition was processed.
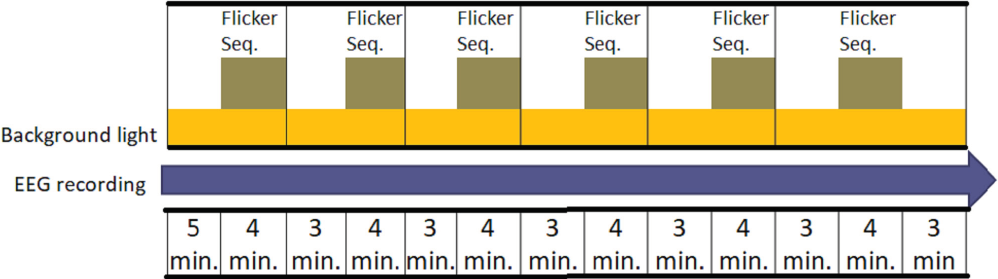
Each subject sat on a chair with his eyes facing the integrating sphere (Figure 3) in a straight position, and resting their chin and head in a support during all tests. The LEDs and a desk type LED lamp were previously installed inside the integrating sphere. After 10 minutes of background light adaptation, the subject was exposed to a stream of pulses of LED light for 4 minutes, then back to the background light for 3 minutes and exposed again to the next stream of pulses; this was repeated for the 6 different types of pulses in one session. Pulses were sorted in a counterbalanced manner, as mentioned before, so as the background light used on that day´s session.
The subjects performed the experiment as shown in Table 2 and Figure 4. During the process, measures of pupil size were taken full time but requested to maintain his eyes open for 5 seconds prior to the first LED stream appearance and to sustain the eyes open for 10 seconds once activated; then they had to keep looking into the sphere but blinking normally To review changes before and after the exposure to the light condition; eyes were requested to be fully open during 5 seconds while they were looking through the integrating sphere at a target previously marked on the inside of the sphere. Flickering perception was evaluated by a single qualitative question during each take after each flickering ended.
Table 2 Experimental procedure
| Step | Start time (Approximate) |
Task (All activities are done between the examiner and the participant) |
Duration (Minutes) |
|---|---|---|---|
| 1 | 10:00 a. m. | Arrival of participant, first light condition is already set in
the integrating sphere. Electrodes for EGG, are attached by the examiner. At the same time instructions are given to the subject about the procedures for the pupil measurement. This is the adaptation period for the participant. |
35 |
| 2 | 10:35 a. m. | Pupil Size Calibration, participant's pupil is targeted and data is stored, under background light only. | 5 |
| 3 | 10:40 a. m. | Exposure to Background light in the sphere continues. 10 seconds before inserting flickering pulse, and 10 seconds after; participant is requested to keep his/her eyes open without blinking. |
5 |
| 4 | 10:45 a. m. | Insertion of first flickering type is applied. |
4 |
| 10:49 a. m. | 10
seconds before exposure ends, and 10 seconds after; participant
is also requested to keep his/her eyes open to record pupil size when flickering is off. |
||
| 5 | 10:49 a. m. | First flickering type is turned off. Exposure to Background light in the sphere remains, participant is asked about flickering perception. |
3 |
| STEPS 4 AND 5 ARE REPEATED FOR THE 6 DIFFERENT STREAM OF
PULSES WHEN THE 6th STREAM OF PULSES IS TURNED OFF, THEN: | |||
| 11:27 a. m. | Participant is requested to rest for 3 minutes. | 3 | |
| 11:27 a. m. | End of experiment. | 10 | |
| 11:37 a. m. | Removal of devices is taken place. | ||
| 11:45 a. m. | End of Session. Total of Session (+/- 5 minutes). |
97 | |
For the statistical analysis, a parametric test was chosen as normality was assumed and the data on our dependent variables was measured on a continuous scale. The sample N=11, data was expected to have statistical significance of p<0.05, and a p<0.1 for a consideration as a tendency.
The data were collected from various sources and processed in the IBM SPSS®, v20 software by repeatedly conducting the analysis of variance (ANOVA) in a 2 x 2 x 3 matrix that compared the 2 background light color temperatures (BLC), BP-LED and BGP-LED intervention, and the 3 different frequencies of flickering used; after which Bonferroni´s post hoc test was evaluated for significance. These were applied to the entire physiological data, both, pupil size and EEG data.
Independent variables in the ANOVA analysis were the 2 BLC, the 3 different frequencies, BP-LED and the BGP-LED. Dependent or non-controlled variables were those such as the intrinsically noise in a measurement like those related to the physiological measurements of the participant; pupil size, and EEG response to light.
Results and discussion
Pupillary constriction
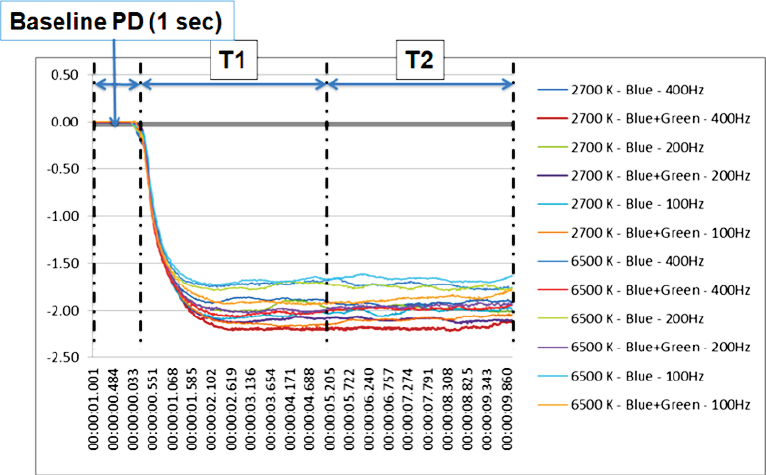
From the measurement of the pupil diameter (PD) (EMR-8B, NAC Image Technology Inc.), we obtained the pupil behaviour in all the exposures (Figure 5). And then calculated the percentage of pupil constriction (CR) in two different periods of the exposures (T1 and T2) (Fig. 6 a, b). The periods were placed from the moment of the light insertion and up to the first 5 seconds (T1) and from the 5th second’s line up to the 10th seconds line (T2); these periods were selected to study the pupil behaviour in regards to constriction proportion (T1) and pupil size stabilization (T2).
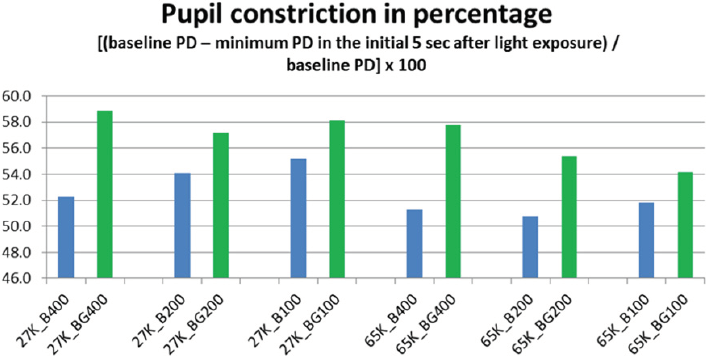
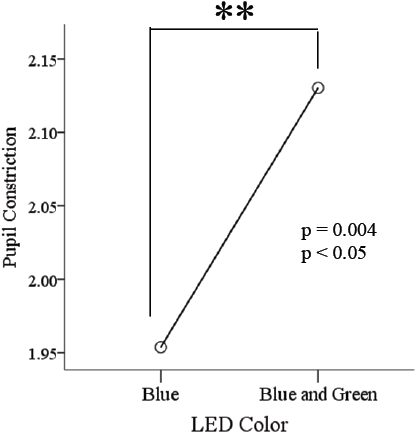
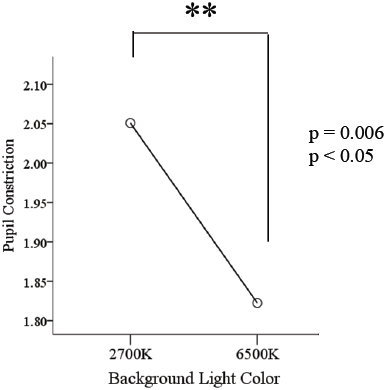
The pupillary constriction in response to simultaneous pulsed BGP LED light was significantly larger (p<0.01) (Figure 7) than that during BP LED light exposure. The BLC also reflected a significant difference (p<0.05) when low color temperature light was used (Figure 8).
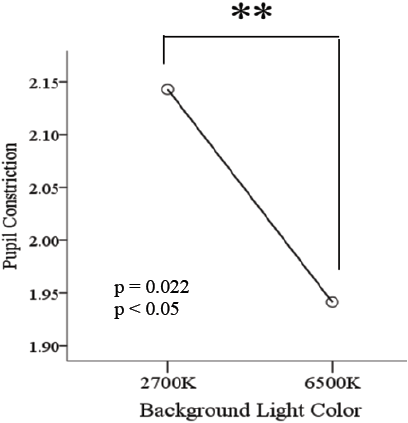
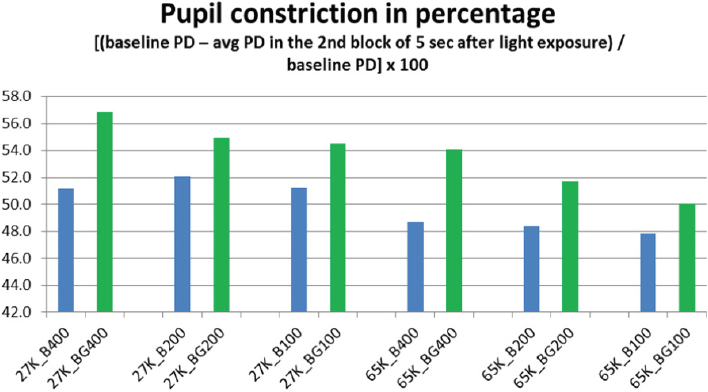
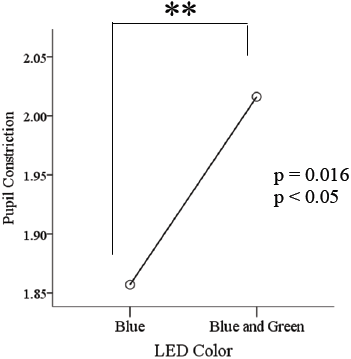
In the second analysis (T2) also denoted statistical significant constriction result (p<0.05) in response to simultaneous pulsed BGP LED which was significantly larger (Figure 9) than that during BP LED light exposure. The BLC also reflected a significant difference (p<0.01) when low color temperature light was used as in the T1 period resulted (Figure 10).
EEG results
In regards to the EEG results, overall measurements were considered for the following relations to brain waves theta, alpha and beta by applying the Formulas 3, 4 and 5:
For specific relation among waves it was also compared to verify the state of alertness as Formulas 6, 7, 8 and 9.
All of the previous measures were reviewed for the Fz, Cz and Oz locations of the scalp and repeated measures among dependent and independent variables were calculated and resulted as described in the following paragraphs (only significant results are shown).
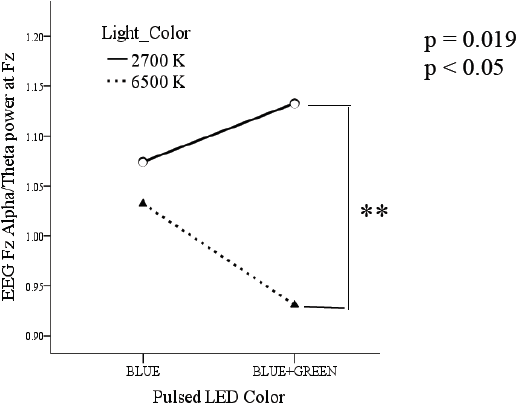
For the Alpha and Theta relation, data denoted a significant result in BLC and LED color comparisons, results were p = 0.019 (Figure 11).
In regards to flickering frequencies, although there were some interesting behaviours of the EEG waves, none of them showed a statistically significant result among them.
As during the test and after each stream of light exposure, participants were requested to give a qualitative evaluation about their own perception of flickering as a subjective evaluation, resulting that flickering perception was not perceived by participants in 100% of the exposures with both BP LED and BGP LED streams.
Constriction rate in BGP LED is larger than BP LED. Background light seems to affect directly to the constriction rate. It might suggest that the combination of Pulsed LED and Background lights has a direct effect on pupil size. This could imply that the ratio of pupil to constrict is longer in backgrounds with high color temperature conditions as those with low color temperature conditions.
Pupil size denoted as per the results in pupillary constriction, that the statement proposed in Katsuura et al. [31] in which blue pulsed light of strong irradiance induced significantly greater pupillary response; in our case was reviewed under a continuous stream of pulses rather than a single pulse with time in between pulses for the pupil to recover as in that previous study; denoting that the combination of BGP LED delivers a greater constriction compared to the BP LED, which adds in knowledge to what was studied before by Takahashi et al. [13] in which estimation of the irradiance level at which the role of rods in pupillary constriction were replaced by ipRGCs was around 4.54 μW/cm2 ipRGCs is also confirmed.
Figueiro et al. 2008 [2] stated that “Brightness perception is inherently sub additive in its response to light due to input from the spectral opponent channels. For example, adding a “green” light to a “red” light will decrease the response of the r-g system, desaturating the vividness of the red light and reducing the apparent brightness of the red light even though more light has been added to it.”; It is possible that by using only Blue or combining Blue and Green the spectral opponent channels are not triggered, therefore the sub additive response analyzed in Katsuura et al [31] is not evident although irradiance in the present experiment is well over the estimation ipRGCs triggering level estimated by Takahashi et al [13].
In regards to the EEG readings during the test, for the α/Ө relation, data denoted a significant result in BLC and also Pulsed LED color insertion comparisons, although results were statistically significant for α/Ө in all scalp locations denoting that participants were awake during the test, perhaps it is to consider that 2700 K has a higher influence in evoking awakeness than 6500 K.
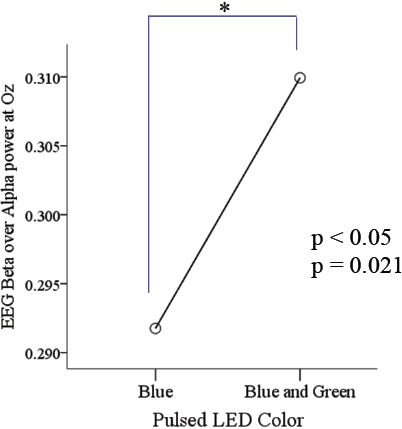
Compelling result came out the β/α measurement analysis as results suggest significant changes in responses during the interaction of background light color, LED, and EEG. Beta waves exhibited a statistical significance (p < 0.05) in arousal levels when exposed to BGP LED light, although no active task was involved during exposure. Furthermore, the pupil reacted with larger constriction towards BGP LED exposure than towards monochromatic BP LED exposure, perhaps due to the double irradiance intensity of the combination; thus demonstrating that a continuous stream of pulses can deliver the irradiance. Perception of change on the ambiance light was not affected due to flickering as per qualitative evaluation results of the participants on flickering perception; it was a 100% evaluated as “no flickering perception”. This is a very important health factor to review which reflected not to affect perception among the frequencies applied. Also, the difference in EEG readings gave to the study the validity of which one could be more effective in delivering alertness among the frequencies used, in our case 100 Hz work elicited the most.
Conclusions
Our findings demonstrated the effect on response to pulsed light on pupillary constriction and EEG responses. As per previous research [26] [27] [28] [29] [30] and results obtained; if we know that ipRGCs activation is related to brain activation (alertness) and cognitive performance, then by reviewing our pupil constriction results, which means ipRGCs have been activated; then, alertness should have been evoked (Fig 11 and 12). It can be concluded that the use of flickering light and that color of light can evoke the most of alertness in our current experimental arrangement even though no active task was performed.
This study supports the previous finding that BP LED helps to improve the state of alertness [10] and therefore it can be applied in what was proposed by adding the continuous pulsed LED light to a task lamp in order to be used in a daily work situation such as that in offices, hospitals, or schools, just with the consideration of adding the green LED to the previously proposed task lamp; as results in the current study, demonstrated that the addition of blue and green LED light evokes alertness and then the idea of making a double color LED lamp can be an available option for the customer.
The use of a flickering emitted beam of light as part of our original experimental design, resulted in a positive effect as depending on the intensity of the irradiance we can reduce it and eliminated the bluish or bluish/green color sensation on our work surface, as it was demonstrated in this experiment that by flickering the light, the perception of a continuous streams of light remains and there is no sensation of being illuminated by a flickering light at all.
This study supports possible applications of continuous pulsed light as a mean to improve alertness in our daily activities although in the present study, the tests were done in a laboratory set up, the materials and parameters used are the same to those that can be applied in the end product that may result from this research.
Circadian Rhythm studies reveal that the best time of the day for blue enriched light exposure is during the morning hours, if blue spectrum is delivered at different time of the day it may affect the phase of the circadian cycle, therefore evoking alertness by suppressing melatonin; so, if supplied during night shifts of work, exposure has to be controlled so in a way that persons are not affected substantially to their circadian rhythm.
In regards to the subadditivity response, could be a good reference as a future step to measure pulsed Blue+Green LED with the same background and frequency conditions only adjusting the irradiance to a ½ + ½ factor to deliver a total of 200 μW/s/cm2 (100 each color) and verify if subadditivity is tied to equal irradiances and triggers the spectral opponent channels.

