


 nueva página del texto (beta)
 Inglés (pdf)
 Artículo en XML
 Referencias del artículo
 Enviar artículo por email
 Citado por SciELO
  Similares en
SciELO
Similares en
SciELO 
 Permalink
Introduction
Medical imaging technologies have become an essential component in many areas of medical research and clinical practice. Most of the modern medical image technologies are capable of providing tomographic structural, morphologic and functional information in the form of 3D or higher-dimensional data (i.e., volumetric data) which is crucial for the proper diagnosis, treatment, and evaluation of the progress of the patients [1]. Analysis of these data requires sophisticated computerized quantification and visualization tools [2]. Medical visualization includes modalities ranging from a single 2D image, 2D images series integrated by thin slices of an anatomic volume, 3D images, and even 4D images that represent how a volume of interest change over time [3]. 3D volume visualization (VV) of medical data, as those obtained using confocal microscopy, computed tomography (CT), magnetic resonance imaging (MRI), positron emission tomography (PET), or functional MRI, is an important aid for diagnosis, treatment planning, surgery rehearsal, education, and research [4].
Current visualization systems consist of one or more graphical displaying devices (e.g., 2D and stereoscopic 3D screens), one or more navigation devices (e.g., mouse, touchpad, touchscreen, tactile and force feedback, multiaxis, and voice commanded controllers) [5, 6]. Several methods have been developed to enable the visualization and interaction with volumetric data [7, 8, 9, 10]. These methods can be grouped into three basic categories: slice-based, surface rendering and volume rendering [11]. Slice-based methods consist of extracting sections of a medical volume using cutting planes that can be orthogonal (i.e., axial, coronal, and sagittal) or arbitrary if computed employing Multiplanar Reconstruction (MPR). Surface rendering methods consist of extracting contours and constructing a polygonal mesh to define the surface of the structure to be visualized. Volume rendering methods make 3D data visible by assigning specific values of color and opacity to each volume element (voxel) and projecting the result onto the image plane.
While 3D visualization often provides an overview of the spatial relations of the regions of interest which is useful for the diagnosis of complex pathologies, 2D visualization such as slice-based methods represent the dominant mode of exploring the volumes since it enables more detailed analysis of the data [12, 13]. However, the extraction of 2D slices with the desired orientation within a volume is a challenging task because the traditional user interfaces employ mediating devices (e.g. mouse and keyboard) and planar surfaces (e.g. monitors and displays) that operate with 2D projections of 3D data [14] increasing the final user’s cognitive effort [15]. Therefore, a solution for VV may be one based on the direct exploration of 3D images through a physical real-world environment instead of a fixed 3D virtual space representation such as the use of augmented reality technologies [16].
Augmented reality (AR) refers to those technologies to visualize and interact with computer-generated images superimposed over a user’s view of the real world. To achieve a convincing augmentation effect it is required to accurately estimate the position and orientation of the relevant objects in physical space and align (register) them with the virtual objects considering the point of view of the observer, in a real-time three dimensional interactive way [17]. This is known as the pose estimation problem and consist of extracting 3D spatial information from 2D images by the use of a camera as a measuring device. The pose of a 3D rigid object indicates its position t and its orientation R with respect to a global reference system (Fig. 1). Numerous solutions to this inverse problem have been proposed over time [18].
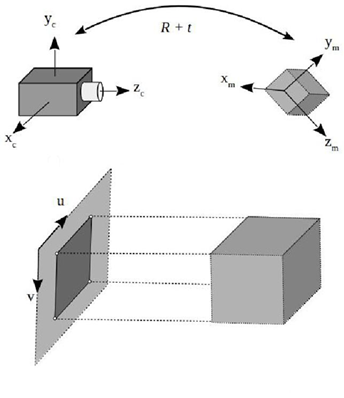
Figure 1 Pose estimation of a 3D rigid object. (a) Camera coordinate system, (b) Model coordinate system, (c) Image coordinate system, and (d) 3D model and its projected image.
In general, it is possible to estimate the object pose if the correspondences between some 3D features and their projections on the image plane are known. Perspective-n-Point (PnP) is a special case of pose estimation (6 DoF) [19]. PnP algorithms are applicable only if a set of 3D-2D correspondences was previously established. In general, these correspondences can be obtained either by using marker and markerless-based approaches. In the marked-based AR, one or more cameras are employed to automatically detect and recognize a specific known pattern (i.e., fiducial markers) and use computer vision and geometrical transformations to estimate the relative positions of the markers with respect to the observer. On the other hand, some markerless methods implement automatic detection and matching of local features to create a set of 3D-2D correspondences for pose estimation. The literature on local features detectors is extensive. Luckily, there are interesting comparative studies on some of the best-known algorithms [20]. Other markerless methods use information from sensors such as GPS, depth cameras or ultrasonic, magnetic and inertial devices (or some combination of them) to estimate the spatial position and orientation of objects [21, 22, 23]. Another important problem to solve is the visualization of the virtual objects within the real world. This is generally accomplished by the use of head mounted displays, holographic displays or by the superimposition of images on a computer, cell phone or tablet screen that projects the images acquired by a camera. It has been shown that the use of augmented reality technologies in health care have the potential to improve the existing techniques and procedures such as health care education [24, 25, 26], medical training [25, 27], mentoring [28], and assisted interventions [29, 30, 31].
In this paper, we present a slice-based methodology for the exploration of 3D medical data. We use the augmented reality principles to determine the spatial position and orientation of a rigid planar object within a defined space in the real world. From the user’s point of view, this physical space behaves as a data container. Our results indicate the feasibility of employing the proposed methodology for a natural and intuitive human-computer interaction with volumetric medical data.
Methods
Consider a CT or MRI scan consisting of a collection of DICOM images, each one representing a different slice or section of a body region (Fig. 2). By combining those slices we can reproduce a 3D structure which can be referred to as virtual volume V consisting of numerical values positioned in a regular grid (Fig.3).
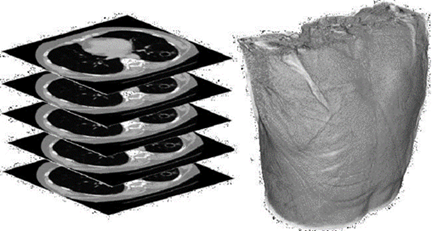
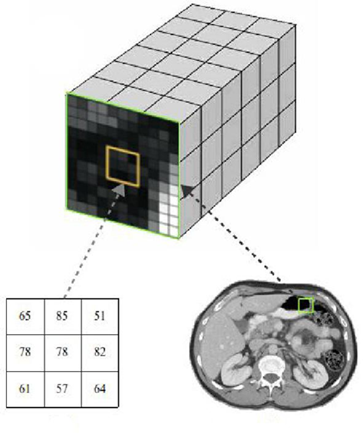
Figure 3 Examples of volumetric medical data: (a) 3D scalar grid, (b) Intensity values, and (c) Cross-section.
Let us define a typical CT or MRI volume V which exists in a virtual space Sv bounded by a square prism of dimensions i × j × k , where k corresponds to the number of slices taken during the volume acquisition (Fig. 4).

The proposed method is based on the idea of mapping a real-world space to a virtual space where a virtual volume can be explored through the manipulation of a tangible object. In particular, we propose tracking the position and orientation of a rigid planar object with respect to a defined space. Then, we use the spatial configuration of the object to define a plane that intersects the virtual volume. Finally, a 2D slice of the 3D medical image is generated (Fig. 5). In this work, we present two implementations of the proposed methodology that differs on the techniques used for solving the pose estimation problem.

RGB-D data based method
We explored a method based on RGB-D data on which the tracking of the objects in the real-world is performed by employing computer vision algorithms on data obtained from a depth camera (i.e., Microsoft Kinect version one). The Kinect camera provides the following three image data: (i) an RGB image depicts the objects in the scene, (ii) a depth image D where the value of each pixel corresponds to the Euclidean distance of the scene objects from the sensor, and (iii) a vector field P with the coordinates x, y, z of the objects with respect to the sensor. Consider four red spheres located on a plane surface at constant distances to form a square. We name realworld space Sp as the volume determined by the plane defined by the spheres and a given height L1. To relate the real-world space Sp with the virtual space Sv, the RGB and D images provided by the Kinect sensor are used for determining the physical location of the spherical markers and the rigid planar object. Each RGB frame of the scene containing the real-world markers is converted to the HSV color space. Next, a threshold segmentation is applied on the hue and saturation channels to obtain a binary image that helps us to determine the regions of the image that corresponds to the spherical markers. Due to illumination changes, it is possible that the binary image contains additional objects different from the four spheres. To remove the non-sphere objects we apply a connected-component labeling algorithm [32] to determine the areas of every object in the binary image which allow us to discard the possible noise (i.e., small pixel regions with color values inside the threshold). By keeping only the four largest objects in the scene, we identify the region belonging to each sphere. Finally, we apply a hole-filling algorithm [33] to remove the possible holes in the segmented spheres due to variations in illumination of the scene, and we employ a mean filter to smooth the edges of the segmented spheres (Fig. 6).

Then, we need to estimate the coordinates of the centroids of the spherical markers in the real-world. Consider a set of k points with coordinates (xi, yi, zi) with respect to the sensor and belonging to one of the four selected objects. The coordinates of the centroid of the object are given by the following expressions:
The height L1 defined in the real-world space Sp can be determined by the number of slices N and the spacing of DICOM data, according to the desired arrangement of V with respect to Sp. After, it is necessary to estimate a transformation T that maps points in the real-world space Sp to points in the virtual space Sv. Let φp and φv be the set of matching 3D points corresponding to m the vertex of the real-world and virtual volumes Sp and Sv, respectively. The problem consist of finding the best-fitting linear transformation T that minimizes the error E between φp and φv:
Since T contains 12 degrees of freedom, a minimum of four pairs of non-coplanar 3D points are required which generate a system of linear equations represented by the matrix equation of the form Tφp = φv. Here, T correspond to a 4 x 4 matrix of unknown transformation parameters, φp is a 4 x 8 matrix corresponding to the known points in Sp and φv is a 4 x 8 matrix corresponding to the known points in Sv (all points in homogeneous coordinates). The least squares method provides a way to solve systems of linear equations constrained by equation 2. By expressing the problem as the calculation of a residual R = || Tφp −φv ||, it is possible to find a matrix T that minimizes R by computing the least-squares solution of smallest norm, denoted here as Γ, which can be obtained as:
The pseudo-inverse matrix
A slice of the virtual volume can be extracted by finding a plane that intersects the medical data in the virtual space. This plane can be defined by the special position and configuration of a planar object ρ in Sp. The position and orientation of a blue rigid cardboard are obtained in real time by processing the RGB-D data provided by the Kinect. Similar with the detection of the red spheres, we perform a color-based threshold segmentation on the RGB image followed by a hole-filling algorithm and noise removal. Then we detect the top-left, top-right, bottom-left, and bottom-right corners of the planar object ρ. The points corresponding to the corners of the plane are mapped into Sv by means of the transformation T. With the transformed points we define a new plane in Sv. Finally, we determine the intensity values corresponding to the voxels of V that intersects this plane and we create an image γ from these values. To obtain the augmented reality visualization on the computer screen, we resize and correct the perspective of γ.
Fiducial markers based method
In planar targets, square fiducial markers simplify the pose estimation problem by providing four key points [35]. The second method relies on the use of fiducial markers that are placed on the objects to track.
In our case, we attached a marker Mp on one side of the rigid planar object employed to slice the medical volume and one more Mv as a reference surface that will define the real-world space where the virtual volume will be mapped. To detect the markers, a fixed RGB camera is placed facing down at a certain height L2 ≤ 1 meter (Fig. 7).

The height H < L2 is calculated using the number of slices N and the spacing of the DICOM data. With W as a known lateral length of the reference surface, a square prism of dimensions W × W × H can be defined. Again, we need to calculate a mapping between this physical space and the virtual space containing the medical volumetric data.
This problem is solved by following the same principles used with the RGB-D approach. If the camera is calibrated, its pose can be estimated with respect to the fiducial. Similarly, it is also possible to estimate the fiducial pose with respect to the camera. When the camera detects the binary pattern of Mp, we obtain the 3D-2D correspondences of four key points (the corners) and we can apply the PnP algorithm to estimate the Mp pose with respect to the camera. This relationship is encoded as a translation vector t plus a rotation vector R according to the Rodrigues formula. Through the detection of the Mv, it is possible to determine the place where the virtual space Sv has to be mapped in the real-world space Sp. To estimate the spatial position and orientation of the planar object ρ we simply calculate the pose with respect to the camera of the fiducial Mp placed on one of its faces. With a pose of Mp, we can get the corresponding augmented reality visualization of the volume slice in the computer screen. The above is done by calculating the intensity values that correspond to the voxels of V that intersect with the cutting plane defined by the marker Mp (Fig. 8).

Results and discussion
We implemented the RGB-D based method in C++ employing the ITK library [36] for the loading and processing of the medical images, the VTK [37] library for the visualization of the results, and OpenNI [38] for the interaction with the depth sensor. The Kinect sensor is positioned in a way that all spheres are in the field of view of the RGB camera and the range of the depth camera. The back of the scene is a white room to facilitate the color-based segmentation steps. The implementation was executed on a PC with a Core I5 processor @ 4GHz and 8GB RAM. Figure 9 depicts some results of using the RGB-D method to explore a reconstructed medical volume from a CT scan of a chest. The left column images correspond to the augmented reality visualization, while the right column to the extracted 2D slice after increasing the size of the image and correcting the perspective distortion.

Figure 9 Depiction of a slice-based exploration in the real-world space using the RGB-D data based approach. The left column images correspond to the augmented reality visualization, while the right column to the extracted 2D slice after increasing the size of the image and correcting the perspective distortion. The images were obtained from the intersection of the plane in the real-world with the medical volume as mapped into physical space.
Note that as the slicing plane changes position and orientation, the image of the intersection of the plane with the medical volume is generated. We found that it was very fast and intuitive for the users to change from one region to another without the requirement of detailed instructions. This result is in line with the main goal of the proposed methodology. However, a drawback of this method is that due to the operation range of the Kinect’s depth camera, it was necessary to place the spheres and the slicing plane about 1 meter away from the sensor. Moreover, since its operation principle is based on the detection of a dot pattern projected by an infrared laser, the performance of the depth sensor can be affected by natural light. These conditions limit the application of the proposed implementation in a real-life setup.
The fiducial markers based method was implemented in C++ using the OpenCV library [39] and the ArUco library [40] to determine the position and orientation of the fiducial markers, and the VTK library [37] for the loading and processing of the medical images.
The object’s position processing part was executed on an NVidia Jetson TK1, and the image corresponding to the section of the volume displayed on a PC with a Core I5 processor @ 4GHz and 8GB RAM using Unity as the 3D graphics engine. In all tests, we used an HD webcam calibrated off-line. Figure 10 depicts some results of using the fiducial markers based method to explore a reconstructed medical volume from a CT scan of a head.

Figure 10 Depiction of a slice-based exploration in the real-world space using the fiducial markers based approach.
Note that similarly with the RGB-D method, the user was able to easily explore different sections of the volume by the manipulation of the slicing plane. Differently from the RGB-D approach, in this case, it was possible to set up the system in a smaller area which allows the easier manipulation of the plane. The above make this implementation more feasible to be incorporated in a clinic or as a device that may be used on a desk. In addition, since this implementation does not require a depth camera, usually more expensive than a regular webcam, it can be built at a lower cost. Therefore, we believe that fiducial markers based implementation is more suitable for practical uses.
Usability Study
To evaluate the perception of users when using the proposed methodology for the exploration of volumetric medical data, we employ two usability metrics tools: the Single Ease Question (SEQ) [41] and the System Usability Scale (SUS) [42]. SEQ is a rating scale to assess how difficult users find a task and that is administered immediately after a user attempts a task in a usability test. In our case, the question asked to the user was: "Overall, how difficult or easy was the task to complete", which is rated from 1 to 5 where 1 means very difficult and 5 means very easy. In the same way, SUS is a reliable tool for measuring the usability of a system and that is currently the industry standard. It consists of a 10 item questionnaire with 5 response options for respondents; from Strongly agree (5) to Strongly disagree (1). The items employed were:
I think that I would like to use this system frequently
I found the system unnecessarily complex
I thought the system was easy to use
I think that I would need the support of a technical person to be able to use this system
I found the various functions in this system were well integrated
I thought there was too much inconsistency in this system
I would imagine that most people would learn to use this system very quickly
I found the system very cumbersome to use
I felt very confident using the system
I needed to learn a lot of things before I could get going with this system
Additionally, we asked the participants how much they were familiar with handling medical volumes such as CT or MRI on a five-point scale where one means no familiar at all and five very familiar. A total of fifty persons with ages ranged from 19 to 23 years old were asked to use the proposed method. They explored a brain MRI for two minutes without any explanation of how the system should be used or what the system was supposed to do. Then, we ask the participants to answer the questionnaires according to their experience with the system. The average SEQ score obtained was 4.36. Figure 11 depicts the histogram of the obtained SEQ scores.
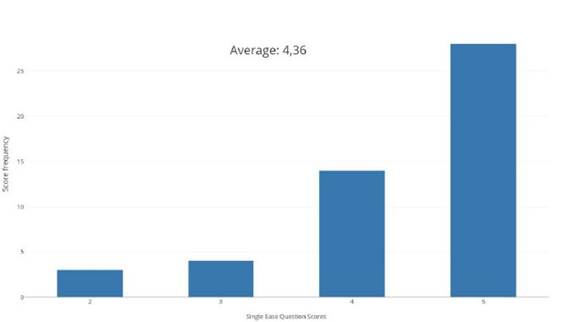
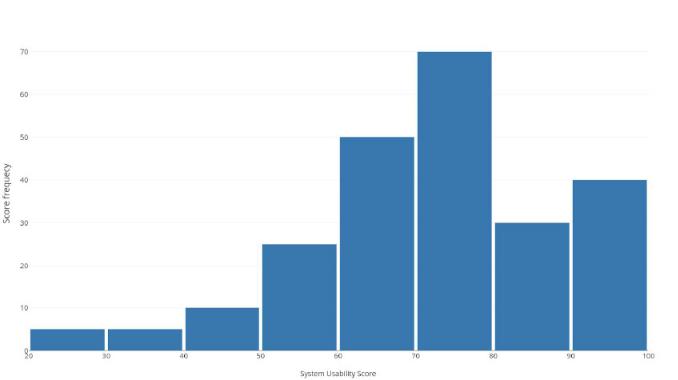
Note that the majority of the persons consider the system easy or very easy to use. The average SUS score obtained was 72.55 which correspond to a subjective rating of "good" according to the scale. Figures 12 and 13 depicts the histogram of the obtained scores for all the participants and for each question, respectively.
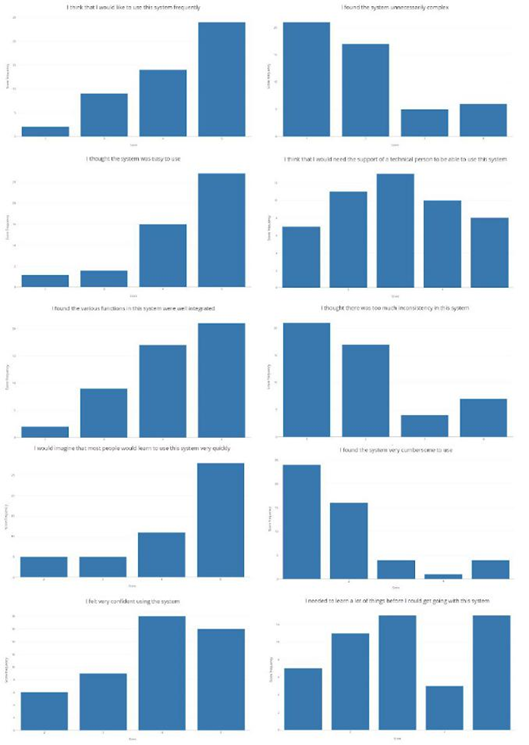
Note that most of the people indicated that they think that the system was easy to use, that they would like to use the system frequently and that they imagine that most people would learn to use the system very quickly. However, the results indicate that some people think that they would need the support of a technical person and that they would have to learn more things before starting to use the system. While this perception may be related to the unfamiliarity with the medical images (average score of 1.73), it would be necessary to evaluate how much training a person would need to change their perception of the advantages of using the proposed methodology. These results should be compared to a new test with physicians who are more familiar with this type of data and who have experience in the use of other 3D slicing software.
We believe that both implementations can be enhanced by the use of VR or AR glasses. In fact, one of the reasons to use the Unity engine was because it allows the easy incorporation of recent commercial technologies such as the Oculus Rift, Microsoft Hololens, HTC Vive, etc. Finally, more interaction could be added by the use of active sensors such as a touchscreen that may act as the slicing plane (i.e., a tablet). This application may include interactive segmentation of regions of interest or changes in the visualization parameters.
Conclusions
One of the main limitations of current methods for analysis of medical image volumes with the computer is the required ability for controlling the mouse and keyboard in such a way that the desired interaction is achieved. Therefore the physicians typically rely on radiologists experts to perform the search on the data and report printouts with the slices that may contain the most useful information. The slice-based methodology for volume viewing that we have presented have the potential of making the process of medical volume exploration easier and intuitive since it is based on the use of a manageable controlled rigid plane in the real-world. Therefore, it is possible that future versions of this system will be present in medical facilities and health clinics as a tool that will help to further explore the data produced by volumetric medical modalities, potentially translating into better diagnosis and treatment of diseases.
However, to be able to convert the proposed system into a successful product it would be necessary to overcome current limitations such as the requirement of a sufficient environmental illumination that would allow to accurately detect the rigid plane. Moreover, it would be important to be able to perform more advanced interactions with the medical volumes as those that are available in commercial slicing software (i.e., segmentation, classification, isosurface reconstruction, etc.). The overcoming of those limitations and the incorporation of VR and AR headsets is subject of future work.
Despite these limitations, our results indicate the feasibility of employing the proposed methodology to enable any user to explore volumetric medical data without the requirement of any training or instruction. This natural intuitive capability of the proposed system could be an advantage for physicians who want to explore medical data but are not familiar with the complicated software and systems currently available on the market.

