


 nueva página del texto (beta)
 Inglés (pdf)
 Artículo en XML
 Referencias del artículo
 Enviar artículo por email
 Citado por SciELO
  Similares en
SciELO
Similares en
SciELO 
 Permalink
Introduction
Alpha and beta cells are two types of pancreatic cells which are extremely important in the body since they secrete glucagon and insulin, respectively, the main hormones involved in blood glucose regulation. In both cell types, hormone secretion has been closely related to electrical activity and Ca2+ oscillations [1, 2]. In addition, it has been discussed that hormones have their own rhythms and their complex signals affect the normal and pathological functioning of the body [3]. In particular, insulin secretion occurs in an oscillatory manner as a response of the beta-cell system to the presence of high blood glucose, which has been recognized as a key factor in maintaining glucose levels in normal people. Indeed, the loss of pulsatile secretion is considered a sign of diabetes disease [4].
Glycolytic oscillations have been proposed as one of the key factors related to pulsatile insulin secretion [4]. Glycolysis is the metabolic pathway that phosphorylate glucose to produce ATP (Adenosine Triphosphate), the main energetic coin in the body. The first steps of this pathway involve the autocatalysis of the Phosphofructokinase (PFK) enzyme, which is regulated by its own product Fructose 1-6-bisphosphate (FBP). Models of glycolysis taking this autocatalytic regulation into account can reproduce slow metabolic oscillations in the range of minutes [5], the timescale observed for the physiological slow component of insulin secretion [4]. There have been many modeling works oriented to elucidate the mechanisms behind the link between high glucose and electrical and metabolic activity in beta cells, leading to insulin secretion [6, 7, 8].
On the other hand, in experiments with alpha cells, electrical activity and secretion is observed at low glucose concentrations [9], along with oscillations of ATP and Ca2+ [10]. Since alpha cells regulate blood glucose coordinated with beta cells, it is natural to suppose that glycolytic oscillations might play a key role in the behavior of alpha cells at low glucose, in a similar manner as they do in beta cells at high glucose [11]. Therefore, in this work we explore the possibility that glycolytic oscillations could be related to electrical activity in alpha cells. Our approach is to do a modelling study based on a beta-cell model since there are no specific descriptions of glycolysis in alpha cells.
Methods
Alpha cells are excitable cells that generate electrical action potentials and Ca2+ oscillations when exposed to low glucose environments [1, 9]. However, it is not clear how glucose level is coupled to electrical activity, and in turn, how this regulates glucagon secretion [12]. In particular, there are no specific studies about the glycolytic pathway in pancreatic alpha-cells, but it has been proposed that the rate of glucose utilization and the glycolytic flux are similar to those observed in beta cells [12, 13]. A general description of glycolysis based on PFK kinetics, which accounts for variations in ATP, FBP, and fructose 6-phosphate (F6P) was proposed by Smolen (1995) [5], and this model has been used to simulate glycolytic oscillations in beta cells [6].
Modelling glycolysis and electrical activity in beta cells considers that glucose enters the cell and triggers the glycolytic pathway which is mainly autoregulated by FBP (Figure 1). Glycolysis is closely related to mitochondrial metabolism through the production of pyruvate; in this case, both steps produce ATP and modulate the intracellular ATP/ADP ratio. This ratio modifies the conductance of ATP-dependent potassium channels (KATP channels), resulting in a depolarization of the cell that triggers action potentials. This electrical activity involves the opening of Ca2+ channels, so the cytoplasmic Ca2+ level is also increased which, in turn, modulates the mitochondrial metabolism and the ATP production leading to autoregulation.
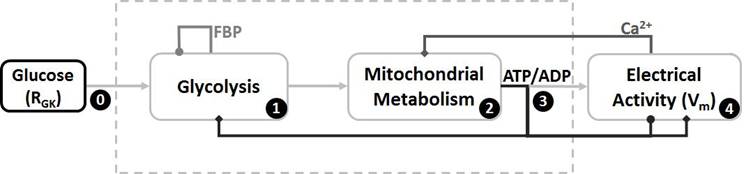
Figure 1 Scheme of the relationship between glucose and electrical activity. The model shows that glucose triggers glycolysis (step 0) which is autoregulated by FBP (step 1). The product of glycolysis (pyruvate) is directly connected to the mitochondrial metabolism which is modulated by Ca2+ (step 2). The ATP/ADP ratio (step 3) is mainly controlled by mitochondria and this ratio manages electrical activity (step 4) and glycolysis too, leading to a feedback loop for cell autoregulation. Steps inside the dotted lines have been described for beta cells but not for alpha cells.
The sequence of events described above (and in Figure 1) is well accepted for beta cells [4, 6], but just some of these steps have been also described for alpha cells; indeed, there is clearance just for step 0 leading to step 4 [12, 14], and the intermediate steps (1 to 3) are not completely known. Thus, we modify a previous beta-cell model [6], including all these steps, in order to take into account some of the main differences between both cell types: 1) The small size of alpha cells [1], 2) Their opposite response to glucose [1], and 3) Their very different KATP conductance under stimulation [14].
The whole proposed model is described in Figure 2, where equations of the main variables are shown. These variables are RGK, G6P, F6P, FBP, ADP and ATP for the glycolytic pathway and the mitochondrial metabolism (steps 0, 1, 2 and 3), and V (membrane potential) for the electrical activity (step 4). Membrane potential is calculated from the contribution of sodium, calcium and potassium currents relative to the membrane capacitance (Cm). Cytosolic Ca2+ (Ca) variates due to ionic currents (Jmem) and the endoplasmic reticulum (Jer). KATP current (IKATP) is a very important current because it has been proposed as the link between the metabolic function to the electrical activity in alpha cells [14]. Parameter values of our model are shown in Table 1, and the rest of equations are included in the Appendix.
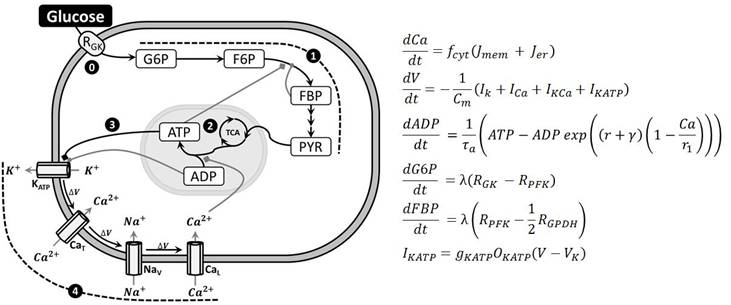
Figure 2 Proposed model to study glycolysis and electrical activity in alpha cells. (Left) Glucose enters into the cell at a rate RGK (step 0) and triggers glycolysis (step 1). Then mitochondrial metabolism is activated (step 2) which modifies ATP/ADP ratio (step 3). This ratio modulates the conductance of KATP channels which initiate depolarization and electrical activity (step 4). (Right) Equations of the main variables analyzed in this work. Other equations are included in the Appendix.
Results and discussion
The relationship between electrical activity and glycolytic oscillations in alpha cells under different glucose levels was studied by simulating the appearance of action potentials (APs), through the dynamics of the membrane voltage (Vm), along with the behavior of the cytosolic ADP and FBP concentrations. The parameter RGK, which is defined as the glucokinase rate, is the value that represents glucose level. Particularly, we chose values 0.05 and 0.2 for RGK to simulate low and high glucose conditions, respectively.
As shown in Figure 3, at high glucose there are permanent and fast bursts of APs while ADP and FBP are oscillating in the range of minutes. This behavior is similar to the slow glycolytic bursting mode reported for beta cells [6], although in our alpha model electrical activity never stops, and ADP and FBP oscillations are more frequent than in betas. Also, ADP varies around 900 μM, which is slightly larger than the values observed in betas (780-840 μM).
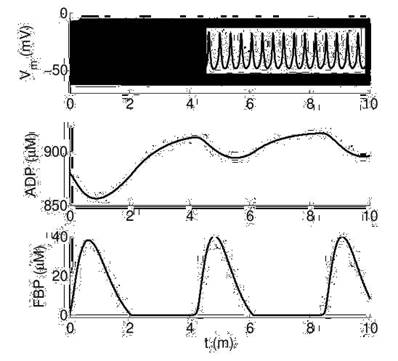
Figure 3 Dynamics of electrical activity (Vm) and metabolic variables (ADP and FBP) at high glucose (RGK=0.2). The inset in the top panel shows a zoom to measure AP frequency (15 per second).
In Figure 4 we show results for low glucose in the same simulation time (10 minutes). As seen, there are also permanent fast bursts of APs but metabolic variables (ADP and FBP) are not oscillating in this range of time. However, in a longer simulation time (40 minutes) we found very slow oscillations of both metabolic variables (Figure 5). ADP varies above 900 μM, a value slightly larger than the one we obtained for high glucose.
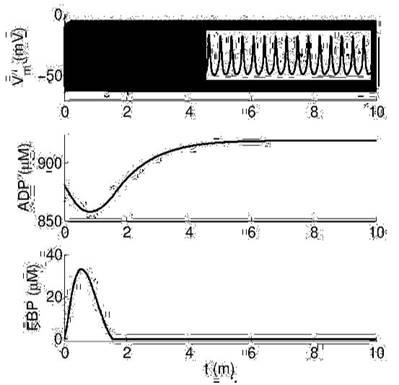
Figure 4 Dynamics of electrical activity (Vm) and metabolic variables (ADP and FBP) at low glucose (RGK=0.05). The inset in the top panel shows a zoom to measure AP frequency (15 per second), which is the same that at high glucose.
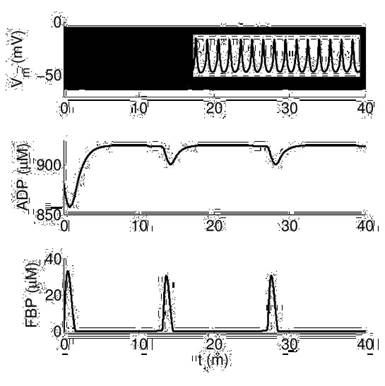
Figure 5 Long-term dynamics of electrical activity (Vm) and metabolic variables (ADP and FBP) at low glucose (RGK=0.05). Simulation time is 40 minutes. The inset in the top panel shows that AP frequency remains.
The behavior observed in Figures 4 and 5 could be compared to the non-oscillatory mode reported for beta cells when they use a too low or a too high value of the RGK parameter [6]. However, and in contrast to those reported results for beta cells, we found that electrical activity does not change when glucose level changes, whereas metabolic variables do. Moreover, the AP firing rate (15 AP per second) in these three simulations remains.
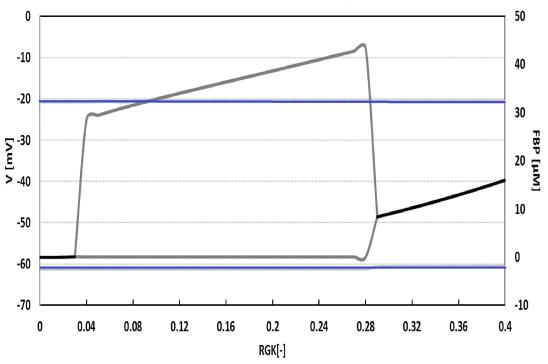
All these results indicate that glycolytic oscillations are not directly modulating electrical activity in alpha cells, since bursts of APs appear independently of what is happening with the metabolic variables. Then, we studied the system in a broader range of glucose levels by drawing a bifurcation diagram of two variables, the membrane potential and the FBP, as functions of the glucokinase rate (Figure 6). This diagram confirmed our previous observations because the alpha model exhibits permanent electrical activity for all the explored values of RGK, even if the metabolic variable changes between oscillatory and steady-state behavior.
Conclusions
Using an alpha cell model that includes the glycolytic pathway, the mitochondrial metabolism and the ionic currents, we studied metabolic and electrical variables under low and high glucose conditions. We obtained that at low glucokinase rate, which indicates low glucose level, glycolytic oscillations are slower than at high glucose, but electrical activity does not change in amplitude nor in frequency as they do for beta cells.
Based on a bifurcation analysis, we observe that glucokinase rate modulates metabolic variables but not the electrical response. This is an interesting condition since in beta cells glycolytic oscillations have been directly related to electrical activity, Ca2+ oscillations and pulsatile insulin secretion [4, 17].
Our model analysis suggests that electrical activity in alpha cells can occur independently of glycolytic oscillations. Thus, it will be useful to study other pathways involved in metabolic changes, electrical activity and Ca2+ increases observed during alpha cell stimulation leading to glucagon secretion. Recently, there have been reports pointing out the importance of glycolysis, mitochondrial metabolism and ATP production in the control of glucagon secretion, and in turn, in the development of diabetes [10, 15, 16].
Modelling studies can contribute to understand better the sophisticated functioning of this pancreatic cells along with their role in blood glucose regulation specially during hypoglycemia.

