nueva página del texto (beta)
 Inglés (pdf)
 Artículo en XML
 Referencias del artículo
 Enviar artículo por email
 Citado por SciELO
  Similares en
SciELO
Similares en
SciELO 
 Permalink
INTRODUCTION
DNA sequences are carriers of hereditary material in all living organisms [1]. The hereditary information in DNA is stored as a code made up of four chemical bases, adenine (A), guanine (G), cytosine (C), and thymine (T), written in triletter words (codons) without delimiters that are decoded after copying into a complementary RNA (transcription) into a matching protein sequence in a process called translation. In the 2000s, the Human Genome Project estimated that only approximately 2% of human genome consists of coding sequences and the remaining large part of the DNA (non-coding regions) does not serve as a template for protein sequences [2].
However, ENCODE and Epigenomic Roadmap consortiums evidenced that there are regulatory functions in the apparently non-functional sequence of the human genome [3,4]. Both consortiums located the regulatory regions in 127 cell lines based on epigenomic profiles [4,5], and thus, they implemented an experimental whole-genome validation of the histone code.
The histone code is a set of rules that maps the histone modifications to chromatin packaging events and leads to regulatory functions in gene expression [6-8]. Altogether, these events build a regulatory machinery that depends on the environmental context, shows diverse gene expression profiles and, hence, a diversity of cell lines [9,10].
Elements of the previously mentioned context, that possibly determine a cell line, are locations where the chromatin packaging events happen [11-15].
A way for studying such phenomena is suggested within an emergent discipline, Code Biology, which considers life events, for instance, as maps between organic signs and organic meanings [16-18]; in this work represented by genomic sequence and regulatory function, respectively. The Code Biology approach includes a methodology for identifying organic codes consisting of three steps: (i) demonstrating the existence of two sets linked by an organic code; (ii) identifying the decoder of the organic code, called adaptor; and (iii) validating an arbitrary nature of the organic code (compare, for instance, Hofmeyr [19]).
In particular, in [20], the histone code was examined from this viewpoint: “we try to show how simple combinations of essential elements such as histone modifications can participate in sophisticated cellular features such as the structure of the genome. Here code is identified, where an input system (histone modifications) is translated into an output system (chromatin states) via adaptors (epigenetic regulators or transcription factors). Such a code has distinct importance in gene regulation and consequently for the cellular phenotype”.
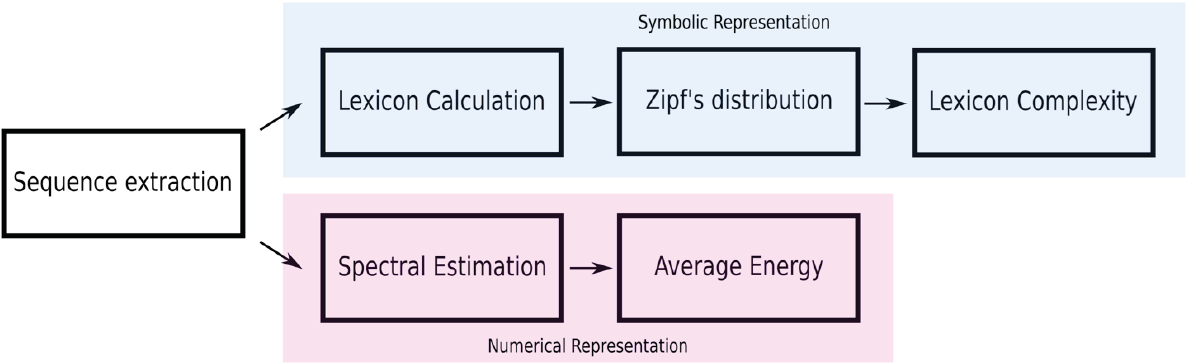
In this exploratory work, we implement genomic signal processing and natural language techniques to explore the sequences of regulatory regions and evidence that indeed these sequences play an important role in the regulatory machinery.
METHODS
In this work, the regulatory regions of three types of human cell lines are being explored to identify differences between the regulatory machineries in these cell lines at the sequence level. A workflow of the methodology in this work shown in Figure 1.
In order to perform this preliminary analysis, we choose the cell lines: H1 cells, Primary T CD8+ naive cells and Brain hippocampus middle, that represent pluripotent cells, first culture, and differentiated cells.
We download the files of the three cells corresponding to 14 regulatory regions (Table 1) proposed by the Epigenomic Roadmap Map project from the database of the mentioned project (http://www.roadmapepigenomics.org/data/, August 2018).
Table 1. Regulatory regions proposed by the Epigenomic Roadmap Consortium [4].
| Regulatory regions | |
|---|---|
| Abbreviation | Name |
| TssA | Active TSS |
| TssAFlnk | Flanking active TSS |
| TxFlnk | Transc. at gene 5’and 3’ |
| Tx | Strong transcription |
| TxWk | Weak transcription |
| EnhG | Genic enhancers |
| Enh | Enhancer |
| ZNF/Rpts | ZNF genes + repeats |
| Het | Heterochromatin |
| TssBiv | Bivalent/poised TSS |
| BivFlnk | Flanking bivalent TSS/Enh |
| EnhBiv | Bivalent enhancer |
| ReprPC | Repressed Polycomb |
| ReprPCWk | Weak repressed Polycomb |
The downloaded files contain the location indices of the regulatory region in the human genome. Based on the indices, we extracted the corresponding sequences and mapped them into a genomic signal by the Voss method. In this work, we keep both representations of the DNA, sequences and the genomic signals.
The Voss method is a tetradimensional graphic of the DNA sequences that represent in each dimension a nucleotide and value the presence x[n]=1 and absence x[n]=0 of the respectively nucleotide. For example, the genomic signal of the sequence “GTCAGTCGTAA” is:
Symbolic representation
We classify sequences into 14 groups, where each group contains the sequences with one of the regulatory functions from Table 1. As asserted in the Introduction, a DNA sequence can be symbolically represented as a chain of four letters (A, T, C, and G). In this representation, a word of length k or k-mer is an arbitrary subsequence that contain k consecutive nucleotides. It is easy to see that the number of words in a sequence of length l is equal to l-k+1. Hereinafter, we will call these words the k-lexicon of the sequence.
According to this approach, we calculate the k-lexica for each sequence for the k values from 3 to 16 nucleotide towards to identify relevant lexica in the non-coding regulatory sequences. Then we calculate the relative frequency for each word in each of the k-lexica to obtain the probability distribution of the lexicon and order the frequencies in the descending order.
The obtained distribution is the so-called Zipf’s law distribution (Figure 2). The Zipf’s law is a power law that describes many types of data studied in the physical and social sciences, among them the language [21], and states, for instance, that the frequency of any word is inversely proportional to its rank in the frequency table. In the specific case of the language, the Zipf’s law is a measure of the complexity/degeneracy of the language and an expression of the least effort principle of the vocabulary [22],[23]. We will adopt the equation of the Zipf’s law distribution in the following form:
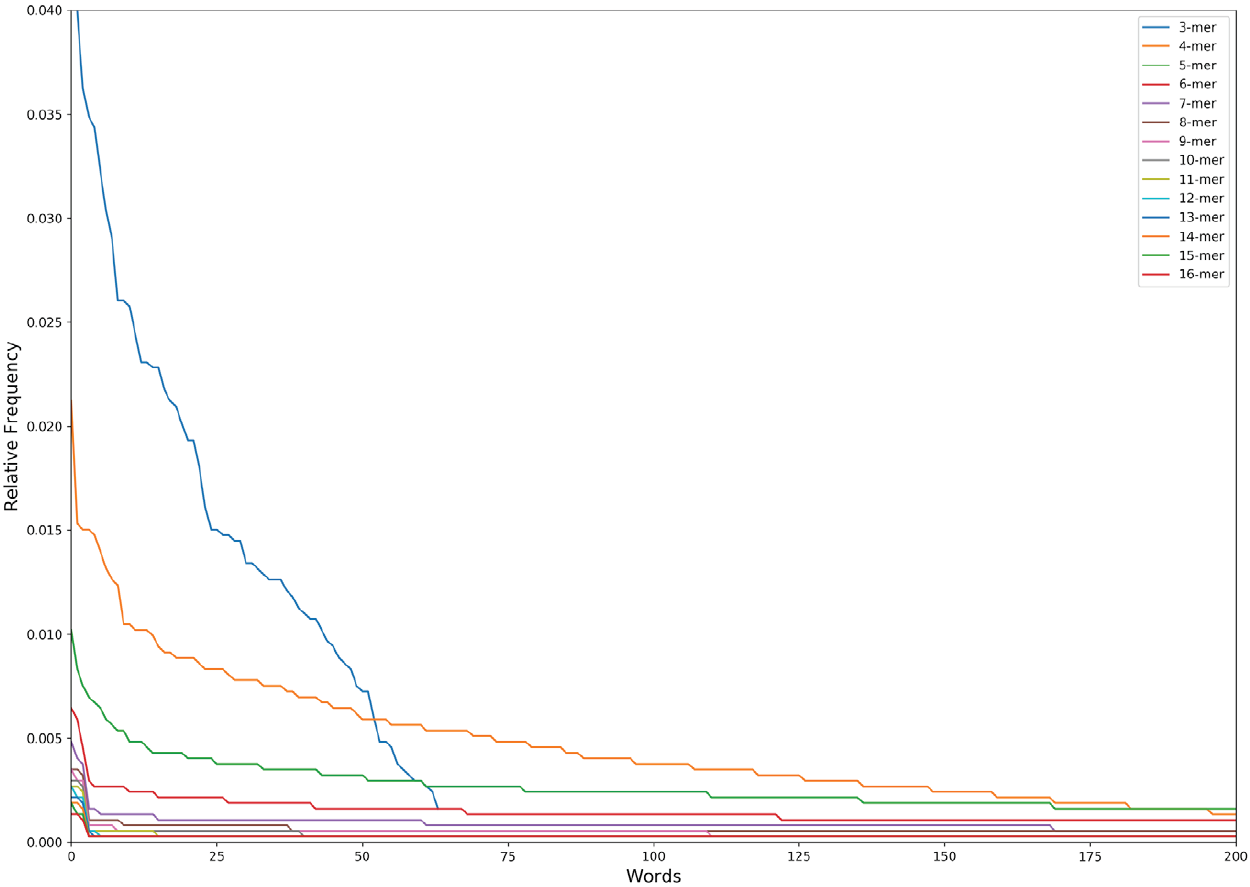
Figure 2. The Zipf’s Law distribution of the first 200 words (except 3 nucleotides that has a maximum of 64 words lexicon) in the n-lexicon from 3 nucleotides to 16 nucleotides.
where w is a word in the lexicon; r(w) the absolute frequency of the word; A a constant; b the value of the exponent characterizing the Zipf’s distribution. In this work we call b the lexicon complexity, and mean the higher the value of b the higher the complexity/degeneracy of the vocabulary [24]. After all, g(w) denotes the relative frequency of the word w.
Thereafter, we linearize the Zipf’s distribution by dividing each value with its respective inverse. The result distribution is now a distribution with linear behavior, which slope is the lexicon complexity. We do a linear regression by the least square method to calculate the lexicon complexity of each sequence for its vocabularies from 3 nucleotides to 16 nucleotides.
Numerical representation
For each genomic signal, we calculate its periodogram. A periodogram is a technique to obtain the frequency spectrum of a signal, in this case, a genomic signal. This technique enhances the spectrum and fixes it to a certain length, that is important to this work because of the variable lengths in the sequences of this work. We fix all the periodogram to the length of 500 values.
The equation to calculate the periodogram is given by Eq. 2 where X[n] represents the periodogram of the genomic signal, N the number of points, x[n] is the genomic signal, in this work the Voss representation, and f the frequency. An example of a periodogram is shown in Figure 3.
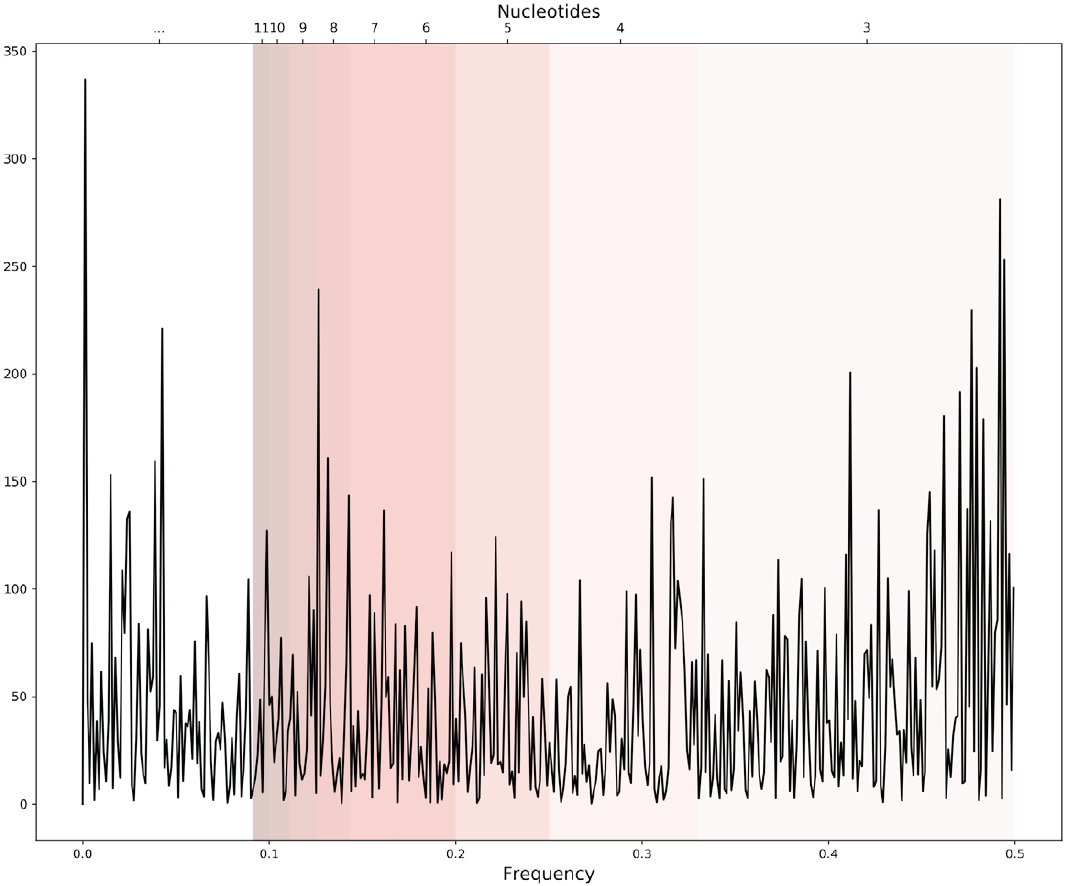
Figure 3. An example of a periodogram of one genomic signal. Bands of frequencies represent the pattern information of a length in the sequence correspondent to certain nucleotides i.e. 0.33-049 frequencies represent the patterns of 3 nucleotides length.
After all, we divide the periodogram into frequency bands that correspond to periodicities in the genomic signal, recalling that the inverse of the frequency is the periodicity. We have then 14 intervals of frequencies (Table 2) that correspond to the same values of length, from k=3 to k=16, that we calculate for the lexicon complexity.
Table 2. Intervals of frequency and their corresponding periodicities.
| Periodicity (nt) | Interval of frequencies (Hz) |
|---|---|
| 1 | 0.330 - 0.500 |
| 2 | 0.250 - 0.330 |
| 3 | 0.200 - 0.250 |
| 4 | 0.167 - 0.200 |
| 5 | 0.143 - 0.167 |
| 6 | 0.125 - 0.143 |
| 7 | 0.111 - 0.125 |
| 8 | 0.010 - 0.111 |
| 9 | 0.091 - 0.010 |
| 10 | 0.083 - 0.091 |
| 11 | 0.077 - 0.083 |
| 12 | 0.071 - 0.077 |
| 13 | 0.067 - 0.071 |
| 14 | 0.062 - 0.067 |
| 15 | 0.067 - 0.071 |
| 16 | 0.062 - 0.067 |
Then, we calculate the average energy of each interval to evaluate the average potential capacity to encode information in the evaluated pattern length [25], adopting the following average energy equation
where Ek is the energy ascribed to the periodicity o pattern length k; fo is the initial frequency of the interval; fu the upper frequency of the interval; X[n] is the periodogram of the genomic signal; and N k the number of points in the periodogram corresponding to pattern length k frequencies.
RESULTS AND DISCUSSION
The 14 regulatory regions used in this work correspond to 1’009,178 sequences, distributed as follows: 363,513 from cell line H1 cells; 249,377 from cell line Primary T CD8+ naive cells; and 396,288 from cell line to Brain hippocampus middle. The lengths of the sequences vary from 200 to 2,000 nucleotides.
For each sequence, we calculate 14 average energy, and, respectively, 14 lexicon complexity values corresponding to the patterns of lengths between 3 and 16 nucleotides. The average energy and the lexicon complexity are indicators that point out to the potential capacity, and respectively, information encoding quality/degeneracy in DNA sequences [26-30].
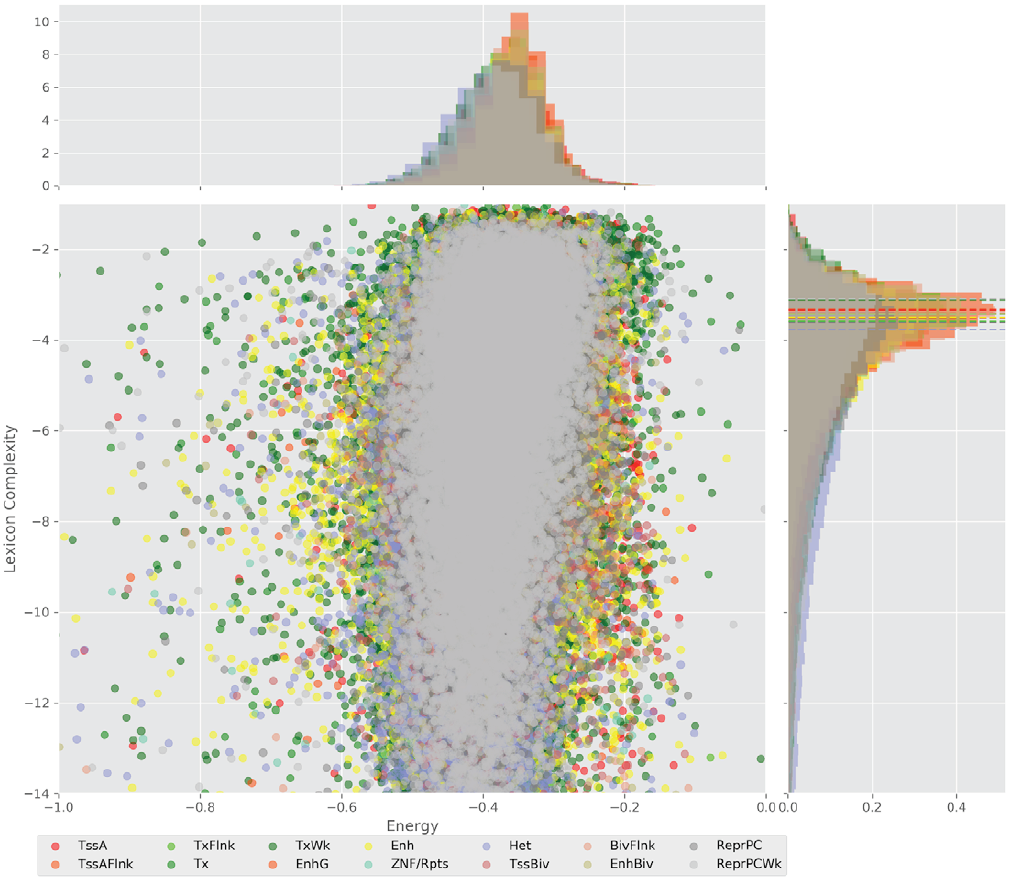
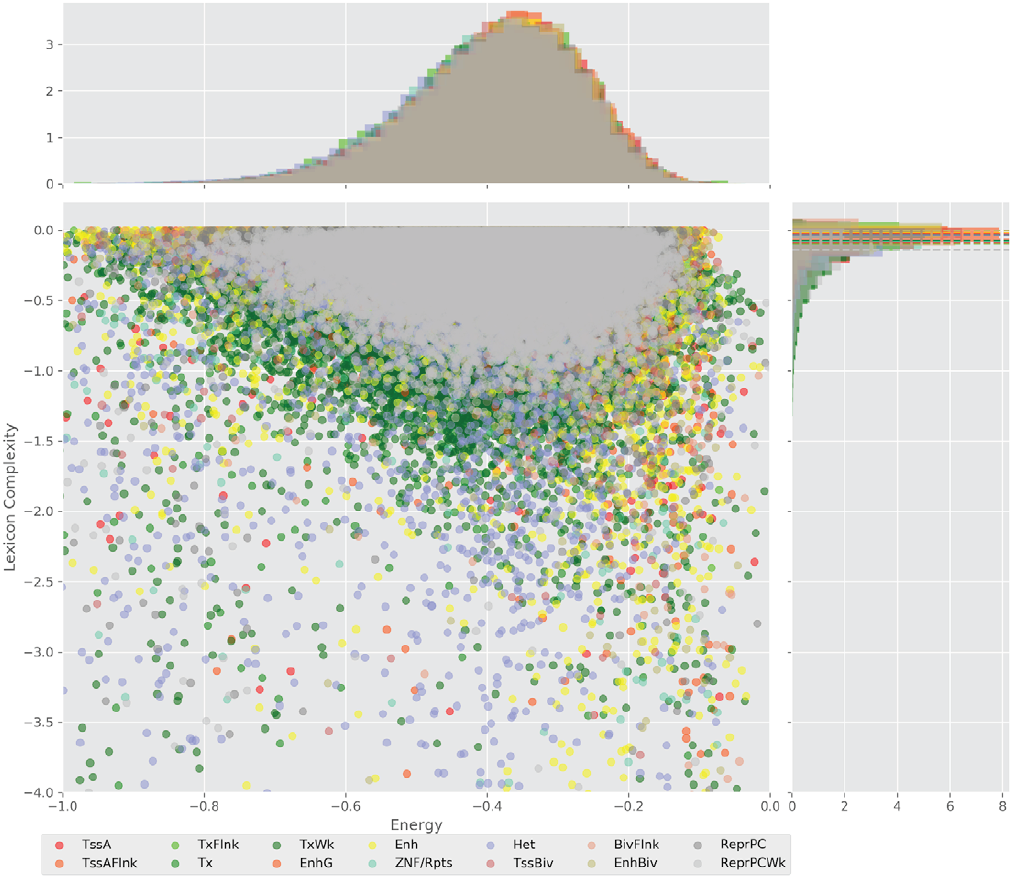
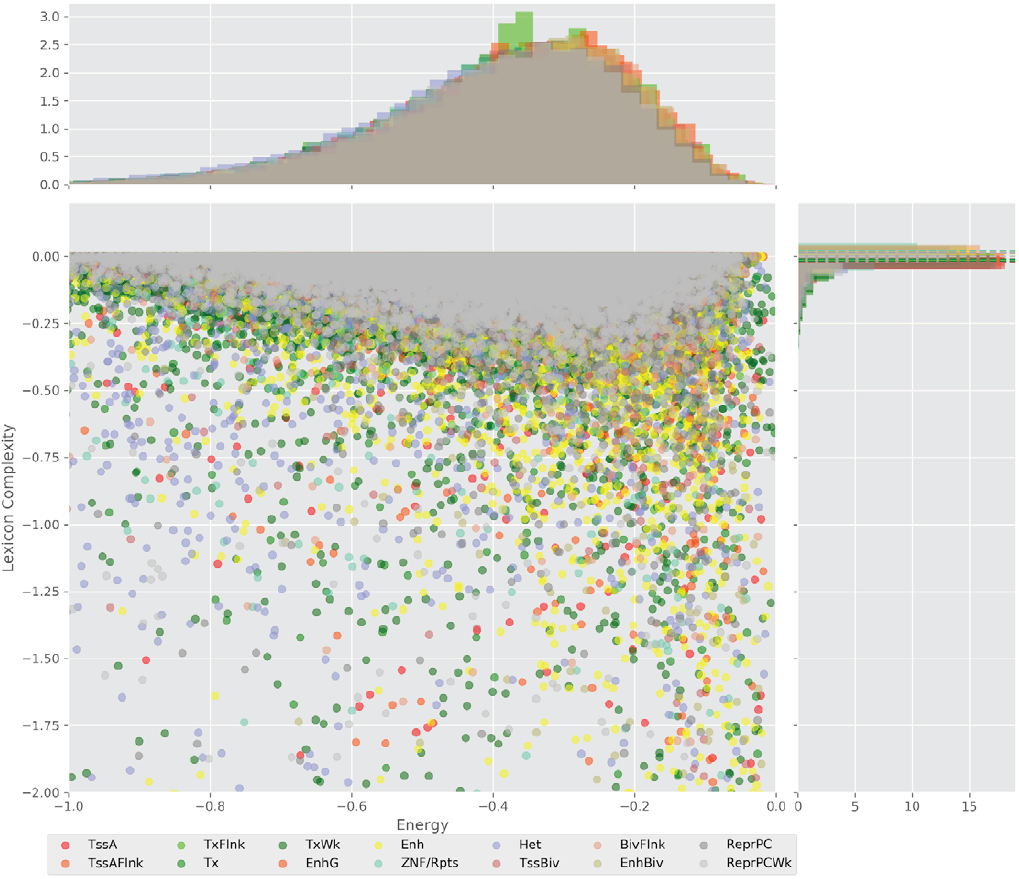
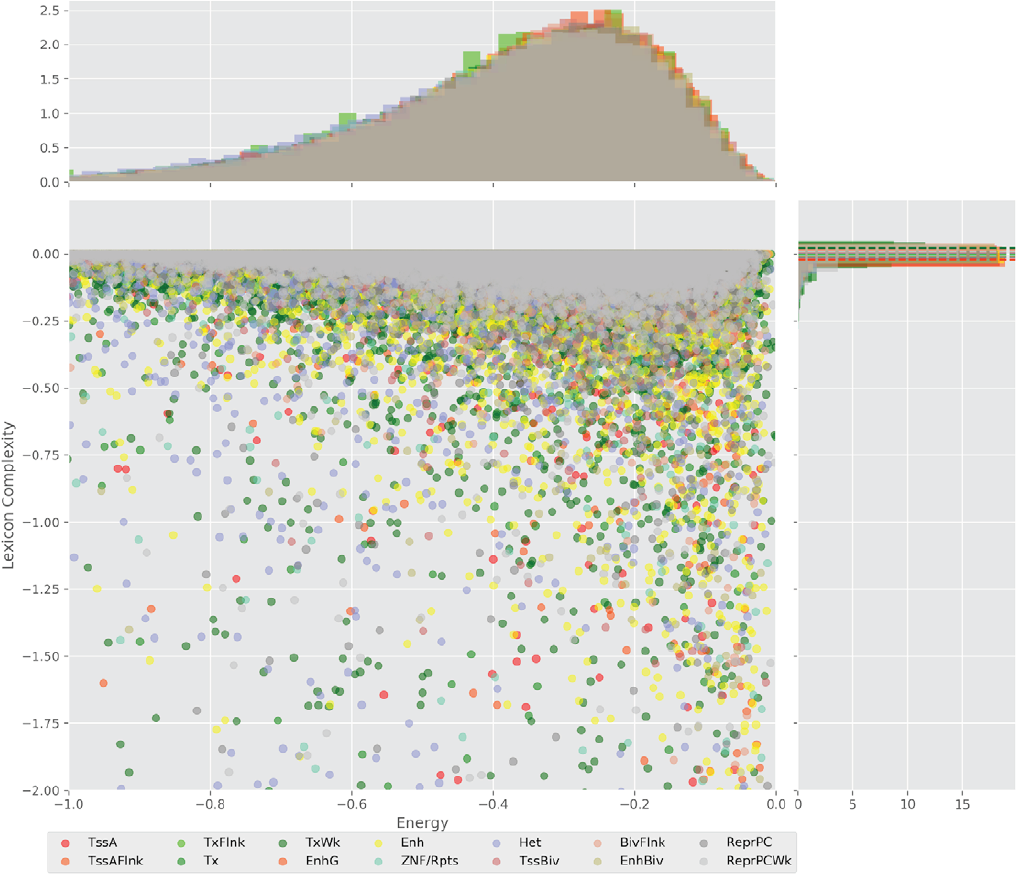
Figure 4 displays the potential capacity against quality dynamics for the regulatory sequences of the cell line H1 cells and their k-lexicons with k=6. The histograms of the energy (upper left, Figure 4) can be interpreted the way that the potential to encode information at the length of 6 nucleotides tends to be similar in the sequences of any regulatory region. The same behaviour can be observed in the rest of the lengths (see figures S1-S13) that likely indicates that there is no difference in codifying information for any word length.
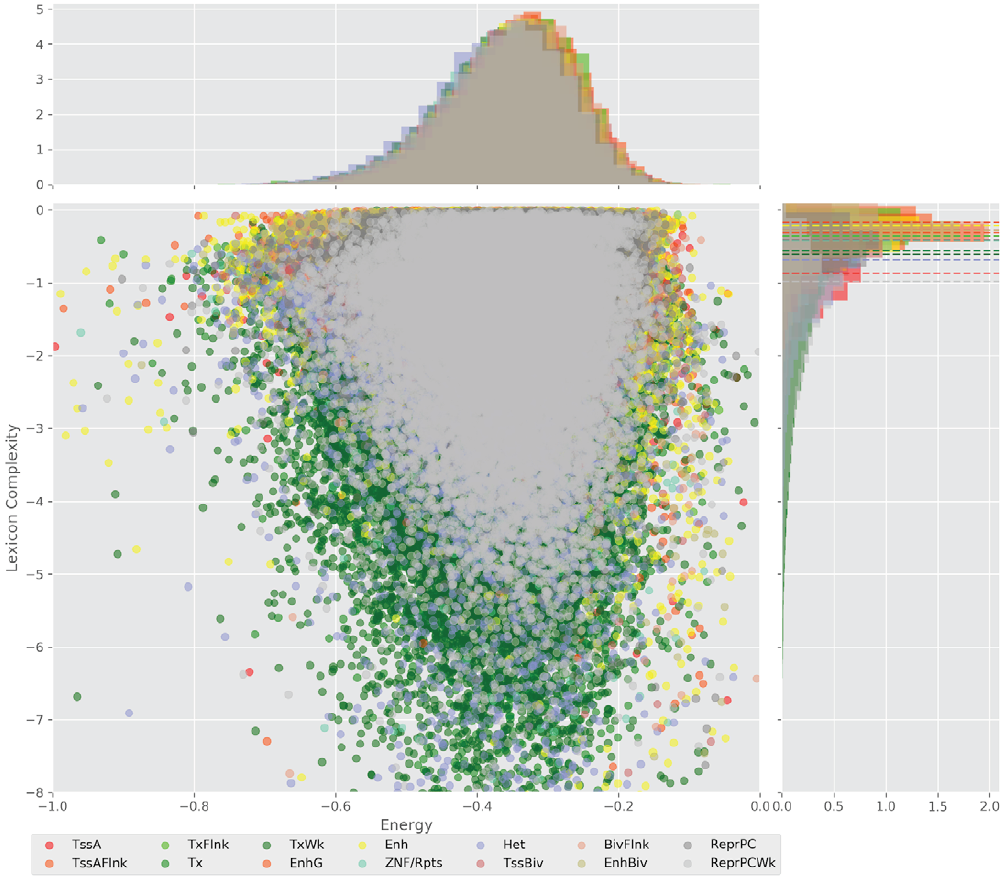
Figure 4. Energy against the 6-lexicon complexity (lower left) of the DNA sequences for he 14 regulatory regions of cell line H1 cells. The histograms correspond to the distribution of the energy (upper) and the distribution of the lexicon complexity (right). The dotted lines represent the most common value of the respective regulatory region.
However, the lexicon complexity for k=6 (right, Figure 4) behaves in a different way for different regulatory regions. The dotted lines represent the common value of lexicon complexity in the sequences of the 14 regulatory regions. This feature suggests that there is a difference, at least for this length, between the regulatory regions in the information encoding quality. Let us note that biological information encoding quality in DNA sequences could be interpreted as a degree of degeneracy.
Degeneracy is a biological phenomenon that means the ability of elements that are structurally dissimilar to perform the same function or yield the same output [26,27]. In this work, this notion represents the ability of multiple sequences with a certain potential capacity to codify a unique biological function, a regulatory function.
The different degeneracy values in the regulatory regions indicate that the diversity of the words in their respective lexicons is different depending on the region, and meaning, as well as the numbers of words (signs) that encode such regulatory function (significant). As for their codes, i. e. the relationships between corresponding sets of signs and significant, they may be different, too. Nevertheless, in this work we don’t explore the specific words for each of the single regulatory function lexicons, and, thus we describe the code of each regulatory region as a whole.
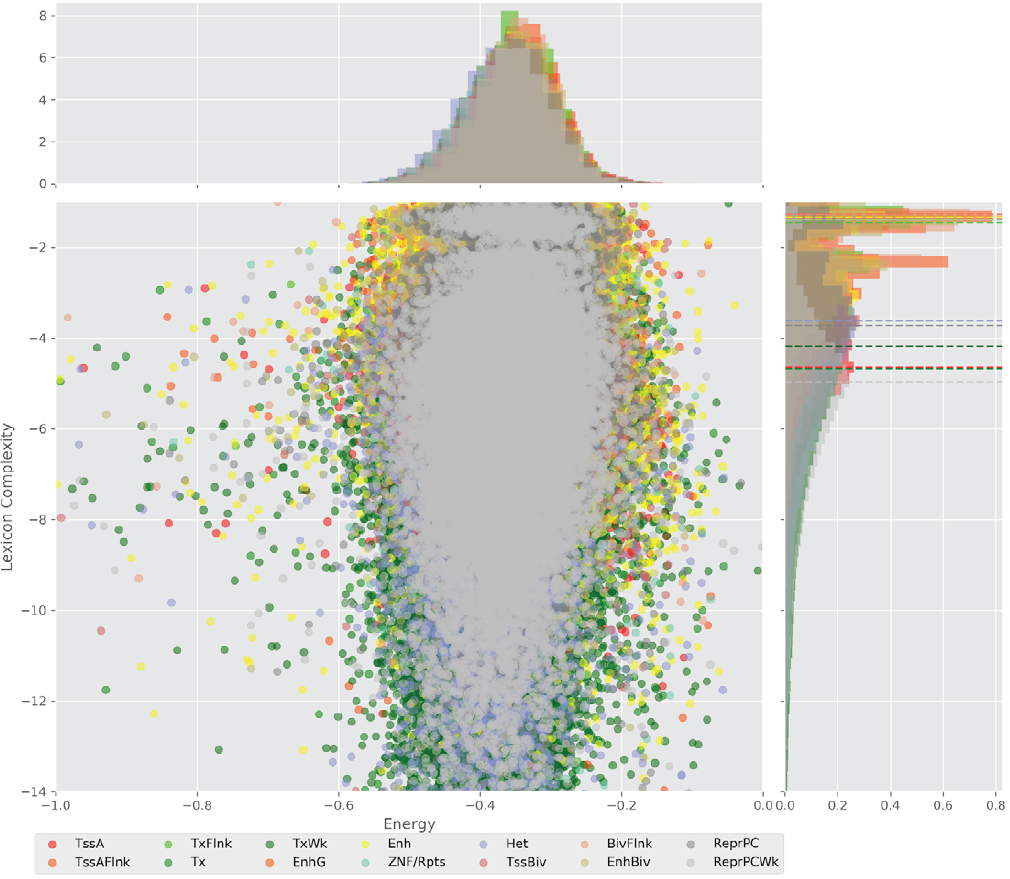
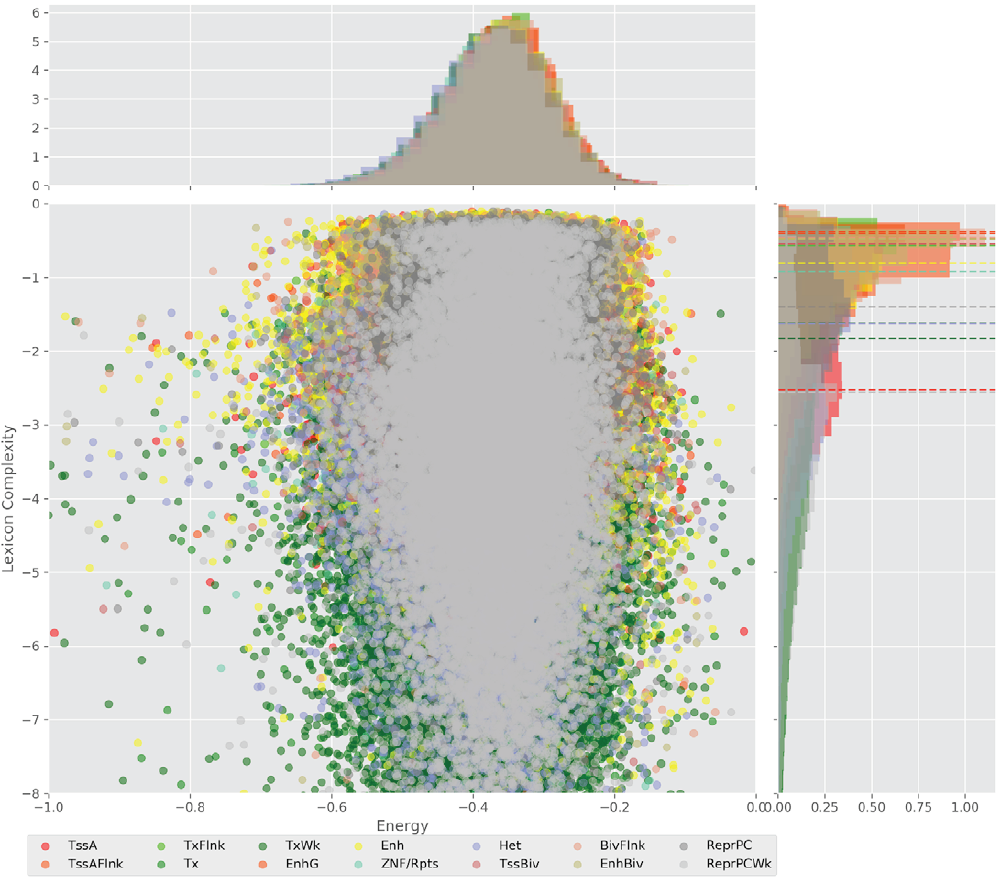
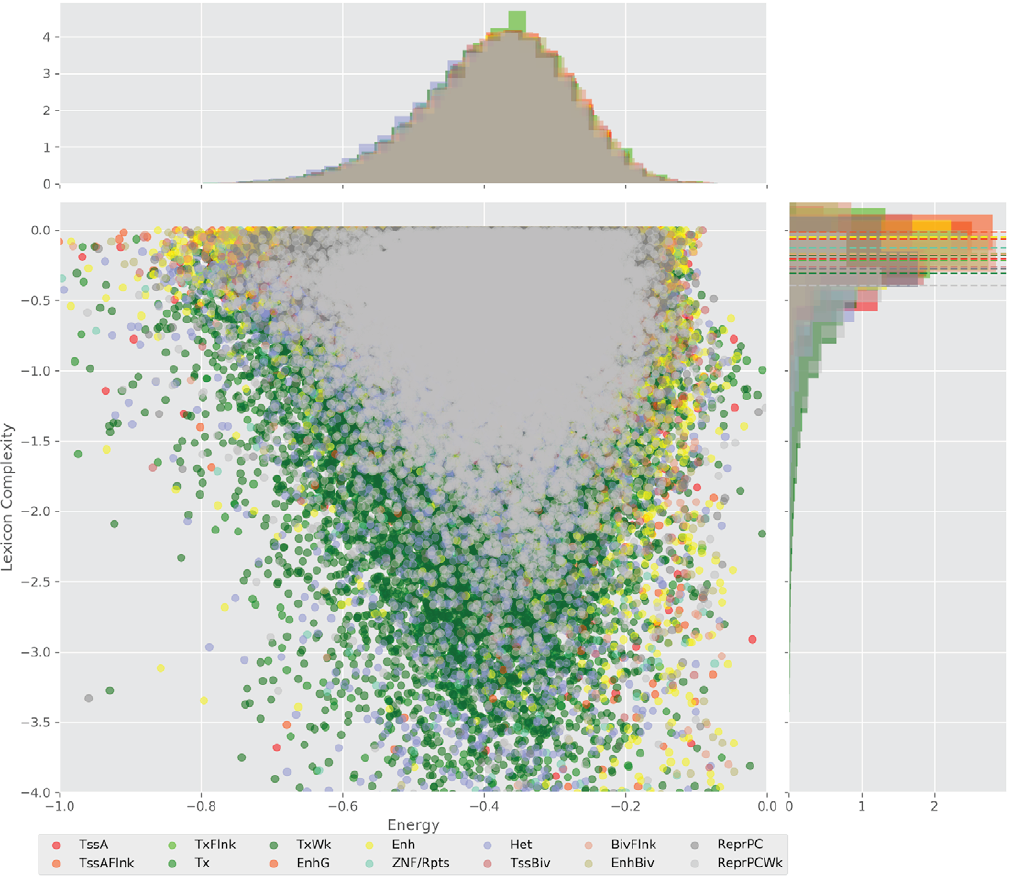
The similar behavior, i. e. different degeneracy values in different regulatory regions, can be observed for k=4, 5, and 7 nucleotides, meanwhile, for the other lengths, the degree of degeneracy tends to be similar for all the regulatory regions. This interesting fact can be explained in the following way: a small word length (1, 2, and 3 nucleotides) enables a brief lexicon and the number of regulatory regions coded would be correspondingly small, while a bigger word length (above 7), leads to a wider vocabulary, and, thus, to an enormous amount of energy needed to maintain the code. On the one hand, it contradicts the less effort principle of nature; on the other hand, a very specific code obtained with the number of signs approximately equal to the number of significances would be easier to “hack” what is a risk for the robustness of an organism.
Although the evidence of different degrees of degeneracy refers to the feasibility of a code for the regulatory sequences, it does not yet indicate that the sequence itself plays a role in the context of the regulatory machinery that determines the cell lines.
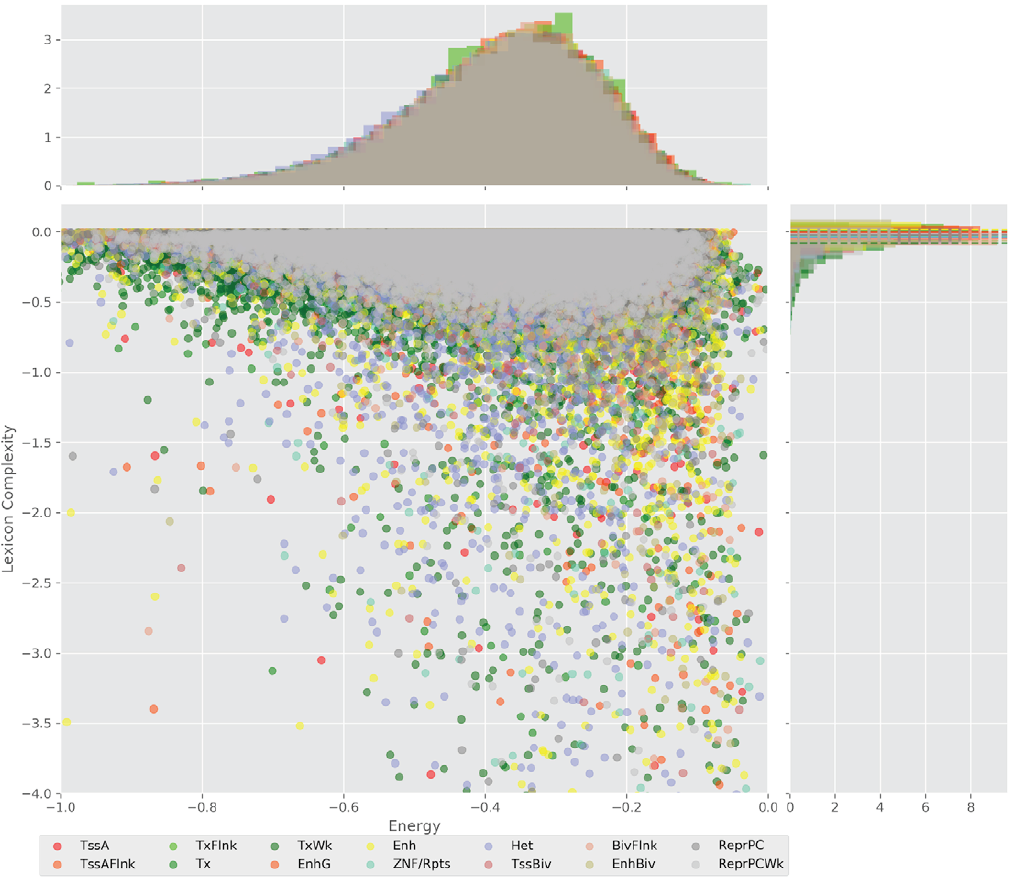
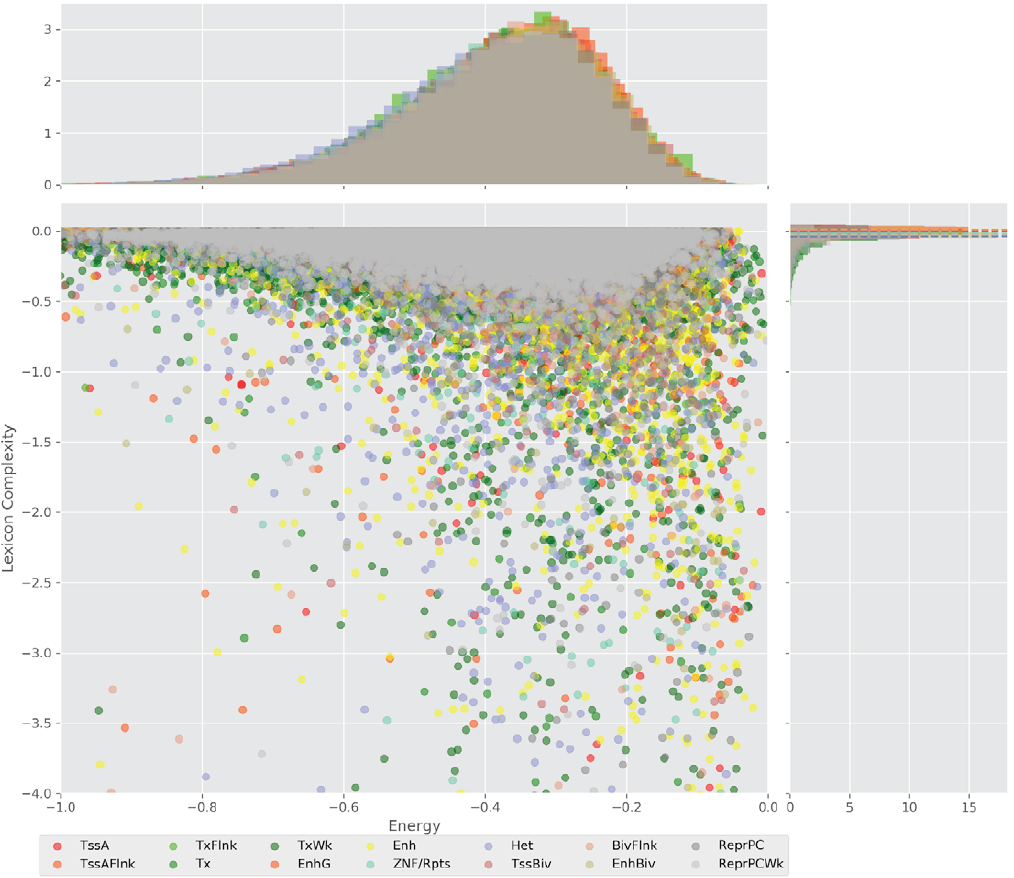
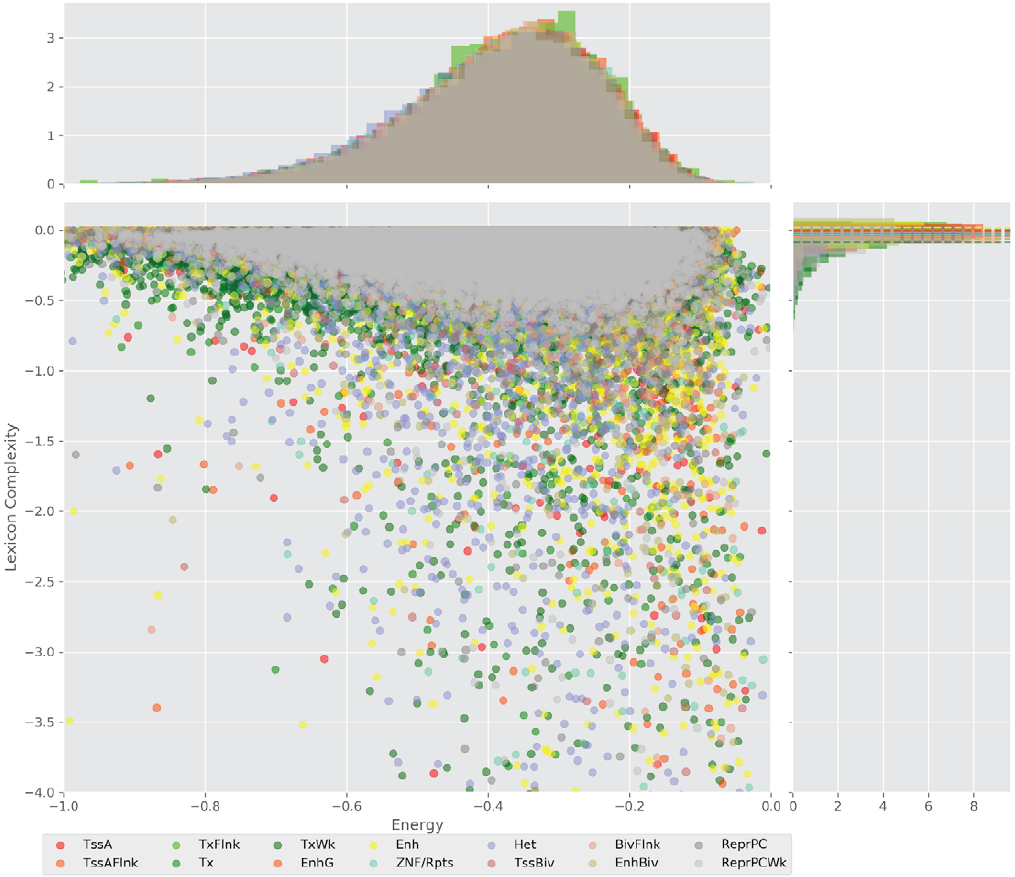
In order to explore the influence of the sequence’s composition, we are comparing lexicon complexities of the five regulatory regions (Flanking active TSS, Enhancer, Heterochromatin, Bivalent enhancer, and Repressed Polycomb) that the Epigenomic Roadmap uses to propose the lineage of the cell lines.
Figure 5 shows value distributions from 3 to 8 lexicon complexities for the three cell lines used in this work. These results present differences between the degree of degeneracy of the regulatory regions of the different cell lines. This is an interesting finding hinting that the sequences could act to establish the regulatory machinery that determines a cell line.
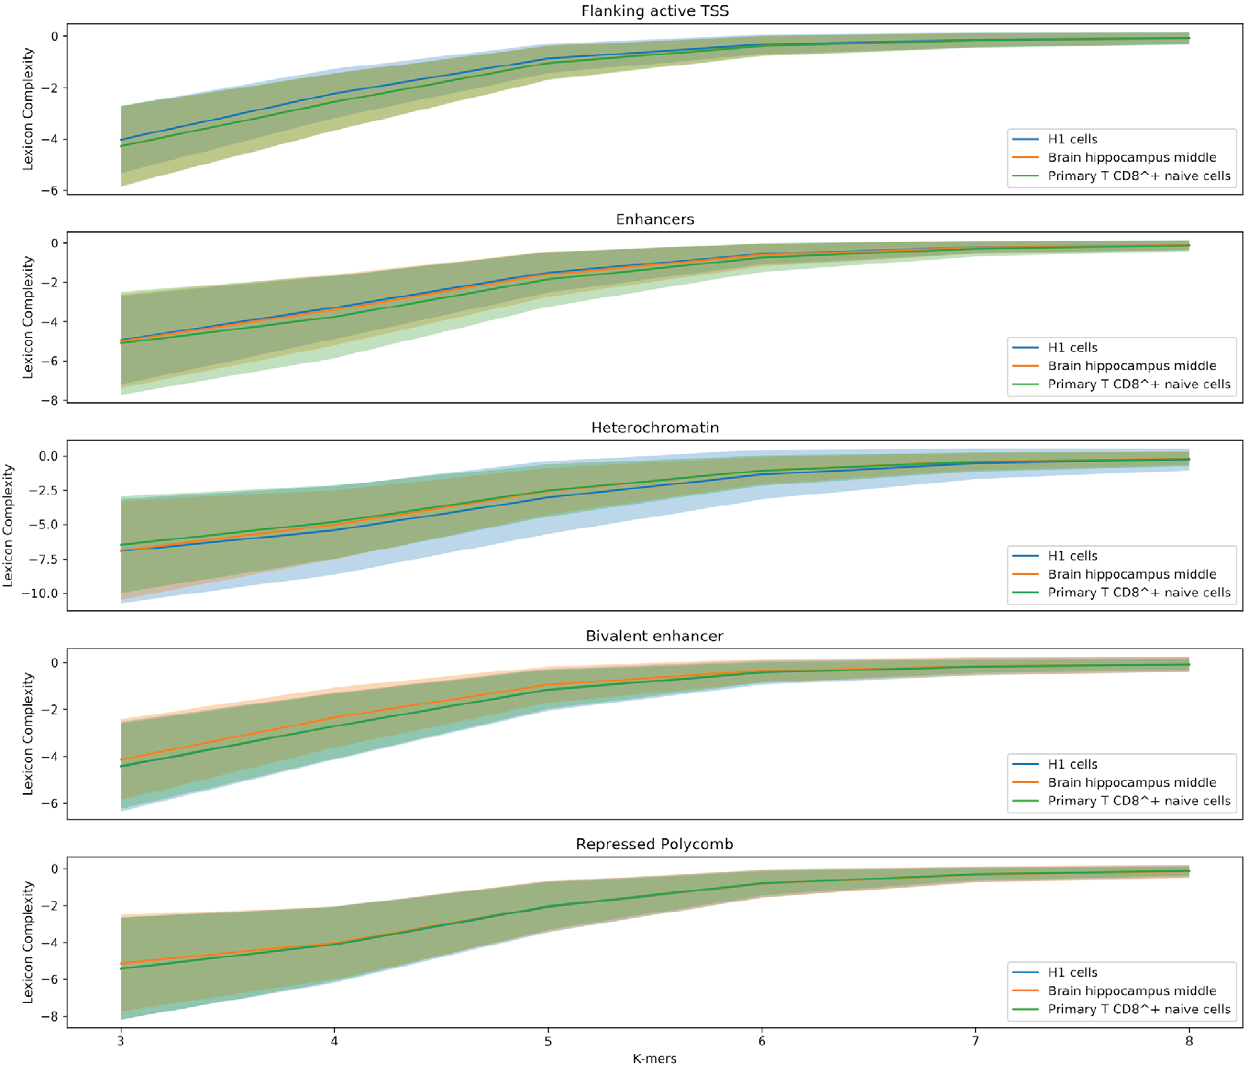
Figure 5. Distribution of the lexicon complexity for the regulatory regions Flanking active TSS, Enhancer, Heterochromatin, Bivalent enhancer and Repressed Polycomb in the cell lines H1 cells, Brain hippocampus middle, and Primary T CD8+ naive cells. The bold line represents the mean value of the lexicon complexity of the sequence in the respective cell line for each regulatory region, while the shadow areas represent the standard deviation of the lexicon complexities values.
Moreover, another notable result is the decreasing deviation of the lexicon complexity when the length of the studied words increases. As stated earlier, a larger length of words enables producing very specific words, meanings, leading to a specialized lexicon. In this context, it is natural thinking that two sequences have to be similar in their biological functionality when sharing a highly specific word.
However, it may be a coincidence and the vocabulary may still not be sufficiently robust for encoding a biological function. Otherwise, in the case of a shorter word length, the generated vocabulary would be narrow and the set of shared words between sequences may contain the whole vocabulary (Figure 6).
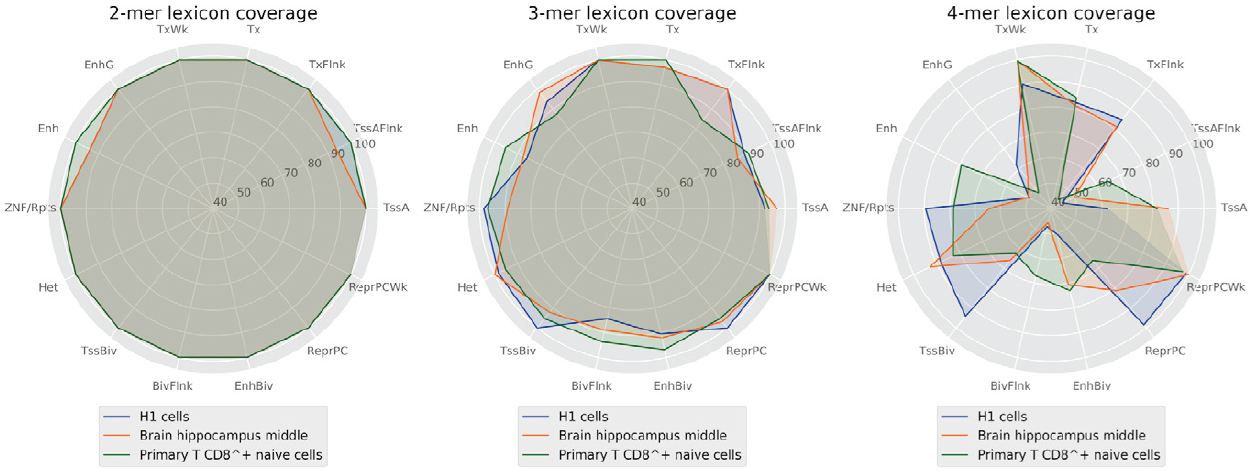
Figure 6. Percentage of words covered by the lexicons between 2 and 4 lengths by regulatory regions.
This likely leads to an ambiguous code and a highly probable regulatory function. At the same time, lexicons with medium words lengths (4 to 6 nucleotides) provide enough word diversity/degeneracy degree relationship to support a robust code that may encode the regulatory function sequences and determine a cell line.
CONCLUSION
The role that non-coding regions plays in DNA sequences is fuzzy due to the diversity and apparent randomness of the sequences. This leads to the notion that these regions are a quiescent part of the genome. However, consortiums as ENCODE, and Epigenomic Roadmap have identified genome regulatory functions in the environment of this part. At the same time, these consortiums do not explore the role of sequences’ composition in the determination of the corresponding regulatory function.
Our results show important differences between the lexica of sequences of regulatory regions. While the potential capacity to encode the biological function is similar for any word length, the suitable range of word lengths is between 4 and 7 nucleotides in order of providing sufficient diversity to support the robustness of a code. This is feasible since the degree of degeneracy in these lexica is high enough for the code not to be ambiguous or highly specialized, i. e. the code is robust enough and, hence, not easy to “hack”. Furthermore, a broader study could identify the specific words, syntax, and the code that establishes the regulatory function in a sequence, and consequently, determines the cell line to be developed, i. a. taking into account the aspect of the noise immunity of the code [31].