


 nueva página del texto (beta)
 Inglés (pdf)
 Artículo en XML
 Referencias del artículo
 Enviar artículo por email
 Citado por SciELO
  Similares en
SciELO
Similares en
SciELO 
 Permalink
INTRODUCTION
One of the most promising techniques for conserving the diversity of genetic resources is ex situ genebank germoplasm collection. A significant effort has been made on a global scale to perserve, characterize, distribute and utilise genetic resource in order to understand their biological phenomena and confront the vulnerable situation regarding the sustainability of future human development [1,2]. As the size of germoplasm colections increase, it becomes difficult to appropriately manage and extensively evaluate them [3]; thus, the core collection (CC) concept [4] has become a fundamental genetic resource management approach and exploits the potential of a complete collection in terms of viable data management and moetary expenses [5-8].
Different CCs have different purposes characteristics and evaluation criteria [7-11]; thus, several different algorithms and informatics tools have been developed and implementend[12-15] with different approaches for satisfying particular needs of each CC. Because these CCs are constructed mainly on the basis of genotypic, phenotypic, passport or geographic data (either by individual datasets or by consensus) [16], there is a lack of all-inclusive datasets; this limits the possibility of generating a CC that may satisfy most basic and applied genetic resource research programs. To the best of our knowledge, no single comprehensive datasets has been properly explored to date.
One possible method to create a comprehensive dataset is to represent the availabe data as numerical values. Several methods exist that represent genomic information into numerical values [17] and agromorphological traits (ATs) into scores[18];. Through this mapping process, treating each data vector as a discrete signal that can, in turn, be analysed by signal processing tools (SPTs) is possible, thus providing and effective tool for a comprehensive evaluation of datasets. We present a proof-of-concept study that shows the possibility of mapping to a discrete signal any type of data available from genetic resource collections in order to take advantage of SPTs for CC selections; this possibility provides new decision-making criteria for genetic resource management and research.
METHODOLOGY
Mapping data
Each input data must be mapped to a numeric value. This is a fundamental process of the algorithm beacause it enable different datasets to be analysed together, regardless of their nature. In this manner, dissimilar passport data, single nuceotide polymorphisms (SNPs), restriction fragment length polymorphisms (RFLPs), geographic information and phenotypical traits can be included in one comprehensive dataset. To consistently represent each data type, reference tables are implemented according to the nature of each particular data: genetic information (originally represented as character elements) is now represented by a numeral vector, and trait variation, simple sequence repeat (SSR) molecular markers and passport data can be represented as either binary or normalized data depending on the quantitative/qualitative nature of the data. The original data and reference tables for this study are available in supplementary material ??. Data transformation for this study rendered a matrix containing the representation of MC samples (i1 , i2 , i3, …, in ) with (j1, j2 , j3, …, jn ) elements each, where n is the total number of samples, and m is the number of included samples characteristics, represented by a numerical values as data(i,j) .
Signal construction
Numerical representations of each jth data element can be treated as frequency values in m data time in such a manner that each ith sample is treated as a discrete signal. The i signal correspond to the information behaviour from each sample. This perspective will enable the implementation of SPTs such as the discrete Fourier transform and power spectrum comparision. Although SPTs can be implemented on all data available for each sample, not all data elements contain the same informativeness value to discriminate between samples. To overcome the informative difference in each j element of data, a principal component analysis (PCA) can be perfomed to rearrange data into a new matrix that has the high informative elements of data at the beginning and that arranges subsequent elements acording to their informativeness, discarding those whose variance equals 0. This process renders two new matrices: the original characteristics mapped vectors matrix (x) and rearranged variance value matrix (X). Matrix X, therefore, contains n samples that are formed by a numerical vector with m=m (non informative characteristics).
Fast Fourier transform
The main objective of Fourier transform is the decomposition of any signal into a complex histogram of frequencies. Signal function is then represented as a vectorial function whose angle and magnitude determine a sampled point in the signal [19].
The original Fourier model is expressed as follows:
where x is the temporal variable, ξ it the frequential variable, i is a -1 square root and e is the natural exponent.
From equation (1), a derivate can be determined for any point ξ sampled in the signal.
Fourier transform can be implemented into any complex numerical series, but in a practical sense, the computational cost increases exponentially.
Thus, fast Fourier transform (FFT) is more often implemented and can be defined according to Cooley-Tukey algorithm [20] as follows:
where N is the vector length, x is the temporal variable, i is a -1 square root and e is the natural exponent; in such matter that an euclidean representation - with the angle, magnitude and phase that corresponds to their position in the signal - exists for any signal dot.
Therefore, mapping any signal into a vectorial representation that contains information from every original signal dot is possible. From this complex vector, useful data can be retrieved to establish a comparison between them that indirectly represents the original signal’s juxtaposition [21].
Distance matrix computation
Inspired by the genomic signal processing alignment-free distance (GAFD) model [22], each signal corresponding to the PCA-mapped accesions data in a set Ŝ i was converted into its frequency representation by applying discrete Fourier transform. Its power spectrum F i was then computed. Subsquently, the distance d(i,j) for a given pair of comprehensive data signal was calculated by obtaining the mean square error (MSE) of their respective power spectra:
Finally, a distance matrix (DM) was created by performing a pairwise comparison of all sequences in the set.
In parallel, we construted a point-to-point (RAW) DM on the basis of the MSE given to a pair of signal prior to the PCA analysis.
Core collection selection
Selecting a CC by this method requires the generation of a DM for each sample of the MC; this provides the interrelations among samples and enables adequate selection. A schematic of the complete workflow is present in Fig. 1

Figure 1. General workflow of the FFT-based core collection selection algorithm. PCA: Principal Component Analysis; FFT: Fast Fourier Transfrom; CC: Core Collection.
In the past, several methodological procedures have been implemented to select K elements from an MC on the basis of information provided by its DM; among such procedures, the most frequently used one is the hierarchical clustering method [11]. However, the current algorithm does not rely on hierarchical clustering for CC selection, instead - similar to the least distance stepwise sampling method [23] - CC elements are selected by an iterative process, where r samples are selected by different criteria (which may be individually implemented) on each iteration.
Selection criteria (based on the MD without hierarchical clustering) for the current algorithm is as follows:
The ith sample with the most lower distance values among jth elements.
The ith sample with the most higher distance values among jth elements.
The ith sample with a lower distance average.
The ith sample with a higher distance average.
The ith sample with a lower overall distance.
The ith sample with a higher overall distance.
In cases where multiple samples share selection values, an appearance priority will complete the criteria.
An example of selection process is present in Fig. 2 and its final result is present in Fig. 3.

Figure 2. First three principal component’s distribution of Rdata (a), methodology’s first (b), second (c) and third (d) iteration; final K=72

Once the selected samples (r) are included in the future CC, they (along with others that are identical to them (s)) are removed from X for the next iteration; then, a DM 2 with n 2 = n - r - s is calculated. This process will continue Z times until R>= K, where R = (r 1 + r 2 + … + r Z ) and K = predefined CC elements desired.
Evaluation of the selected core collection
As discussed previously, the best way to evaluate a CC depends on the purpose of that CC, and eve if it can be evaluated from the same dataset from which it was constructed, evaluating it with a diferent dataset [7] is desirable. In this study, we use other datasets for our evaluation whenever possible.The list given below provides the evaluation parameters implemented in this study.
a. The average distance between each MC sample and the nearest CC sample (ANE) can be calculated using the equation as follows:
where K is all CC elements, k is each CC element and D is the distance between k and each jth cMC element whose closest CC element is k, including itself, thus rendering L total comparisons. The ideal ANE value is 0, where each sample of the CC represents itself and those similar to it. This parameter evaluates the homogeneity of the represented MC diversity.
b. The average distance between each CC sample and the nearest CC sample (ENE) can be calculated using the equation as follows:
where K is all CC elements, k is each CC element and D is the distance between k and its closest CC element cCC, excluding itself, in L total comparisons. With such an evaluation parameter, higher dispersion renders higher scores with the aim of evaluating the dispersion among selected CC elements.
c. The average distance between CC samples (E) can be determined applying the equation as follows:
where K is all CC elements, k is each CC element and D is the distance between k and all other jth CC elements cCC, excluding itself, in L total comparisons. This evaluation parameter indicates higher scores when CC elements have greater distances between themselves.
While previous evaluation parameters are useful for data dispersion analysis, such parameters will not evaluate how well the distribution of the MC is represented on the CC; therefore, the distribution comparisons tests that were included are as follows:
d. The homogeneity test (F - test for variances and t - test for means; α= 0.05) between the CC and MC for each trait can be represented as a percentage of traits that are statistically different (MD for means and VT for variances) [9].
e. The coincidence rate (CR) can be calculated using the equation as follows:
where R is the range of each m trait, and M represents the number of traits.
f. The variable rate (CV) can be calcuated using the equation as follows:
where CV is the coefficient of the variation of each m trait in the CC and MC, and M is the number of traits. According to Hu et al. [10] a valid CC has CR > 80 and MD <20, which are the limits for the ideal representation of the identity and distribution of the MC.
g. The alleles coverage (CA) can be calculated using the equation as follows:
where ACC is a set of alleles in the CC, and AMC is a set of alleles in the MC; ACC meansures the percentage of alleles from the MC that are present in the CC [12].
To compare the obtained CCs with an established methodology, we implemented Core Hunter 2 (CH) [13] as a reference and used it with the program’s default parameters on the agrological and genomic datasets.
Experimental datasets
To determine the efficiency of the analysis of data behaviour by point-to-point direct comparison, a synthetic dataset esa constructed using binary data (Sdata) with manageable n and m elements.
To test the algorithm in real biological-context scenarios, the CCs from different Mcs were constructed and evaluated.
To test the algorithm’s CCs versus the scores of the MCs, 780 rice (Oriza sativa (L.)) accession and 423 foxtail millet (Setaria italica subspitalica (L.) P. Beauv.) accession data were retrieved from the then National Institute of Agrobiological Sciences (now National Agriculture and Food Research Organization [NARO]) http://www.gene.affrc.go.jp/databases_en.php as well as 361 maize (Zea mays (L.)) from the International Maize and Wheat Improvement Center public repository.
According to the available data, different datasets were assembled. The 762 SNPs from the 780 rice accesion retrieved from the NARO database (Rdata) were divided arbitrarly into two subsets of 331 SNPs each for constructing two smaller datasets (RdataI and RdataIII). In addition, ATs were categorized and mapped into the binary data for 273 of the 780 accessions, resulting in 38 variables (RdataII). The variables from 423 foxtail millet genotypes with transposon displays [24] were used as a single dataset (Fdata). For a subset of 141 accessions (FdataI), 9 ATs were categorized and mapped into binary data, resulting in 28 variables (FdataII). The maize available information was mapped into 0-1 values (Mdata). The substitution tables used during this mapping are presented as supplementary material 1.
Implementation
All procedures were implemented in python 3.6, codes are available as supplementary material 2.
A graphical interface was developed including a SQLite3 database (https://sqlitebrowser.org/) in order to store data for future comparison and further analysis. This implementation includes a previously described K-means based CC selection algorithm [25].
RESULTS AND DISCUSSION
Selection and evaluation
The selection criteria were chosen to look for the best possible distribution of selected CC elements within the DM. Although hierarchical clustering has proven to be an effective method for determining collection structure and sampling CC [26] and although it has been implemented in different crop[27,28] and included in various selection algortihms [11], hierarchical reconstruction presents the challenge of selecting an appropriate model for biological interpretation that can be applied to everything from unweighted pair-group averages to Markov models in Bayesian estimations [29]. To avoid the challenge of selecting a reconstruction model, we decided to work strictly with the DM. By selecting the items described in this methodology, we aimed to retrieve representative elements from among the distributions of collections; however, because of its iterative nature, this methodology may render high redundancy under certain data distributions. Despite this limitation, the methodology has proven to be capable of selecting representative elements of the MC’s diversity.
Evaluation criteria were applied according to Odong et al. [7] without excluding the classic criteria used in [9,10]. The selected CCs render proper results in general terms. As expected, selected CCs did not always reach for optimal values for MD and CR, this is due the fact that it is not the aim of the selection method to render a CC with similar distribution to that of the MC, but to make sure to include as much diversity as possible.
It is our belief that scoring the CC sets obtained with these methodologies will enable genetic resource banks to provide clear descriptors of what their CC strengths and limitations are with respect to the MC from which they come and will provide adequate tools for determining the possible purposes of the selected CCs.
Although several representations of genotypic characteristics (particulary those involving DNA sequences [30-32]) have been proposed, real-number-based mappings have not been discarded, indeed, this type of mapping has been highly studied for signal analysis even when they share two principal problems: the preferential magnitude of some nucleotides and the non-equidistance of all nucleotides [33,34]. The arbitrary values selected for SNP’s numerical representation of genotypes aim to maintain equidistance relations among purines and among pyrimidines in such a manner that the same distance is also perserved between at least one of them and the undetermined values. ATs are represented as binary data. This representation may prove useful for discrete data but requires a clustering procedure for continuous data. In this study, we arbitrarily generated clusters for the latter and then represented them as the former. Although this implementation may no be the most accurate regarding biological or agronomical significance, it serves as the first approach for testing the feasibility of the use of signal processing techniques when merging several datasets to construct one CC.
RAW versus FFT
The RAW comparison establishes a distance value on the basis of the average distance between each mapped value on each element while the FFT power spectra implementation compares the signals in the frequency domain. Using FFT, establishing a DM on the basis of how data ‘shifted’ rather than on the basis of average point-to-point comparisons was possible. The FFT approach provides a different DM, where its compared elements are clustered based on the similarity of the shift is in the opposite phase. We expect that the procedure reveal more info about the relations between the individual components within each element.
FFT comparisons of signal without PCA are a good approach for CC selection. Nervertheless, PCA implementation enables us to avoid possible misleads in random data arrangements, as, for example, palindromic data that could result in the same power spectra. Moreover, through PCA, we could organize data according to their levels of impact on the difference between accessions, which --when their magnitudes were obtained-- inherently rendered a representation of informativity relations among values. This ‘data behaviour’ was used as the element for pairwise comparisons, and although this approach clusters differently from RAW comparisons, we belive that it will provide a new perspective for CC selection and open the possibility of further data exploration.
Our first approach was to measure the comparisons under different K values. We compared the approach of the RAW signals whit the PCA-FFT- treated signals. Results from Sdata, Fdata, and Rdata are presented in Tables 1-3. As expected most evaluation criteria improved as K increased.
Table 1. K selected CC scores from MC Sdata Raw and PCA Signal evaluated with Sdata
| Sdata PCA | Sdata RAW | |||||
|---|---|---|---|---|---|---|
| K | 12 | 18 | 24 | 12 | 18 | 24 |
| ANE | 0.2348 | 0.2311 | 0.2164 | 0.2697 | 0.2287 | 0.2164 |
| ENE | 0.339 | 0.3386 | 0.3401 | 0.3696 | 0.3228 | 0.3214 |
| E | 0.5562 | 0.5622 | 0.5547 | 0.5558 | 0.5333 | 0.5299 |
| MD | 0 | 0 | 0 | 0 | 0 | 0 |
| VT | 41.6667 | 50 | 41.6667 | 33.3333 | 58.3333 | 41.6667 |
| CR | 64.8403 | 71.6918 | 73.7154 | 60.6447 | 75.2465 | 80.4716 |
| CV | 9080.798 | 61.2074 | 86.0876 | 136.6446 | 139.1418 | 280.8481 |
| AR | 74.3363 | 81.4159 | 89.3805 | 61.9469 | 77.8761 | 80.531 |
Table 2. K selected CC scores from MC Fdata Raw and PCA signal evaluate with Fdata
| Edata PCA | Edata RAW | |||||
|---|---|---|---|---|---|---|
| K | 48 | 72 | 96 | 48 | 72 | 96 |
| ANE | 0.6454 | 0.6423 | 0.6407 | 0.6489 | 0.6431 | 0.643 |
| ENE | 0.646 | 0.6472 | 0.6472 | 0.65 | 0.6448 | 0.6452 |
| E | 0.7297 | 0.7301 | 0.7301 | 0.7231 | 0.7236 | 0.7239 |
| MD | 1.1799 | 0.59 | 0.59 | 1.7699 | 1.4749 | 1.4749 |
| VT | 50.4425 | 53.6873 | 56.6372 | 50.7375 | 56.0472 | 55.1622 |
| CR | 83.6883 | 87.0605 | 88.9709 | 83.5334 | 86.9308 | 87.7461 |
| CV | 0.8494 | 0.419 | 0.7357 | 1.1037 | 4.74 | 0.7361 |
| VA | 96.3945 | 97.7652 | 98.5995 | 95.3516 | 97.497 | 97.4374 |
Table 3. K selected CC scores from MC Rdata Raw and PCA Signal evaluated with Rdata
| Rdata PCA | Rdata RAW | |||||
|---|---|---|---|---|---|---|
| K | 48 | 96 | 156 | 48 | 96 | 156 |
| ANE | 0.6013 | 0.5966 | 0.5942 | 0.6118 | 0.6052 | 0.6042 |
| ENE | 0.5939 | 0.5944 | 0.5981 | 0.6106 | 0.6085 | 0.609 |
| E | 0.7105 | 0.7074 | 0.7051 | 0.703 | 0.7038 | 0.7054 |
| MD | 9.1146 | 5.9896 | 3.9062 | 10.1562 | 5.4688 | 4.4271 |
| VT | 42.4479 | 48.6979 | 58.0729 | 57.5521 | 72.9167 | 70.0521 |
| CR | 70.5716 | 78.477 | 83.2957 | 69.9022 | 78.1045 | 80.0167 |
| CV | 1.0171 | 0.4343 | 0.3137 | 7.9407 | 0.4375 | 1.1344 |
| VA | 92.6758 | 96.8992 | 98.5298 | 93.9856 | 98.1823 | 98.5031 |
The use of FFT signals renders better overall scores than use of RAW signal in Sdata and Fdata; however, this advantage diminishes in Rdata. We speculate that this difference can be explained by the mapping procedures used; further research regarding this matter is ecouraged.
Using the CH’s rendered K values, we used both CH and FFT to generate the CCs is summarized in Table 4 and in Figs 4-5. Both methodologies rendered similar results, yet PCA rendered better results on parameters representing MC distribution; this could be an effect of the selection method’s intrinsic redundancy.
Table 4. CCs selected from MC Sdata, Fdata and Rdata using PCA signals and Core Hunter compared with respective same data
| Sdata | Fdata | Rdata | ||||
|---|---|---|---|---|---|---|
| PCA | PCA | PCA | ||||
| CH | CH | CH | ||||
| K | 12 | 84 | 156 | |||
| ANE | 0.2348 | 0.2314 | 0.6407 | 0.6392 | 0.5942 | 0.5952 |
| ENE | 0.339 | 0.3906 | 0.6474 | 0.6386 | 0.5981 | 0.6047 |
| E | 0.5562 | 0.563 | 0.7304 | 0.7176 | 0.7051 | 0.7017 |
| MD | 0 | 0 | 0.59 | 1.1799 | 3.9062 | 5.4688 |
| VT | 41.6667 | 58.3333 | 56.6372 | 66.6667 | 58.0729 | 86.7188 |
| CR | 65.6045 | 76.1001 | 88.9709 | 93.0119 | 83.2957 | 89.6723 |
| CV | 9080.978 | 132.6078 | 0.7357 | 0.429 | 0.3137 | 0.4001 |
| AR | 74.3363 | 76.9912 | 98.5995 | 98.4803 | 98.5298 | 99.3852 |
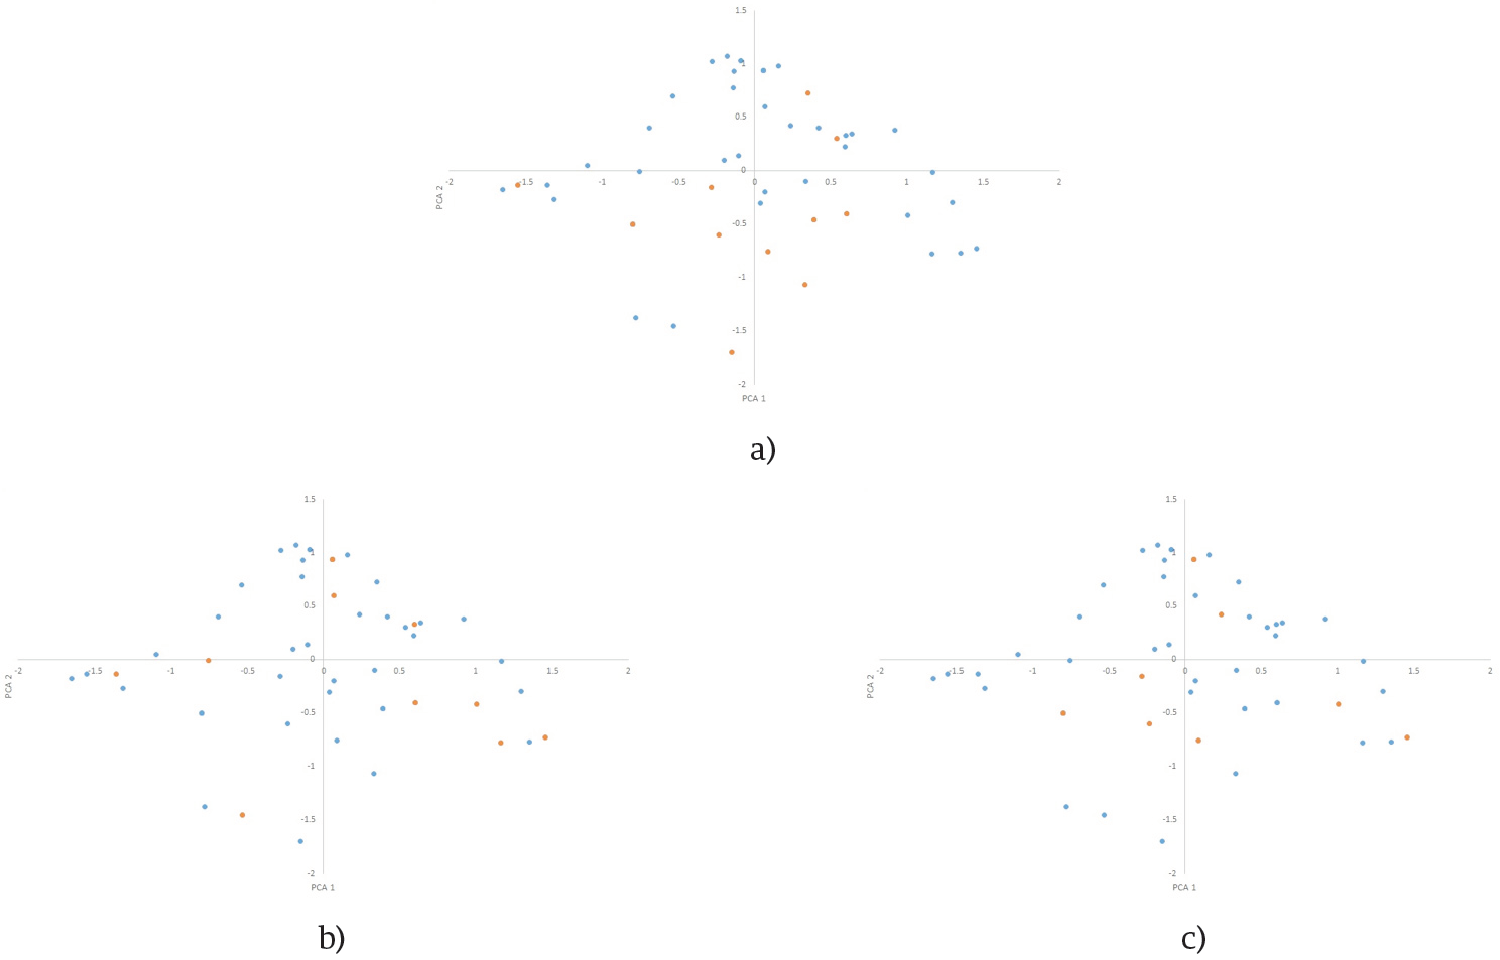
Figure 4. First two principal component’s distributions of k=11 CC (orange) selected by CH(a), PCA(b) and RAW (c) in Sdata distribution (blue).
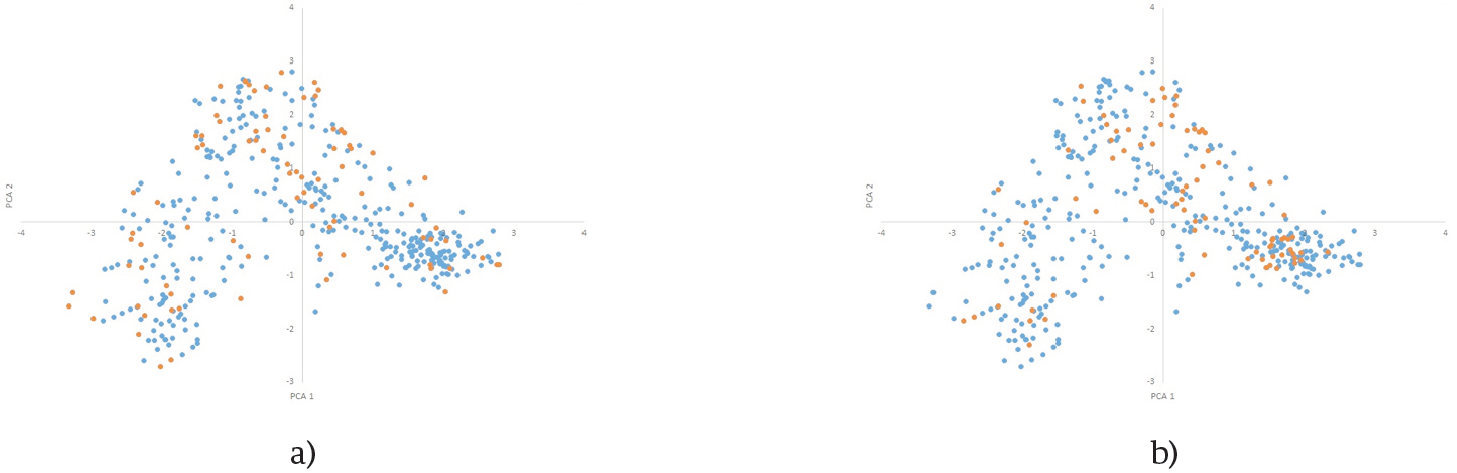
Figure 5. First two principal component's dristibutions of k=84 CC (orange) selected by CH(a) and PCA(b) in Fdata distribution (blue).
To further this concept, we analized maize data with both K-means and FFT implementation, in order to both contrast with a differt approach and test the interfase. The results are presented in Fig 6.
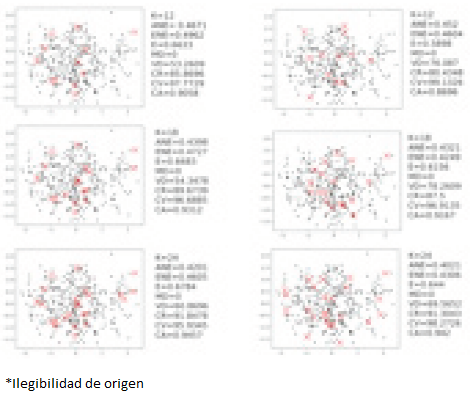
Figure 6. First two principal component’s distributions of k=12 CC (up), k=18 CC (center) and k=24 CC (bottom); selected by FFT (left) and K-means (right) with their respective evaluation values. Black dots correspond to the complete maize set, while red X represent selected elements for CC.
Thus far, the proposed CC selection method and algorithm appear worthy of further exploration. We are aware that two particular fundamental elements require immediate attention. First, a better mapping solution for both genotypic and AT numerical representation needs to be determined. Second, the selection system developed by us is directly based on the DM and is prone to high redundancy in some data distributions. As discussed earlier, this selection system was chosen in order to avoid the problems associated with hierarchical clustering and further allocation selections [13,35]. Both issues should be addressed in the near future.
Comprehensive data analysis
To demonstrate thet FFT-based CC selection can include and analyse data regardless of its origin, we concatenated corresponding signals from FdataI whit FdataII as well as RdataI and RdaraIII with RdataII to construct Mfdata, MRdataI and MRdataIII. The comprehensive sts were used to construct CCs; the sets were then compared with both their orginal genotype and phenotype MCs. These comparisons are shown in Tables 5-8, and their distributions are represented in Fig. 7-10.
Table 5. CCs selected from MC FdataI and MC MFdata PCA signals and evaluated with FdataI and FdataII
| vs EdataI | vs EdataII | |||
|---|---|---|---|---|
| FdataI | MFdata | FdataII | MFdata | |
| K | 24 | |||
| ANE | 0.6333 | 0.6356 | 0.4049 | 0.4093 |
| ENE | 0.6413 | 0.6423 | 0.4374 | 0.4351 |
| E | 0.7194 | 0.7113 | 0.623 | 0.5914 |
| MD | 1.7668 | 2.4735 | 0 | 0 |
| VT | 66.0777 | 33.9223 | 46.42 | 64.2857 |
| CR | 89.4908 | 89.8198 | 80.677 | 82.1913 |
| CV | 45.7033 | 35.6847 | 21.8658 | 132.1517 |
| AR | 86.5097 | 92.7206 | 97.5904 | 94.3775 |
Table 6. CCs selected from MC RdataI , MrdataI, RdataIII and MRdataIII PCA signals and evaluated with RdataI
| vs RData | ||||
|---|---|---|---|---|
| RdataI | MRdataI | RdataIII | MRdataIII | |
| K | 24 | |||
| ANE | 0.6148 | 0.6156 | 0.6251 | 0.6169 |
| ENE | 0.5989 | 0.6107 | 0.621 | 0.6194 |
| E | 0.6962 | 0.6909 | 0.6985 | 0.6934 |
| MD | 8.8542 | 8.5938 | 7.2917 | 6.7708 |
| VT | 52.0833 | 63.5417 | 52.0833 | 53.3854 |
| CR | 80.7367 | 83.768 | 81.7278 | 81.8623 |
| CV | 56.3949 | 59.6279 | 45.6875 | 199.9377 |
| AR | 86.5097 | 88.144 | 86.5651 | 90.7202 |
Table 7. CCs selected from MC RdataI, MRdataI, RdataIII and MRdataIII PCA signals and evaluated with RdataIII
| vs RDataIII | ||||
|---|---|---|---|---|
| RdataI | MRdataI | RdataIII | MRdataIII | |
| K | 24 | |||
| ANE | 0.6285 | 0.6276 | 0.6314 | 0.623 |
| ENE | 0.6273 | 0.6294 | 0.6368 | 0.6267 |
| E | 0.7036 | 0.7054 | 0.7226 | 0.7056 |
| MD | 8.0729 | 7.5521 | 7.2917 | 10.4167 |
| VT | 52.8646 | 60.6771 | 51.5625 | 46.875 |
| CR | 79.5995 | 81.0356 | 79.6809 | 84.53 |
| CV | 28.3673 | 56.3689 | 90.0475 | 60.7279 |
| AR | 88.9071 | 88.7705 | 87.5956 | 93.0471 |
Table 8. CCs selected from MC FdataI and MC MFdata PCA signals and evaluated with FdataI and FdataII
| vs RDataII | |||
|---|---|---|---|
| RdataII | MRdataI | RdataIII | |
| K | 24 | ||
| ANE | 0.4594 | 0.4652 | 0.4618 |
| ENE | 0.4796 | 0.4896 | 0.4742 |
| E | 0.6402 | 0.6205 | 0.6169 |
| MD | 0 | 5.2632 | 0 |
| VT | 39.4737 | 42.1053 | 60.5263 |
| CR | 63.8082 | 61.8988 | 68.2437 |
| CV | 3.8262 | 2.2285 | 4.1332 |
| AR | 95.4268 | 98.7805 | 98.7805 |

Figure 7. First two principal component’s distributions of k=24 CC (orange) selected by PCA from Fdata(a) and Mdata(b) in FdataI distribution (blue).

Figure 8. First two principal component’s distributions of k=24 CC (orange) selected by PCA from FdataII(a) and Mdata(b) in FdataII.

Figure 9. First two principal component’s distributions of k=24 CC (orange) selected by PCA from RdataIII (a) and MdataIII (b) in RdataI distribution (blue).
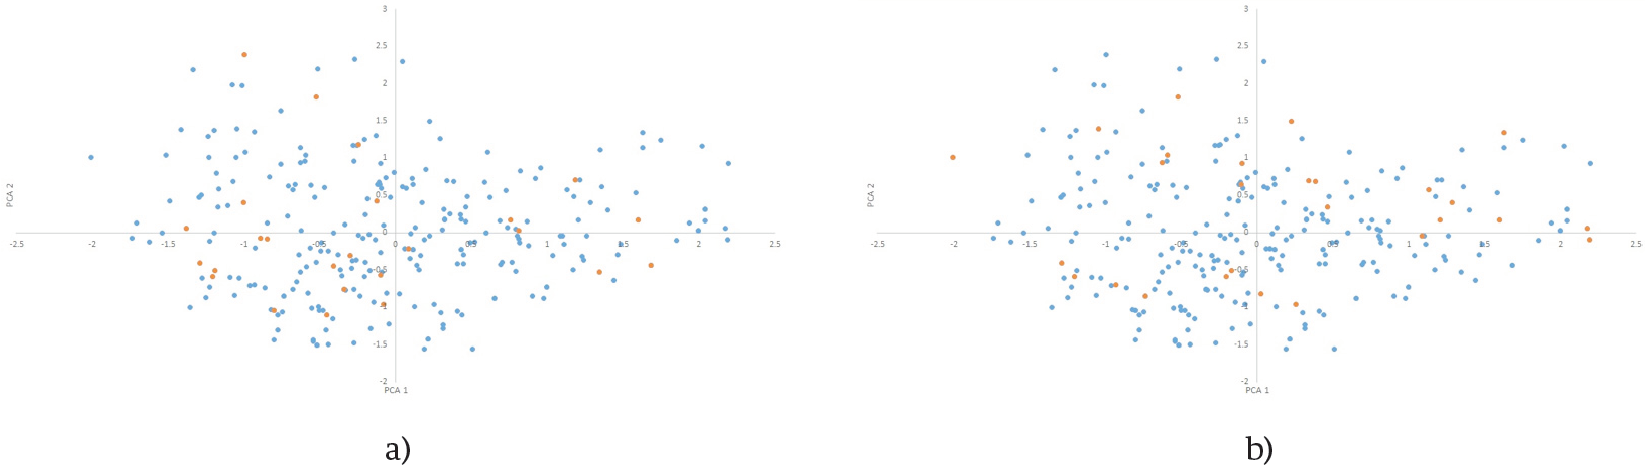
Figure 10. First two principal component’s distributions of k=24 CC (orange) selected by PCA from RdataII (a) and MRDataI (b) in RdataII distribution (blue).
These comprehensive CCs showed overall better scores than genotypic-only CCs when compared with genotypic-only data. On the contrary, there was a better overall score in phenotypic-only CCs when compared against phenotypic-only data.
In the latter case, it should be kept in mind that comprehensive data also consider genotypic data; this could explain why better selections are made when only phenotypic data are considered because genotypic variations may reduce the impact of some phenotypic traits in the PCA analysis.
The generation of a DM based on signal comparisons originating from mixed data construction enables us to explore one of the most interesting applications of this algorithm. By mapping genotypic and AT data, constructing a single signal with all data avaliable for a particular accession is possible. The possibility of including genotypic data with phenotypic traits, geographical locations, climates, habitats, nutritional requirements, symbiotic relationships and so forth provides an opportunity for determining the best information to be included in the selection process in order to cope with the particular objectives for which that CC is beging selected. This concept, in addition to adequate scoring systems, may prove useful in designing tailored CCs that comply with specific research/ breeding objetive.
CONCLUSIONS
The use of SPTs in CC selection, as presented in this algorithm, enables us to analyse all avaliable data comprehensively and from different perspectives. Despite its limitations, this signal construction make it possible to analyse all avaliable data regarding each accesion in CC selection with good results.
The efficiency of SPTs in CC selection sugests that the use of these tools in MC analysis may provide useful information not only for CC but also for other purposes.
The implementation of current and other SPTs in all-inclusive MC-mapped signals is worth further exploration, and we belive that it will be an important asset to genentic resource management and exploitation.

