


 nueva página del texto (beta)
 Inglés (pdf)
 Artículo en XML
 Referencias del artículo
 Enviar artículo por email
 Citado por SciELO
  Similares en
SciELO
Similares en
SciELO 
 Permalink
INTRODUCTION
There are over 200 different types of arthritis [1]. Two of the most common types are osteoarthritis and rheumatoid arthritis [2]. Nowadays, Osteoarthritis (OA) is the most common representative of arthritis, and a growing disease in the industrialized world. Lifestyle and habits appear to be the cause of increasing cases of OA [3-5]. This disabling disease conducts poor quality of life to patients, becoming the quotidian activities into painful tasks. This disorder affects at least 1 in 10 adults advanced in over 60 years, in the United States, and is classified between the principal causes of medical attention requests [6-8].
Due to its simplicity and broad base deployment, X-ray medical imaging is a primary diagnose technique used on staging OA [9]. Expert radiologists evaluate radiological evidence of x-ray images using several radiological methods to establish this stage, some bony changes such like the emergence of osteophytes, anatomical changes or joint space narrowing (JSN) are the main features observed to perform this task [9]. This radiological features have not been fully studied in association with the most common symptoms; pain and stiffness [10,11]. Correlate radiological evidence, and a subjective late onset symptom as pain, is one of the biggest challenges in OA.
Associations create information between the disorder and its behavior looking for treatments or therapies for OA. The Osteoarthritis Initiative (OAI) efffort are bringing information that will allow to comprend the disease behavior. OAI has collected a big quantity of clinical data from OA patients, subjects with probably risk, and control subjects under validated tests and standardized image assessment procedures.
Early diagnosis is key to treat the symptoms and the treat the advance of the disease. Looking for a better explanation of the pain as a complex symptom OA researchers has developed different clinical tests as KOOS and WOMAC[12-15], and some atlas based on image evaluation [16]. There are methods such as KellgrenLawrence (K & L) or the OARSI grading scale [17] that are part of the radiological evaluation on images, these methods depend on trained radiologist and human criteria to determine stage and a path of action [18,19].
Using bilateral x-ray images of knees from the open databases OAI, the objective of this search is to correlate measures obtained in an automated way with knee chronic pain as the principal symptom, through computational algorithms. Through recent image registration approaches [20], three well known measures of similarity between knees are obtained: mutual information [21], correlation [22], and mean squared error [22]. In a previous effort [23], these measures were explored as a tool for association with K & L, one of the most used OA grading tools. In a preliminary work, a small group of patients was used to explore the association between the K & L scale and the error metrics between the recorded images, that work suggested that there could be a relationship that is dealt with more broadly here [24].
Being chronic pain a late onset symptom, the use of said measures as a risk factor may help to develop a rapid diagnosis and a better treatment option. In this work, the association between the automated measures and chronic knee pain is studied. Three different time points are explored, the time of baseline visit, a year after enrollment and two years after enrollment. The three measures in multivariate predictive models are explored, and the most significate variable in a univariate predictive model is studied.
The results suggest a close relationship between measures from image registration and chronic pain in all time points analyzed. All multivariate models using all measures were predictive. Mutual information as a univariate model obtained a better performance predicting pain in two studied time points. Also, mutual information maintains the relationship whit K & L in all time points studied.
The main objective of this work is to have a first contact with the use of registration tools for the early detection of osteoarthritis of the knee, as already analyzed in previous works, the radiological evidence evaluated by experts, determine that small changes in the structure of the bone, are risk factors that can be associated with the development of chronic knee pain. That is why the measure of asymmetry becomes relevant, since as it has been reported, the disease appears with greater intensity in one of the patient's knees. The hypothesis is that the greater the error in the registry, the greater the deformation in one of the knees.
This paper is organized as follows; after Introduction, the Materials and Methods are explained, in Image segmentation subsection, the process of the automated segmentation of the knees is presented, in Image registration subsection, the registration of the left knee into the right knee is explained, in Metric quantification subsection, the equations for the measures extraction are exposed. In the Results and Discussion section, the ROC curves with the numerical results are presented, finally, the Conclusion.
MATERIALS AND METHODS
On this study population: Data used in the preparation of this article were obtained from the Osteoarthritis Initiative (OAI) database, which is available for public access at http://www.oai.ucsf.edu/datarelease/.
Being a pain prediction study, the chronic pain was defined as the variable to look at. A cohort of 131 patients is used in this study; all patients should have the baseline radiological study, and complete chronic pain information. The selection criteria for the cohort were:
Control patients were selected according to the criteria of:
No clinical symptoms of knee pain, from baseline to 60-month follow-up,
No symptomatic clinical OAI data, from baseline to 60-month follow-up;
No analgesic NSAID intake, from baseline to 60-month follow-up.
Patients were selected according to the criteria of:
No clinical symptoms of knee pain at the initial visit;
No analgesic NSAID intake at the reference visit;
Clinical symptomatic manifestation of chronic pain in the right knee, at any time after the reference visit until the 60-month follow-up.
Demographic information and statistical details of the cohort are presented as follows: the total of patients (F) were 131 (78), with an age range (S.D.) of 45-79 (10.41), an average height of 1678.15 (86.10) and an average BMI (S.D) of 29.48 (5.11). From the total of patients, 38 (15) were controls, with an age range of 45-78 (10.9), an average height of 1711.59 (82.71) and an average BMI of 28.19 (3.78). The rest of the patients, 93 (63), were cases, with an age range of 45-79 (10.29), an average height of 1663.43 (83.22) and an average BMI of 30.04 (5.55).
In this analysis, images and databases from OAI used are: OAI is a multi-center, longitudinal, prospective observational study of knee OA. The OAI will establish and maintain a natural history database for osteoarthritis that will include clinical evaluation data, radiological (x-ray and magnetic resonance) images, and a bio-specimen repository from 4796 men and women aged between 45 and 79 years old, enrolled between February 2004 and May 2006”).
Bilateral knee x-ray images (contains bilateral fixed-flexion knee radiographs).
JointSx00 ver 0.2.2 (contain questionnaire results regarding arthritis symptoms in the knee; arthritis-related joint function and disability; and general health-related function and disability in the baseline).
JointSx01 ver 1.2.1 (contain questionnaire results regarding arthritis symptoms in the knee; arthritis-related joint function and disability; and general health-related function and disability in the 12-month visit).
JointSx02 ver 2.2.2 (contain questionnaire results regarding arthritis symptoms in the knee; arthritis-related joint function and disability; and general health-related function and disability in the 24-month visit).
kXR_SQ_BU00_SAS ver 0.7 (contains central longitudinal readings of serial knee X-rays for tibiofemoral radiographic OA in the baseline).
kXR_SQ_BU01_SAS ver 1.7 (contains central longitudinal readings of serial knee X-rays for tibiofemoral radiographic OA in the 12-month visit).
kXR_SQ_BU03_SAS ver 3.6 (contains central longitudinal readings of serial knee X-rays for tibiofemoral radiographic OA in the 24-month visit).
“Right knee symptom status” (combines past thirty days and twleve months, used in OAI definition of sympthomatic knee OA).
All K & L scores were assessed by OAI Boston University radiologist group using the standard atlas for OA [25,26].
In the bilateral images used for this work, left and right knees are presented side by side. Per the high dynamism of the knees, a direct comparison between left and right knees images cannot be realized truthful. Therefore, before the analysis an alignment of the images must be performed.
The principal steps that were done in methodology:
The images of the patient’s knees are segmented to delete undesired information,
The left knee is aligned/registered to the right knee,
An evaluation of the similarity measures is computed looking for the relationship between the degree of similarity in both knees and the disease phases.
Prior to image registration process, each image was manually preprocessed. By the registration process, in each image the region of interest (ROI) was attached to avoid regions without meaningful information. In Figure 1 from the input image the ROI is delimited by a yellow rectangle.
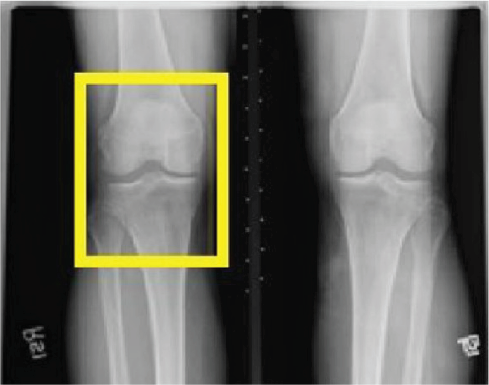
In the process of ROI adjustment in each of the x-ray images, was generated an individual image for rights and lefts knees, afterwards, each image of the left knee was reflected around the vertical axis to allow the image registration procedure, finally, each pixel of the image is submitted to a logarithmic transformation to improve the low intensity pixels [27,28].
Image segmentation
The background noise and artifacts of the x-ray images were eliminated by a method of automated segmentation. By this method is created a segmentation mask, then, the mask dismissed those pixels under five level deviations based on the noise level of the images. The segmentation in based to the mask abstracts the knee bones structure and dismisses the background. Finally, the region that was the largest connected on the image was subjected to a hole filling algorithm, based on dilatation and erosion, according to the morphological functions to assure a solid surface abstraction, using a 3x3 supporting región, as defined in Equation 1:
Where
Image registration
The procedure of the left knee image registration into the right knee was performed based on the segmentation mask. Initially, the left knee image was reflected and then co-registered with the image of the right knee corresponding. An algorithm of B-Spline multi resolution had the purpose of optimizing the Mattes mutual data measures in the bilateral image registration [29,30]. Then, a deformable B-Spline transform was used, this process based its function in the transformation of an image adjusting control points of a net in base on a similarity measure maximization, this method usually avoids local minimal in the parameter search space and decreases computational time [31,32].
By the multi resolution method used, all images were registered in the lowest resolution. In the near steps, the transformation parameters are scaled to the higher resolutions and is calculated again the parameter optimization. Fort he 2D images that are involved in this study, B-splines can be modeled by the tensor product of the 1D cubic B-splines. A 2D rigid transformation can be represented as in Equation 2, where rp represents the x and y coordinates of the pth pixel and d(rp ) the deformation it suffers.
The 2D deformation was modeled using the tensor product of β, represented as d(rp ) = <dx (rp ), d y (rp )> using the tensor product of β, the nth-order B-splines, as follows in Equation 3:
Where dq
(rp) represents the deformation
of the pth pixel in the qth axis plane
(x or y), c =
Then, the registration algorithm returned a transformation file, T(x,y). This file has the purpose of finding a point in the left image according to each point (x,y) in the right image [33]. Figure 2 shows the checkerboard of the registered image output.
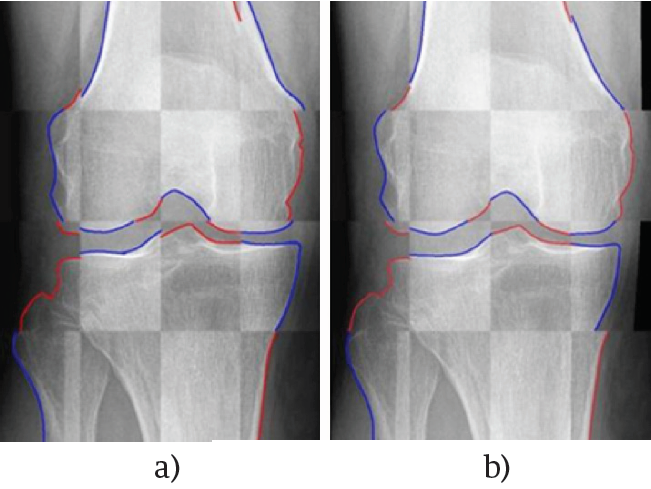
Figure 2. A) Checkerboard image of the unregistered right to left knee, B) Checkerboard image of the registered right to left knee. Red (left knee) and blue (right knee) lines where draw over the edge of the knee images to facilitate the graphical comparison.
It is important to mention that Equation 4 was minimized using the RegularStepGradientDescentOptimizer function, from the ITK library [34]. This function basically refers to the gradient descent minimizing method.
Metric quantification
Three meaningful measurements were calculated to set the relationship between the registered image and the target image. These measurements were mean squared error (MSE), correlation coefficient and mutual information [35]. These parameters are widespread utilized to compare two different images [36].
The first parameter, MSE, is calculated according to the Equation 5, which assumes that the images are the same at registration, therefore, it is implicitly assumed that do not exist differences between intensity levels. The MSE parameter is sensitive to outliers, that is to say, a small group of voxels characterized by having high differences on the intensity levels. In this equation, F is the model image, R is the objective image into the image and FT is the transformed image after the registration.
In Equation 6 is calculated the Pearson’s correlation coefficient (CC), which is
a parameter that measures the linear dependence between two different variables
on images. R
m
is the mean of the pixel R in the domain
(R, F) and
In Equation 7 the mutual information (MI) is calculated, which obtains a parameter of probabilistic dependence between two different intensity distributions. In this study is obtained the Shannon-Wiener entropy measure H by this equation, where H(A) and H(B) represent the entropies of the images A and B, and H(A, B) represent the joint entropy.
In Equation 8 is calculated H(A, B), which measures how much uncertainty there is in the two random variables A and B taken together; where p(a, b) denotes the probability mass function considering two random variables jointly distributed.
Statistical Analysis
All image registration measures were correlated with the K & L score. For data analysis, three multivariate searches were performed using the knee chronic pain as an outcome variable. The time points evaluated for chronic pain, in the 48-month, in each search were: baseline visit (T0), one year after baseline (T1), and two years after the baseline visit (T2).
To evaluate the predictive individual measures performance, a logistic regression was performed according to the binary outcome variable, which is represented as No pain = 0 and Chronic pain = 1. Using the image registration measures individual variable, a logistic regression was performed using T0, T1, and T2 as an outcome.
They were developed general linear models, which were analyzed later. Also, they were calculated the odds ratios, and the area under the receiver operating characteristic (ROC) curve (AUC) for each model. Leave one out cross validation (LOOCV) was performed. The parameter calculated, ROC, is a function which generates a curve and is interpreted as a graphical representation of the sensitivity (taking values from 0 to 1) and the specificity (taking values from 1 to 0) for a binary classifier or model system as the discrimination threshold is varied, looking for the quantity of true negatives and true positives, in order to validate the model accuracy.
For the subsequent statistical analyzes was used the free statistical software R and some of its packages [37].
RESULTS AND DISCUSSION
Experimental results of the mutual information, correlation, and mean squared error are presented in Figure 3 for T0, T1, and T2.
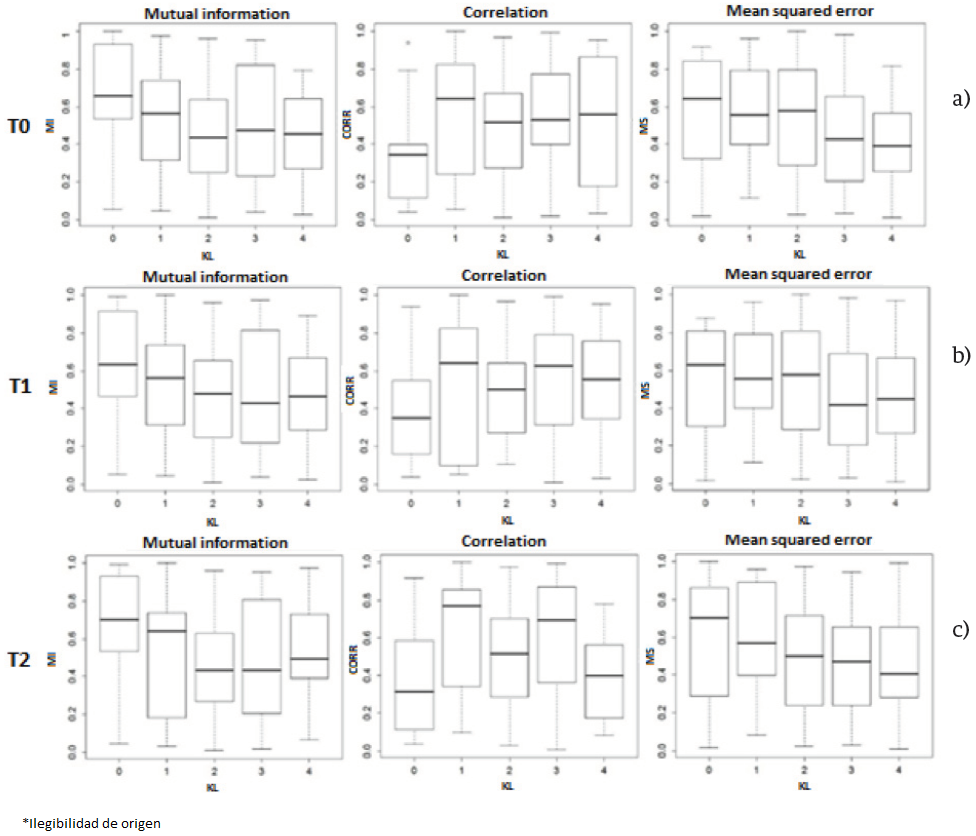
Figure 3. A) Mutual information, correlation and mean squared error in T0, B) Mutual information, correlation and mean squared error in T1, C) Mutual information, correlation and mean squared error in T2.
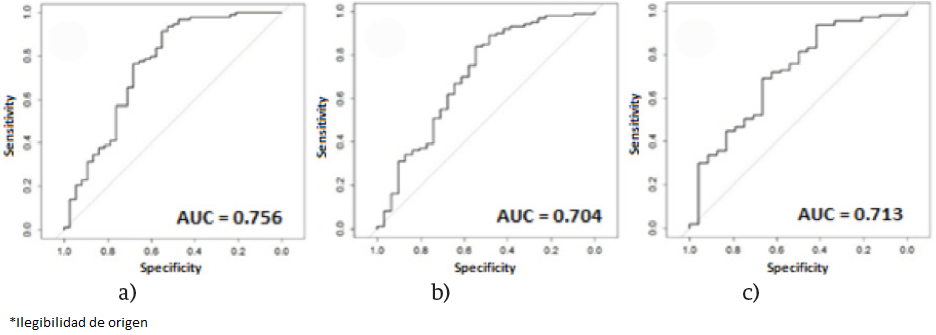
In Figure 4, ROC curves of mutual information, correlation and mean squared error by time points T0, T1 and T2, are displayed. Each multivariate model predictive performance is presented for T0, T1, and T2. In Figure 5 ROC curves of multivariate models are displayed.
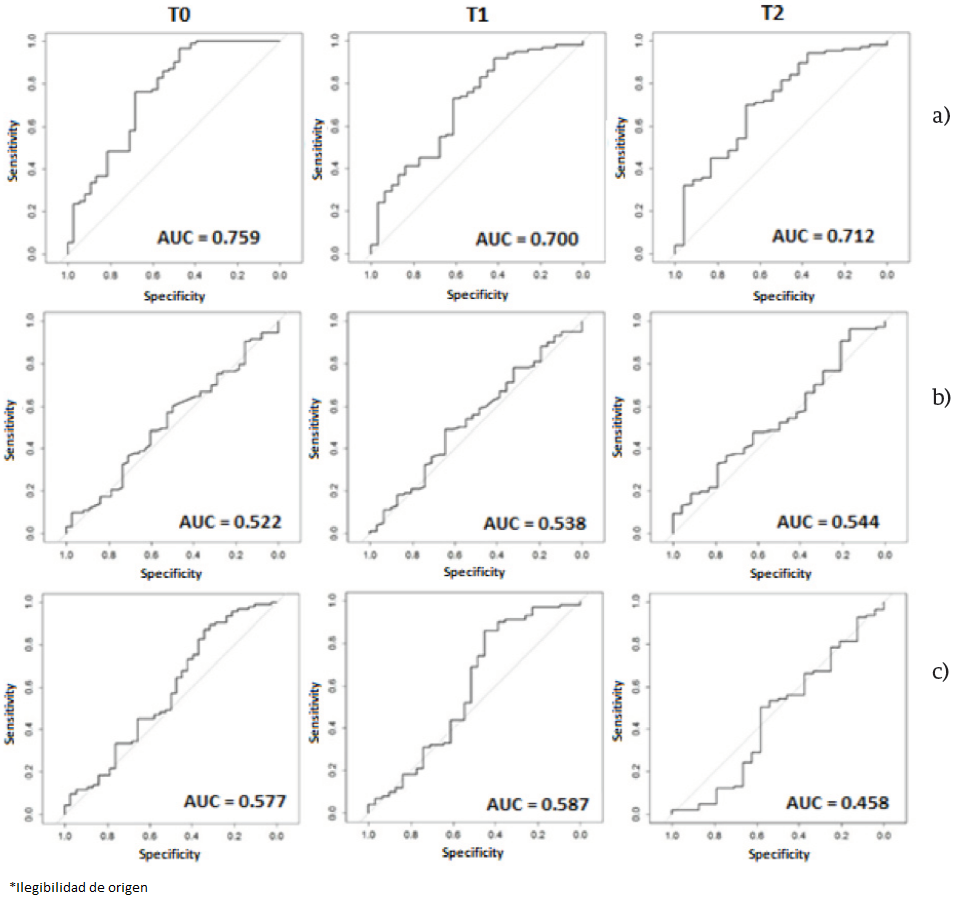
Figure 4. A) Mutual information ROC for T0, T1 and T2. B) Correlation ROC for T0, T1 and T2. C) Mean squared error ROC for T0, T1 and T2.
A chronic pain association study using image registration measures is presented for the first time. By analyzing bilateral knee x-ray images the results can be used to generate an automated knee evaluation model for knee OA. Some other studies use image registration in OA, but not in X-ray, and not for the symptom association [38-40].
The mutual information shows a behavior downward with respect to the increase in the K & L, in this experiment the evaluation of K & L was not balanced so apparently, the correlation and the mean square error appear not to associate with K & L as shown in Figure 4 at T0, T1 and T2.
After evaluating the predictive performance measures as individual variables, it is evident as is shown in Figure 5, that the correlation and the mean square error have no predictive power for themselves. However, mutual information has better performance than univariate models in T0 and T2, and their behavior alone is very similar to the multivariate model in T1.
After evaluating the three multivariate models, we can say that there is a close association between the measures obtained automatically and chronic pain presented in the three time points observed. The predictive power of the models presented in Figure 5 is very similar but superior to the models obtained by radiological information measured by expert radiologists [41].
Multivariate models have acceptable performance in their predictability based on the AUC, and then only the model for T1 has a higher performance univariate model, and is very similar.
There are limitations in the study. First, patient selection criteria make the study population decline as no loss of information in databases. Also, pain is a subjective outcome that changes from person to person, and its mechanism is not fully studied.
Given these limitations, we cannot generalize the findings and the external validation of the results is required to assess the clinical applicability of the models.
On the other hand, it is important to mention that in this work it was proposed the local image registration method because, according to the work of Celaya et al. [42], where a comparison for bilateral registration mammography was performed, comparing different types of registration in two images that theoretically should present the same characteristics but, due to the biological phenomena, they presented heterogenous tissue, demonstrating that for this type of problem, which is very similar with the problem presented here, the results obtained using this method were the most robust, which allows to confirm the hypothesis that the greater the error in the registry, the greater the deformation in one of the knees.
The results suggest that measures of asymmetry obtained from the image registration show a close relationship with chronic pain development in patients with OA. Also, they suggest that the use of measures obtained automatically, can lead to the development of a tool to set the stage of the disease in which there is no human intervention. Also, suggest that the mutual information can be used individually as a risk factor for the future development of chronic pain as a symptom of OA.
CONCLUSIONS
Of research results we can conclude that the use of image registration in x-ray images has potential for the development of automated setting step in which a patient is OA tools. Also, the degree of asymmetry between the knees, can lead to early diagnosis and thus obtain a better prognosis for the patient on the progression of the disease and its symptoms.
Due to the widespread use of x-rays, it opens a great opportunity to get a support system for decision making for the radiologist, even in places where there is no access to advanced medical services.
The public health systems would benefit of an automated system, as in developing countries, where the number of trained radiologists is limited, and the workload to which they are exposed is too much.
A system that allows the radiologist to decrease the workload can lead to better diagnosis of patients and thus controlling disease progression in patients with signs of OA. The use of computational tools in medical science has a big impact, since these tools allow us to handle a large amount of information accurately and get results that are not possible with traditional methods.
As future work is to expand the number of subjects, and if possible, get data immunological bases from other studies to corroborate the results obtained in this work.

