


 nueva página del texto (beta)
 Inglés (pdf)
 Artículo en XML
 Referencias del artículo
 Enviar artículo por email
 Citado por SciELO
  Similares en
SciELO
Similares en
SciELO 
 Permalink
Introduction
Bone density measurements which are used to know the degree of bone demineralization are useful in evaluating patients suffering from bone discomfort due to either sickness or natural aging. Some of the sick-nesses, where such degradation is desirable to know, are osteoporosis and bone metastasis. In other cases, such measurements are done to monitor if therapies and treatments using medicine relating to the osseous system are working well.
To observe bone metastasis with plain radiography, considerable bone damage must be present. It has been estimated that 30%-70% reduction in bone density is required to visualize a metastasis [1] [2] [3] [4] [5] [6]. Some efforts have been made in order to decrease this range in such a manner that plain radiographies can be digitally analyzed. In the literature, it has been reported that it is feasible to observe bone degradation between 3% and 12% by using digital techniques based on first-order statistics of gray level histogram of the image.
One of the first works in this field was reported by Thomas and Karin [7], where alveolar bone was analyzed to detect osteoporosis by digitalizing dental radiographies. In such work it is reported that 5.7% bone degradation was observed in ideal conditions and 9.4%-12.6% in not ideal conditions. Later on, Kouloulias et al [8] reported to have detected a 3.17% bone decalcification while evaluating bone re-calcification after applying radiotherapy to a patient with bone metastasis problems. In similar work [9], a 9.3%-13.7% bone degradation was reported when monitoring the use of disodium pamidronate together with radiotherapy in patients suffering bone metastasis. Finally, Jaramillo and Pérez [10], by using digital techniques to find early bone metastasis, shown that it was feasible to detect differences bellow the estimated critical limit 30-60% on plain radiographies, although no value was reported.
In this work, the analyzed images by Jaramillo and Pérez were used again to find the quantitative bone loss that can be detected in them. This reported technique has two significant advantages compared to the method mentioned in Reference10, including: the bone increment/decrement can be quantified, and the area where the degradation is taking place can be located from the graphs of the scanned rows in the image.
Background
In reference 10, three simple radiographs taken throughout one year were analyzed. The time interval between the first and second x-rays was fifty days, and between the first and third was one year. The radiographs were taken for a forty year-old female with diagnosed breast cancer and pain in the right shoulder. The aim of the study was to determine whether it is possible to observe bone degradation less than 30% from plane radiographs.
In previous work [10], the first radiograph was used as a reference but assumed to be healthy. So far, it is not known whether it was really healthy. This information is necessary to give an effective conclusion to this study.
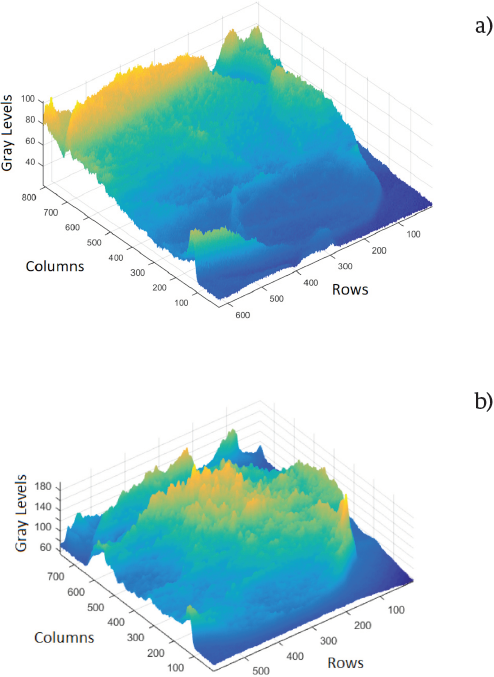
Figure 1 shows the obtained intensity distributions (gray levels) of the humeral head of the first and third x-ray images. As can be seen, there are significant differences in intensity as in texture of the intensity surface among both 3-D images. At first sight, this could be a fast qualitative way to visualize a metastasis.
Methodology
The patient´s radiograph is placed in a negatoscope (X-ray film viewer), and digitized by using a Pixelink camera model PL-B781U to digitize the image in 3000 x 2208 pixels (H X V) with a bit depth of 8 and 10. Dimensions of active area are 10.5 x 7.73 mm with a pixel pitch of 3.5 x 3.5 microns.
Two Computar lenses (M5018-MP2 and M3516-MP2 models) are used and chosen according to the size of the region to be digitized. A lens with focal length of 50 mm and F 1.8 is used if the region is greater than 8 X 8 cm but lens with a focal length of 35 mm and F 1.65 is used if the region is less than 8 x 8 cm. It is recommended to fully open the diaphragm of the lens before taking the photograph so that the photographic process does not modify the radiograph´s information.
The Pixelink camera can save the digitized image in BMP, JPG, and TIFF formats. The BMP format was chosen in this investigation to save the images because the images were saved with a pixel bit depth of 8. Next, the Matlab libraries (Toolbox) of digital image processing are used to carry out the analysis. First, the digitized image is read, then the region of interest (ROI) is selected and separated from the image. Finally, the ROI is graphed in 3D to quickly observe if there is any area developing metastases. If it so, then the image is scanned where anomalies were observed to quantify it. When the metastases are asymptomatic it is necessary to plot in 3D larger regions in order to find them. If no metastases are found the work is complicated because it is necessary to perform random scans in regions with high probability of metastases. This additional work can be time-consuming, but it is necessary to make sure that the analyzed ROI is free of metastases.
Analysis
In this section, a reduced area of the radiography will be studied, with the main aim to detect from intensity profiles some noticeable characteristics of bone degradation.
Figure 2 shows the obtained humeral head of the first radiograph with a 380X500-pixel region of interest (ROI), which will be analyzed. The selected ROI assures that information of other bone areas is not considered.
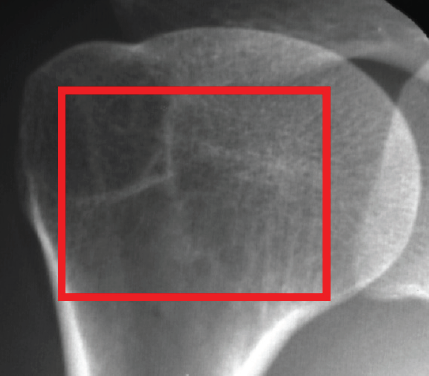
The analyzed rows are between the rows 20 to 340. The set of graphs can be divided in two groups; in the first one from the row 20 to 160 and in the second from the row 200 to 340.
The graphs of the first group are characterized to have crests and periods with greater amplitude; with respect to the second group.
The differences observed in the graphs agree with that observed in the Fig. 1 (b); the progress of the metastasis in the center and upper area of the humeral head is greater than in the lower. It is obvious that in the early stage the metastasis followed the same behavior of that in the later stage; that is, the main differences are in the center and upper part of the humeral head.
Results
To determine the bone degradation, it is necessary to choose a quantitative procedure over a qualitative comparison of graphs. Using the scanning method, in Table 1 are shown some results of sixteen rows analyzed.
Table 1 Results from the selected rows.
| Row number |
Mean | Min | Max | Interval width (Min+Max) |
| 20 | 45.43 | -6 | 6 | 12 |
| 40 | 44.99 | -6 | 5 | 11 |
| 60 | 45.34 | -5 | 8 | 13 |
| 80 | 45.78 | -6 | 7 | 13 |
| 100 | 46.38 | -7 | 12 | 19* |
| 120 | 47.35 | -9 | 7 | 16 |
| 140 | 47.3 | -7 | 10 | 17 |
| 160 | 46.14 | -7 | 6 | 13 |
| 180 | 45.95 | -6 | 9 | 15 |
| 200 | 44.85 | -6 | 7 | 13 |
| 220 | 45.32 | -5 | 7 | 12 |
| 240 | 45.21 | -5 | 8 | 13 |
| 260 | 45.27 | -4 | 7 | 11 |
| 280 | 45.52 | -4 | 7 | 11 |
| 300 | 45.59 | -5 | 5 | 10* |
| 340 | 47.11 | -5 | 6 | 11 |
The first column shows the selected row number. Column two shows the mean of the gray levels of the selected row. The third column contains the difference between the mean value and the maximum gray level of the selected row (see Figs. 4 and 5). Column fourth shows the difference between the mean value and the minimum gray level of the corresponding row. Finally, column five shows the sum of the absolute values of columns three and four. As can be seen, quantitative indicators can be increases of: the mean, interval wide, and standard deviation (the latter not shown in the Table 1 but shown in Figs. 3 and 4).

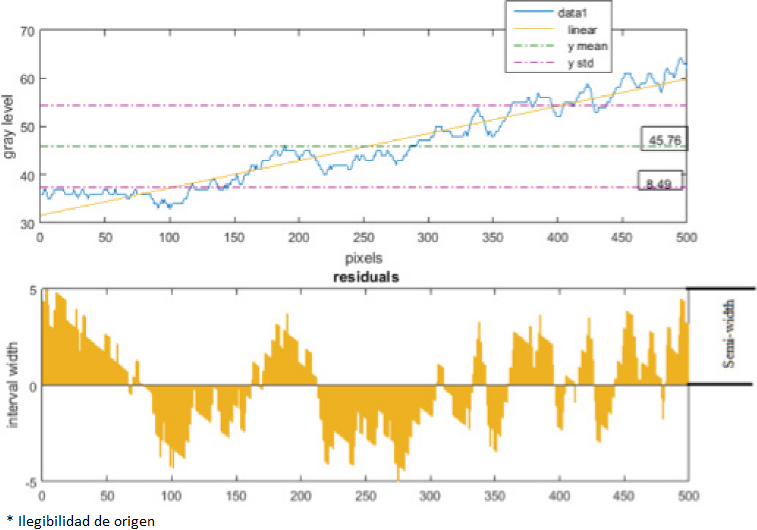

Figures 3 and 4 show the results for rows 100 and 300, which show the greatest and smaller width, respectively (see Table 1). The shown minimum, maximum, mean intensity values and the intensity profiles were obtained using Matlab [11].
The bone degradation (BD) of a given row is calculated in the same manner as percentage error of a measurement [12]:
The difference between mean value and measured value is equal to the semi-width on the graph. For example, for the Fig. 4 the bone degradation is between 25.87% and 15%.
To calculate the minimum bone degradation for the case under examination, row 300 was used and a bone degradation of 10.96% was obtained. A theoretical analysis (not reported) suggests that it is feasible to observe bone degradation on plane radiographs between 5% and 10%. The value depends principally on the magnitude of the noise on the regions of healthy bone. Before analysis can take place it is necessary to perform noise reduction. Noise reduction was accomplished with a median filter which is reported in the literature to reduce the noise in x-rays [13].
So far, the method has been applied in a bone not overlapping with other ones. This is not feasible when there is an overlap between bones; in this case the line-to-line method fails.
However, the graphical method can be very helpful in this case. Figure 5 shows the intensity distributions of the coracoid bone with and without metastases. These images were obtained from the same X-rays mentioned previously.
Discussion
When a patient, whit diagnosed breast cancer, is suffering from bone pain, it is common to perform a simple radiography. If demineralization is not evident, it is possible to get a negative diagnosis to metastasis even when it is present. However, for metastasis of about 10% or more, then it is possible to detect it. Now, just after a patient, with diagnosed cancer, has osseous pain mainly, the simple radiography could be enough, in some cases, to diagnose if such a patient is going through metastasis. By using the scanning method, the simple radiography can be employed as a method of monitoring [14], to know if the metastasis is progressing, even when if the demineralization is small, for about 10%. This will be good for the patient because will avoid to be radiated if other techniques of monitoring are used, such as CT.
The value obtained of 11% for the bone degradation of the analyzed case is substantially an improvement over the mentioned critical range in the literature. Additionally, it is similar to the one reported in reference 7, but differs from reported value in reference 8. Furthermore, it is close of the rank mentioned in the literature where is established that the bone scintigraphy can detect osteoblastic activity as little as a 5%-10% change [15] [16]. The obtained value from our method becomes important when looking for early metastasis. Now, we can assure quantitatively that the humeral head shown in Fig. 2, shows positive evidence of early bone metastasis. Such result has an important implication: plain radiographies, in special cases, can be used to look for early bone metastasis if the scanning method and plotting of the intensity distribution of the image is employed. From graphs as those of Figs. 3 and 4 it is possible quickly find out if the bone is in an abnormal metabolic activity, as widely described in reference 10.
It's necessary to use the method in others documented cases to know its scopes and limitations. If the results are acceptable we will pass to the test stage in a medical center so that the work does not stay in the field of research but has a direct application in patients. We believe that its implementation is feasible because it does not require expensive or sophisticated equipment.
Conclusions
One method to find early bone metastasis on a humeral head has been presented. Plotting the intensities profiles distribution along some rows of the image could be a fast qualitative way to know if the bone has some abnormality, if the graph is “smooth” then is healthy, but if it is discontinuous then it is sick.
The line-to-line scanning method is relevant because it can detect the early metastasis from three points of view. Visual, for example, Fig. 2 shows crests with greater period and amplitude. Quantitative, for example, for the case shown in Figs. 4 and 5 the mean value was 46.38 and 45.59, respectively. The increment of the interval wide and standard deviation could be considered as quantitative indicators too. Finally, plotting the rows scanned we can see the zones where there is bone change which lets us be sure of the area where the sickness is progressing.
However, the analysis was made after knowing where the lesion was; in real practice, this will not happen this way. Hence, the task for finding the lesions will be for who interprets the radiographies, but the expert won't be able to find something that cannot “see”; consequently we would be back to the wrong diagnosis. Our suggestion is that the radiographies of patients with probability of suffering from metastasis and having a negative diagnosis must be carefully examined using a computer software.

