


 nueva página del texto (beta)
 Inglés (pdf)
 Artículo en XML
 Referencias del artículo
 Enviar artículo por email
 Citado por SciELO
  Similares en
SciELO
Similares en
SciELO 
 Permalink
Introduction
Computed Tomography (CT) and Magnetic Resonance Imaging (MRI) are the mainstays of neuroimaging. Even with its main drawbacks: ionizing radiation and limited soft tissue contrast compared to MRI, cranial CT remains an often utilized modality in the emergency room because of its wide availability (average of 24 for CT in OECD countries vs 14 for MRI1, quick results, and accuracy in detecting intracranial hemorrhage, middle ear/temporal bone pathology, bone lesions, and fractures of the spine or skull2. Several contributions have been made to pattern recognition techniques and medical image analysis, in order to develop and implement automatic tools that can improve the efficiency of pathology detection based on the segmentation of anatomical structures3,4. In neuroimaging, brain tissue segmentation (BTS) plays a key role in the study of various abnormalities, brain development and evaluation of the progress of treatment5. BTS is important for subsequent applications such as tissue dependent perfusion analysis and automated detection and quantification of cerebral pathology6. Cerebrospinal fluid (CSF), white matter (WM) and gray matter (GM) are the basic tissue types in BTS. Subsections of the image with specific characteristics are labeled with the aim of achieving homogeneous partitions representing CSF, WM and GM. Because it provides superior contrast of soft tissue structures, MRI is the method of choice for imaging the brain and most research on brain segmentation focuses on MRI7. In CT the research is mostly limited to the segmentation of the pathology, without segmenting the brain tissues separately6,8. In order to segment and obtain an estimate of total intracranial volume, in 9 was proposed an algorithm that combines morphological operations, intensity thresholding and mixture modelling from CT and MRI. The model in CT was limited to the quantification of two classes: tissue (brain tissue and CSF) and bone, whereas in MRI the classes of WM and GM were quantified separately. Inspired by sparsity constrained classification, in 10 was proposed a dictionary learning framework for image segmentation. Experiments performed on infant CT brain images accurately segmented three classes: CSF, brain and subdural hematoma collections. Berndt et al.11 evaluated the ability of single and dual energy computed tomography (SECT, DECT) to estimate tissue composition and density for usage in Monte Carlo simulations of irradiation induced β+ activity distributions. A DECT-based brain tissue segmentation method was developed for WM, GM and CSF. The elemental composition of reference tissues was assigned to closest CT numbers in DECT space. Unfortunately, in comparison to MR brain segmentation, Dice similarity coefficients for WM, GM and CSF were 0.61, 0.67 and 0.66.
The inherent difficulty in extracting relevant and non-redundant features, segmenting and quantifying brain tissues, has increased the use of soft computing techniques in brain tissue segmentation. Fuzzy logic has the potential to combine human heuristics in computer-aided decision making, it opens the door to construction of better models of reality and involves exploitation of a tolerance for imprecision12. Fuzzy logic has been applied in all disciplines of medicine in some form of classification, detection, segmentation and control13,14,15, and recently its applicability in neurosciences, especially in brain tissue segmentation, is also increasing16, 17, 18.
In this paper, a fuzzy approach is presented for brain tissues (CSF, WM and GM) feature extraction in Non-Contrast Computed Tomography. The structures were characterized based on the radiological attenuation index denoted by the Hounsfield Units.
Material and methods
The methodology is composed of three main elements: pre-processing, feature extraction and validation of features. The data used in this study were obtained from the College of Radiology and Imaging Specialists of Ciudad Juárez. We used NCCT brain imaging, 120 cases of non-pathological patients (male and female) with thicknesses of 1 mm (74 cases) and 1.5 mm (46 cases) and mean ages of 30 ± 20 years. Image datasets have a resolution of 512 x 512 pixels (16-bits). The cases were collected from 3 CT scanners. from two hospitals located in Cd. Juárez, México. Their use in this research was approved by a bioethics committee. We used 40 cases for the training dataset and the rest for the test dataset.
Pre-processing
In this first stage of the methodology it was necessary to perform the standardization of the images through two steps: the gray scale conversion to Hounsfield Units, and a skull stripping algorithm to delimit the region of interest. We identified and discarded all cases containing CT artifacts: noise, beam hardening, scatter, pseudoenhancement, motion, cone beam, helical, ring, and metal artifacts19.
Conversion to Hounsfield Units
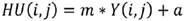
A Hounsfield Unit is the number assigned to each pixel in the CT image and is the expression of the density of the irradiated object. It represents the absorption characteristics or the linear attenuation coefficient of a particular volume of tissue. The UH scale has a range from -1000 to +1000, each constituting a different level of optical density. This scale of relative densities is based on air (-1000), water (0) and dense bone (+1000). The CT cases from DICOM files are in gray levels, therefore they were converted to HU following next equation:
 (1)
(1)
where Y is the gray level, m is the rescale slope and a is the rescale intercept, these two data can be found in the information contained in the DICOM file.
Skull stripping
Skull stripping (SS) aims to segment the brain tissue from the skull and non-brain intracranial tissues. It is an important pre-processing step in neuroimaging analysis before other processing algorithms can be applied20. We implemented the SS algorithm proposed in 21. The main features of this skull stripping algorithm are the simplicity and robustness. It is simple since neither pre-processing of the image data nor contour refinement is required. This algorithm creates an image mask of the brain that limits processing to only those pixels contained by the mask. The SS algorithm is divided into four steps: binarization, morphological closing, subtraction to eliminate the skull and area labelling.
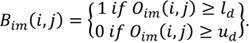
Binarization: once the window setting is performed defining the upper and lower tissue densities (ud and ld respectively, values for display on brain CT: center 35, window width 70, the original image Oim is binarized (Bim ) as:
 (2)
(2)
Morphological closing: a morphological closing (Eq. 3) was performed to eliminate small holes, filling and connecting them to near components. A disk shaped structural element (se) was used:
 (3)
(3)
Subtraction to eliminate the skull: a new image (Sim ) is obtained subtracting the closed image from the original image in order to separate the brain tissue from the rest of the image.
 (4)
(4)
Area labeling: neighborhoods of contiguous pixels are labeled in order to define the encephalon as the largest area (A) found in the image. The mask Mim contains the intracranial region data where the background and skull are discarded.
 (5)
(5)
Feature extraction
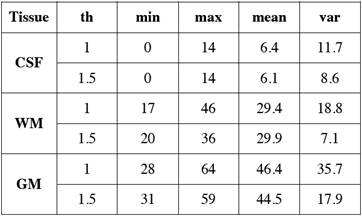
At this stage, under the guidance of two expert neuroradiologists, subsets of brain tissue (CSF, WM and GM) were selected with the aim of analyzing their HU characteristics. The subsets were mainly obtained for white matter, from the region of the knee of the corpus callosum and semioval centers; for gray matter, of the head and body of the caudate nucleus; and the ventricles for cerebrospinal fluid. The training set was composed of 1920 tissue samples: 4 samples (sub images of at least 10 x 10 pixels) of each tissue using 4 slices (per case) of the 40 cases.
Histogram analysis
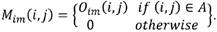
After the tissue samples were selected we obtained their corresponding histogram (Fig. 1) and analyzed its HU characteristics (Table 1).
Table 1 Main statistical measurements in Hounsfield Units of NCCT brain tissues for different slice thickness ('th' in mm).
We arranged the frequencies of the tissue samples into three vectors and obtained their corresponding histograms (Fig. 2). The cerebrospinal fluid presents the lowest values in HU followed by those of the white matter, and the gray matter with the highest values. The histograms of gray and white matter overlap in their distributions, the overlap becomes greater as the slice thickness is thinner.

Fuzzy Membership Functions
The basic element in fuzzy systems is the membership function (mf). For this study was necessary to define an appropriate set of mfs that could be correctly adapted to NCCT data, and consequently to efficiently separate WM and GM tissues. A fuzzy set A is defined using a membership function for the elements of a universe of discourse U with elements in the [0,1] interval. The closer A(u) is to 1 the higher would be the membership of object u to set A. Membership functions are generally denoted by μ, being the most common the triangular and trapezoidal.
We selected the membership function based on the cumulative distribution function22 due to its proven classification efficiency in histograms with varying degrees of asymmetry and overlapping. The mathematical description is as follows:
 (6)
(6)
C is the characteristic to be assessed in a population. cdfL(pij) and cdfR(pij) are the values of the left and right cumulative distribution functions associated to pixel pij for the characteristic C. a1 and a2 are parameters in the (0,1) interval that must be adjusted according to the overlap between the populations to be evaluated, increasing their value proportionally to the overlapping degree. Using Eq. (7), a membership function associated to each of the histograms of CSF, WM and WM, μCSF , μWM and μGM, was implemented (Fig. 3).

A pixel pij is CSF if Eq. (8) is fulfilled, is WM if (9), and GM if (10).
 (7)
(7)
 (8)
(8)
 (9)
(9)
Validation of features
The extracted features were validated by means of a quantitative classification, for this, several synthetic images were generated (Fig. 4) from real tissues extracted from cases that did not belong to the training set. The images contained at least 100 pixels of CSF, WM and GM tissue. Subsequently, real images were classified in order to qualitatively analyze the characterization of each tissue.
Results and discussion
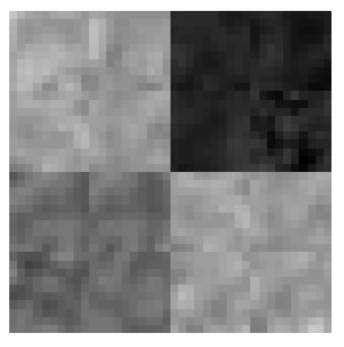
The conditions of equations 8, 9 and 10 were evaluated in the synthetic images. For each input image, an output image was obtained where black was used to represent CSF, gray for GM and white for WM. Figure 5 shows three examples of synthetic images from real tissues and their corresponding classification. A misclassification can be observed as a pixel of a different color to the one assigned to that tissue, for example in Fig. 5, the black pixel observed in the WM tissue (white) in output image 1 indicates that one WM pixel was misclassified as CSF (black).
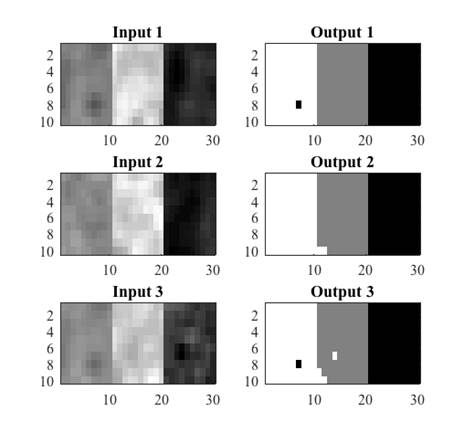
Fig. 5 Examples of synthetic images from real tissues: white matter, grey matter and cerebrospinal fluid, and their corresponding classification.
Tables 2 and 3 show the confusion or error matrix and the results of the true positive rate (TPR) or sensitivity and the true negative rate or specificity (SPC) for the images from cases with slice thickness of 1 mm.
Table 2 Error matrix of the classification of brain tissues for synthetic images from cases with slice thickness of 1 mm.
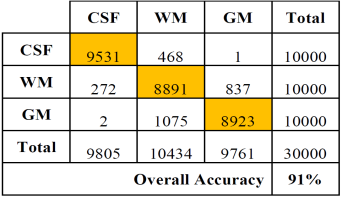
Table 3 True positive and negative rates of the classification of brain tissues for synthetic images from cases with slice thickness of 1 mm.
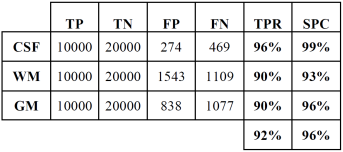
The same is shown in Tables 4 and 5 for slices of 1.5 mm.
Table 4 Error matrix of the classification of brain tissues for synthetic images from cases with slice thickness of 1.5 mm.
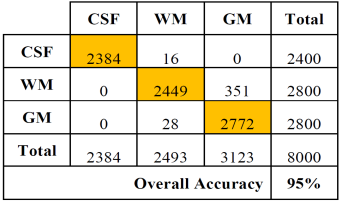
Table 5 True positive and negative rates of the classification of brain tissues for synthetic images from cases with slice thickness of 1.5 mm.
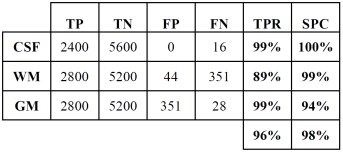
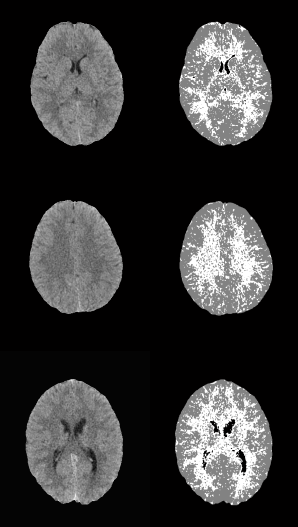
In both cases, those of 1 mm and 1.5 mm, some misclassifications were presented in the HU in which WM overlaps with GM. However, considering the overlap that exists between WM and GM tissues, the TPR and SPC values of the three tissues, as well as the overall accuracy demonstrate a correct feature extraction and consequent outstanding classification. These results can be appreciated in the images of Fig. 6, where the 3 tissues are clearly distinguished.
Conclusions
The correct feature extraction of brain tissues: cerebrospinal fluid, white matter and gray matter in non-pathological cases of NCCT, was achieved in slice thickness of 1 mm and 1.5 mm. The benefits of the membership function based on the cumulative distribution function allowed the correct separation and quantification of the three tissues, which until now had not been reported in the literature. The membership function correctly adapts to the non-symmetrical and overlapping distributions of the brain tissues, reinforcing the idea of continuing to work with fuzzy logic techniques. It is also necessary to extend this work using segmentation techniques that reduce misclassifications, and adapt this model for its use in the quantification of brain tissue volumes.

