


 nueva página del texto (beta)
 Inglés (pdf)
 Artículo en XML
 Referencias del artículo
 Enviar artículo por email
 Citado por SciELO
  Similares en
SciELO
Similares en
SciELO 
 Permalink
Introduction
Brain computer interfaces (BCI) are systems that aim to establish a non-muscular communication path between a person and the environment. BCI systems are aimed to population who suffer from motor disabilities, making use of different phenomena present in the brain activity1, 2, 3, 4, 5, 6, 7, 8, 9, 10. However, the application of BCI is not restricted only to rehabilitation. Recently, BCI has been used for entertainment in multimedia games with healthy people1, 11. Different methods for acquiring the brain signals can be used in BCIs, however for practical considerations the electroencephalogram (EEG) is most used. EEG has the advantage of being a non-invasive technique, of easy use, low risk for the subject and relatively cheap compared to other techniques as electrocorticography (ECoG) which is an invasive method that need of surgery for correct placement of the recording electrodes over the brain cortex.
Depending on the activity executed by a person, different potentials are elicited in the brain signal, such as P300, steady-state evoked potentials (SSVEP), slow cortical potentials (SCP) and sensorimotor rhythms (SMR). Those potentials can be used as features for decoding subjects intention and provide mechanism for interaction with the environment12.
Of great interest is the SMR, these rhythms are observed as a decrease in the activity in the Alpha band (8 - 12 Hz) and Beta band (16-26 Hz) when the subject executes motor task. Interestingly the decrease in the power in the frequencies mentioned before is also observed when the subject imagines the movement, which is of especial interest in applications for people with degenerative diseases. Topographically, the decrease in power occurs over the brain areas known as the primary motor cortex and the sensorimotor cortex. Several methods have been proposed for extraction of the features of the SMR such as adaptive auto-regressive models (AAR)13, 14, common spatial pattern (CSP)15, filter bank CSP (FBCSP)16, Common Spatial Subspace Decomposition (CSSD)17, 18 among others. After feature extraction, classification is performed using machine learning techniques. Of particular interest are the Linear Discriminant Analysis (LDA) due to its simplicity and the Support Vector Machines for its optimal performance. These two machine learning techniques dominate the BCI literature19, 20, 12, 13, 5, 21, 14.
In this work a method based on short time Fourier Transform (STFT) is presented for feature extraction. Algorithms for feature selection based on Sequential Forward Selection (SFS) and Principal Component Analysis (PCA) are compared. Finally, classifiers based on LDA and SVM were implemented and compared in terms of performance.
Methods
Data-set Description Data-set 2b from BCI competition IV was used for this analysis. The experimental paradigm was applied to nine subjects. Each subject was sitting in an armchair in front of a screen at the eye level from one meter of distance. There were five sessions, whereby the first two sessions were for training purpose. The other were feedback sessions, consequently the subject knew the immediate results of the imagery tasks. The imagery task concern to two classes, which were the motor imagery of left hand (class 1) and right hand (class 2). Given that the sessions were recorded in different days, only one of the sessions was used for each subject. This was done due to the session transfer problem that is present given that the conditions of the experiment may change across sessions.
The description of the experiment can be seen in Figure 1. For each session, an electro-oculogram (EOG) was realized before starting the experiment in order to estimate its influence on the electroencephalogram signals (EEG). Each session is composed of six runs with ten trials each per class, for a total of 120 trial for each class in the session used. Each trial began with a fixation cross and an acoustic sound that indicated the start of the trial. Then, a cue indicating the motor imagery task to be executed by the subject appeared. In parallel, the EOG signal was recorded together with the EEG, in order to use for removal of the artifacts caused by subject’s eye movements.
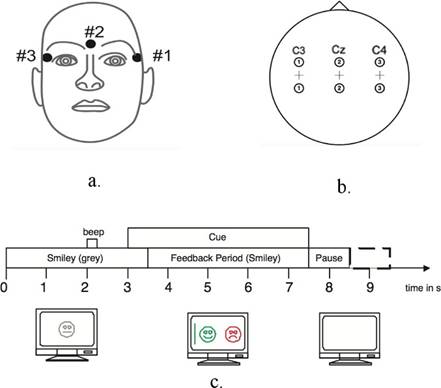
Figure 1 a) Electro-oculogram (EOG) monopolar electrodes location. b) Electro-encephalogram (EEG) bipolar electrodes location. c) Description of the experiment for feedback sessions.
The EEG signal was recorded through three bipolar electrodes centered on C3, Cz and C4 (see Figure 1) with a sample frequency of 250 Hz. The EEG recordings were bandpass filtered between 0.5 Hz and 100 Hz and the line component of 50 Hz was removed using a notch filter.
The electrode Fz was used as a signal reference. The EOG signal was recorded through three monopolar electrodes as displayed on Figure 1 (left mastoid serving as a reference for the signal). These channels were recorded in parallel with the EEG signal, with the same amplifier settings.
Feature Extraction
For feature extraction, the STFT was computed for each trial obtaining a representation the changes of power with time for each frequency value. Since EEG signals are of non-stationary nature, the use of the STFT is required instead of the Fourier transform. The Fourier Transform (FT) is defined as:
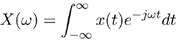
where ω means the angular frequency and X(ω) is the FT of x(t). The STFT22 computes the Fourier transform at different time intervals of the signal using a window function. In this way the new domain, which is the frequency domain, change over time. The STFT is defined as:
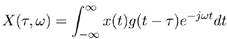
in this case τ refers to the corresponding time of the FT computed and g(t) concern to the time window function. In this work a Hamming window was used. The time window function define the time resolution and the frequency resolution20. However there is a trade of between frequency resolution and time resolution. The best of compromise can be obtained using overlapping windows.
Feature Selection
After feature extraction using the STFT, two approaches of feature selection were applied to data.
Principal Component Analysis (PCA)
PCA is a dimensionality reduction method. Given a set of signals, PCA find a projection to a new space where the new total variance of the original data is mapped to a reduced number of components. The components are ranked according to the amount of variance retained. The component with the maximum variance is termed the principal component. In this fashion, the data is represented in a compact form, reducing the number of features to be input to the classifier in subsequent stages. The k-th principal component can be computed as:
where X is the data matrix and w is the projection vector. The projection vector which extracts the maximum variance must fulfill the following expression:

It can be shown that the solution for this optimization problem is that the set of filters w that extract the principal components is in fact the eigenvectors of XT X 21.
Sequential Forward Selection (SFS)
This method uses an iterative approach for selection of relevant features. It initializes with an empty feature vector. Each feature is tested individually and the feature providing the higher improvement in classification is selected. Once the first feature is fixed, the process is repeated with the remaining features. This iterative process is repeated until when further inclusion of features does not incur in a increased performance23, 20. We selected a threshold of 1% as minimum accuracy increase in order to include a feature in the set of selected features.
Classification
Linear Discriminant Analysis (LDA)
Linear discriminant analysis is a method for classification based on linear separation of two or more classes. The operation principle is to find a straight line that divides two regions (in a two classes problem), such that depending on the location of a new test sample the algorithm determine to which class the new sample belongs.
The straight line is ruled by the following equation

where wT are denominated the weight vector, w0 is a bias and x is the sample vector19. Basically, when a sample x+ is located over the straight line y(x+) = 0. Hence, y(x) represents the distance r from the sample to the decision surface. Accordingly, r and y(x) are related by

r determine the class assigned to the sample.The parameters wT and w0 are learned from training data such that the error in classification is minimized.
Support Vector Machines (SVM)
This classification algorithm is based on projections onto a vector that is composed of the sum of particulars vectors denominated support vectors. It follows that the projection of any sample vector u onto the decision vector w has to be greater or lower than a constraint b.

The decision vector must be orthogonal to the hyperplane which separates the classes. In order to achieve a good performance with this classifier, the width of the gap that separates classes must be maximized. After some algebra21, the width of the gap to maximize is as follows:

as a matter of fact, to maximize the width of the gap it is necessary to minimize the magnitude of w. Applying the Lagrange's method for optimization problems it is found that the decision vector has to be:
in this equation, the vector xi is the group of samples vectors used for creating the decision vector w, they are called support vectors. The others are parameters, such as αi which is the Lagrange multiplier and yi is a parameter that indicate the class at which the support vector belongs. This classifier was used with a kernel function of type linear. The cost parameter (C) was trained using cross-validation. The formulation of C-Support vector classification (C-SVC) was used. Prior to the classification, training data were centered and scaled between [-1, 1]. For a fair validation, test data was also centered using the parameters learned over the training data24.
Results and discussion
Average of the spectrogram of single trials, for all electrodes and each classes in subject 4 is shown in Figure 2 as an example of the features extracted using STFT. It is observed that the magnitude of the spectrum decreases at the electrode C3 around 10 Hz and 20 Hz when the subject execute the motor imagery task corresponding to the movement of the right hand. Similar activity is observed at electrode C4 in the same frequency bands when the subject executes the imagination activity referring to the left hand movement. This phenomena is observed across subjects and is termed in the literature Event Related De-synchronization (ERD). Based on this, the feature vector is composed of the average activity across time (between 3.5 to 5.5 secs) for each individual frequency. That is, the feature vector represent the power in each frequency band during 2 seconds after the beginning of the motor task. The size of the feature vector is defined by the frequency resolution used in the calculation of STFT. In this work a frequency resolution of 1Hz was used and the frequencies of interest are in the range of 2 Hz to 30 Hz. This gives a features vector of 29 elements per electrode, which sum to a total of 87 features. Following the feature extraction, PCA and SFS (see Methods section) were tested for dimensionality reduction. These method aim to retain most of the information present in the feature vector but in a compact way. This is important because reducing the number of features avoid over fitting of the classifier.

Training and testing were implemented using a five-fold cross-validation procedure. The data was segmented in five folds. Four folds were used for training and one for testing. This is repeated five times giving statistical robustness to the results.
In the case of PCA, the projection to the new space is learned in the training set and used in the testing stage. In the case of SFS, the training set is further divided in 3 sub-folds to learn which features are relevant. Once this is learned, the selection is applied to the testing data.
Classification results using PCA are shown in Table 1. Using the original feature vector results in poor classification performance while using PCA produces a significant increase in the performance. In the case of LDA this can be explained by the nature of the classifier. LDA works under the assumption that the distribution of the features is Gaussian and that the covariance matrix of the feature vector is diagonal. This last condition imply uncorrelated features, a condition that is difficult to fulfill in practical problems. However, PCA projects the data to another space where the components are uncorrelated, that is, the covariance matrix is diagonal.

This makes the data more fitted to the assumptions of LDA and therefore better performance is achieved. In Table 1 the results obtained using SVM are also shown. As SVM is a discriminative method, no assumption is made about the distribution of the data. More important, the classification depends only on the support vectors (see methods) making the algorithm very robust, therefore PCA is not required for achieving good results with SVM.
SFS was also tested for feature selection. Results in Table 2 show the performance of LDA and SVM when SFS is used. Similar performances are observed comparing SFS to PCA in the case of LDA, and SVM does not seem to benefit from feature selection. To test whether the differences using PCA or SFS are significant, a paired t-test was performed. The results show no significant differences (at 0.05 level) between SFS and PCA in LDA or SVM.
While no statistical differences are observed in between methods, SFS has the possibility of providing qualitative information about what features are more important. For instance, the average of the spectrogram for Subject 9 are shown in Figure 3. Note that the frequency band with strongest variation related to the task is outside of the standard definition of Alpha band. Therefore, fixing the features would have produced poor results for this subject. In order to visualize the spatial characteristic of the signals, the best feature selected using SFS was plotted in the scalp for each electrode. This is shown in Figure 4. The left and right images for each subject correspond to the left and right-hand imagination respectively. These topographies are indicative of which electrode is more significant discriminant between classes. To illustrate this in a more particular way, let’s take Subject 1 and 4 as examples. In Subject 1, the electrode Cz has more power or energy in relation to other electrodes, which means that has discriminant information for class one, meanwhile, class two is discriminated by electrode C4. On the other hand, in Subject 4 class one is discriminated by looking at the electrode C3 and the class two conserve the same discriminant electrode as subject one. Moreover, the SFS method selected the frequency bands around the Alpha band as main feature for all subjects. It is worth noting the inverse relationship between class and the hemisphere with strongest activity. The hemisphere with strongest activity is the one with lower power due to the nature of the Alpha rhythm. This inverse relationship is related to the physiology of the neural system where structures in the left hemisphere control the motor functions in the right part of the body and vice-versa. In addition, according to 25, the motor output leads to a continuous rhythmic sub-cortical discharge of neurons. Therefore, depending on the cortex activation, cortical cells would be affected doing the same activity. In this sense, Figure 4 also shows a pattern in all subjects about the location in the scalp of these discharges depending on the current imagination of the hand movement.


It is necessary to note that PCA will also provide a way to determine what is being extracted as main feature. The projection matrix w (see methods section) acts a spatial filter across features. However, given that the method has as priority to accommodate the highest amount of variance in few components, its operation is highly influenced by artifacts occurring in particular frequency bands, if such artifacts contain high amplitude.
Conclusions
In this work, a BCI system able to classify two different types of imaginary motor movement is presented. Feature extraction is performed by Short Time Fourier Transform, providing a representation of the brain signals in the time-frequency domain. Feature selection methods based on Principal Component Analysis and Sequential Forward Selection are implemented and compared as methods for a compact representation of the information available in the EEG signals. After feature selection, machine learning algorithms are used for classification. LDA and SVM were compared as their use in the BCI community is extensive. Results show that it is possible classify the mental imagery of subjects with accuracy above 80%, these results as good as the winner algorithm of the BCI competition IV26. Also, LDA obtain more benefits from the feature selection than SVM. This is mainly due to the nature of the classifiers. LDA makes assumptions that are not usually fulfilled in real data (Gaussianity and uncorrelated features) which affect the performance of the system. SVM on the other side can deal with non-Gaussian data and is less affected the size of the feature vector that are input to the classifiers. Beyond the performance obtained, information about the spatial characteristics of the brain activity were obtained by plotting the topographical distribution of the more important features detected by SFS.
Our future work will involve adding new features to the system that could improve the performance. Some features to consider would be the difference of the instantaneous phase of signals and the relationships among different frequencies and electrodes.

