


 nueva página del texto (beta)
 Inglés (pdf)
 Artículo en XML
 Referencias del artículo
 Enviar artículo por email
 Citado por SciELO
  Similares en
SciELO
Similares en
SciELO 
 Permalink
I. Introduction
Osteoarthritis (OA) is a high incidence disease that brings poor quality of life of many people in the industrialized world. Pain is the most common and incapacitating symptom of knee OA1-3, this disease affects more than 1 in 10 adults over 60 years only in the United States4, is one most common form of arthritis in the industrialized world, the lifestyle and age of the general population are factors of an increment in the knee OA cases5-8. OA remains still poorly understood9. For a better study and understanding of pain etiology, the Osteoarthritis Initiative (OAI) has been recollecting thousands of clinical data (features) in OA patients; all these features bring important information about the stages of the pain, and other subject characteristics. In order to diagnose OA, medical imaging is a very important tool, is the most common first-hand information, using different radiological techniques as Magnetic Resonance Imaging (MRI) or X-ray imaging, it is possible to obtain a good approach of the OA stage10. Some literature11-13, suggest that it is possible to obtain better results using MRI than X-ray imaging, this is because the nature of the image itself. Nevertheless, there are others based on both, X-ray and MRI5, 14-16, and taking advantage of the features obtained from each kind of images.
It is important to take into account that in emerging countries the first approach to diagnose knee OA is X-ray imaging, in early stages of OA the use of MRI images in an exploratory stage is not allowed by the monetary cost to the public health systems, or the patient itself. This is an important reason to develop a robust diagnostic method based on a very extended imaging tool, the X-ray imaging technology.
Since Kellgren and Lawrence (K&L) introduced their assessment scale of knee OA17. This has been adopted as a standard in many health systems and OA studies around the world. Over the years, there have been some similar approaches, such as the one presented by the Osteoarthritis Research Society International (OARSI)18. These two scores are extensively used. So, a biomarker based on image measures is an important task. It is common to associate the Joint Space Width (JSW) with OA stages18, 19 this measurement helps to see the density of the cartilage and the loss of it, and the presence of osteophytes. The two most important scores are proved to be effective in the diagnosis and classification of the disease.
It is a challenge to correlate the features extracted with the help of scores from medical images and OA symptoms.20-22 As we have detailed, this feature is a very important tool to diagnose the disease, but it’s not clear yet how it will help to explain some of the symptoms.
The objective of this work is to determine if a correlation exists between the features obtained from two of the most common radiological grading scales and the symptom that most affects the quality of life, pain. This represents a first step in developing a biomarker that predicts knee pain caused by OA.
In the work of Galván et al. presents a search for the association between knee osteoarthritis and pain, developing a multivariate model based on elastic nets using semi-automatic measures with the purpose to predict future pain developed by knee osteoarthritis23, and as in this work, it is proposed an initial biomarker developed by the same patients; however, here is presented a methodology based on genetic algorithms looking for the relation of the progression of pain caused by knee osteoarthritis.
The exploratory computational analysis of medical data can contribute to understanding better some diseases, prevent some disorders associated with early stages in some risk subjects. This can contribute to the improvement of health systems around the world. Computational statistics and Bioinformatics tools can be a powerful way to find some unexpected connections between some subjects characteristics and symptoms of a certain disease 24-26. This paper is organized as follows. After this introduction, our subject selection methodology is described in section II. In section III we present the statistical analysis of the data. Our results is presented in section IV. In section V all the discussion is presented. Finally, our conclusions and future work are presented in section VI and VII.
II. Methods
OAI is a multi-center, longitudinal, prospective observational study of knee OA. The OAI will establish and maintain a natural history database for OA that will include clinical evaluation data, radiological (X-ray and magnetic resonance) images, and a bio-specimen repository from 4796 men and women ages 45 to 79 enrolled between February 2004 and May 2006.
Datasets used in this work were: ’Central Assessment of Longitudinal Knee X-rays for Quantitative JSW’ ver. 1.6, from which quantitative data were obtained; ’Central Reading of Knee X-rays for K L Grade and Individual Radiographic F eatures of Knee’ ver. 1.6, from which semi-quantitative data were obtained; and ’Right knee symptom status’, from which the predicted variable, pain, was obtained. This information was pre-analyzed by two different radiologist groups associated to the OAI. One group evaluated the images using the OARSI quantitative grading scale26, 27 and the other the semi-quantitative K L grading scale17, 27.
Only subjects with no radiological missing data were included in this study. The criteria for inclusion was not presenting pain as a symptom, not presenting a symptomatic status, and taking no pain medication at the baseline visit.
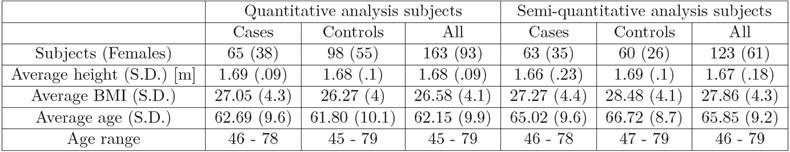
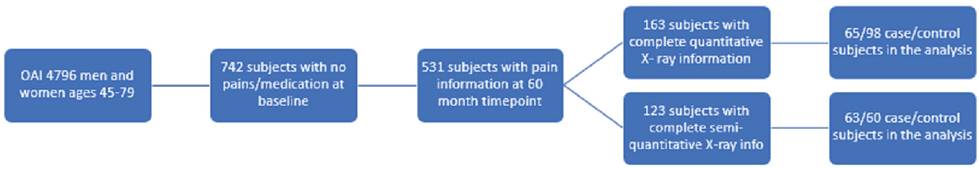
All control case should accomplish the inclusion criteria. From these, subjects having pain as a chronic symptom at some point in time, after their baseline and up to their 60-month visit were considered cases. The rest, the ones with no pain and no pain medicated from their baseline until their 60 month visit, were considered controls. Two different sets of subjects were selected according to the radiological data, one set for the quantitative analysis, and a second set for the semi-quantitative analysis. The demographic information of both sets is shown in Table 1 . For each one of these analyses, three sets of data were generated, T0, T-1, T-2. In Figure 1 a scheme of subject selection is presented.
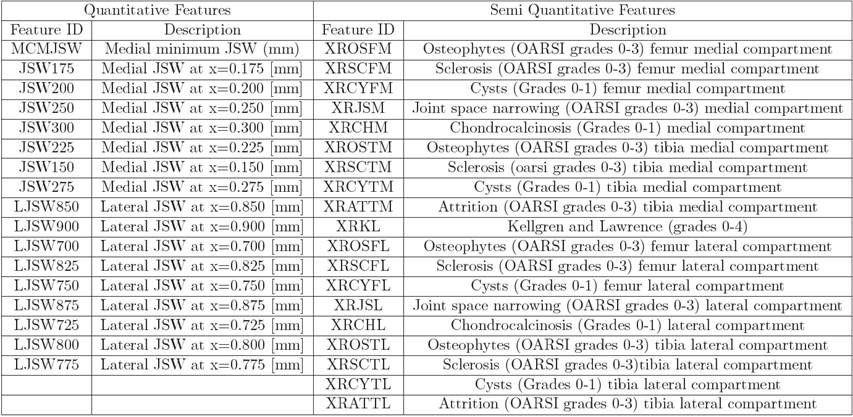
For T0, using the information about the first appearance of pain as a symptom, data were analyzed using the 60-month pain information as the outcome variable, T-1 analyzes the data a year before the pain appeared, T-2 analyzes the information two years before the pain appeared. The former included the radiological information measured at the timepoint the pain appeared as a symptom, and the latter, the information measured one year prior to the event. Seventeen quantitative and nineteen semi-quantitative features were measured in right knee radiographs, and their description is shown in Table 2. In order to avoid the bias caused by the different sizes of the knees between men and women (since men are generally taller), all image features from the quantitative datasets went through a height and gender adjustment using a linear regression as presented in equation 1:
 (1)
(1)
Where JSW adj represents the adjusted measurement, JSW is the original measurement, and b0, b1 and b2 are the coefficients obtained from the linear regression. The values assigned to the Gender variable were 0 for males and 1 for females. The data collected was Z normalized using the rank-based inverse normal transform28.
III. Statistical analysis
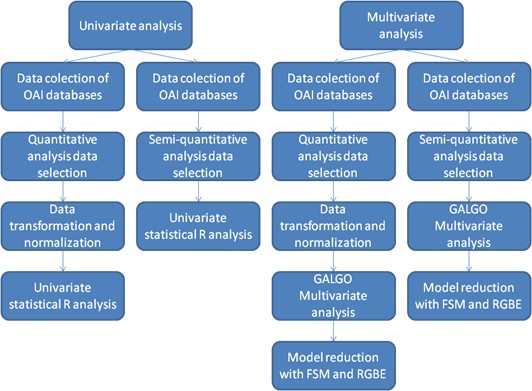
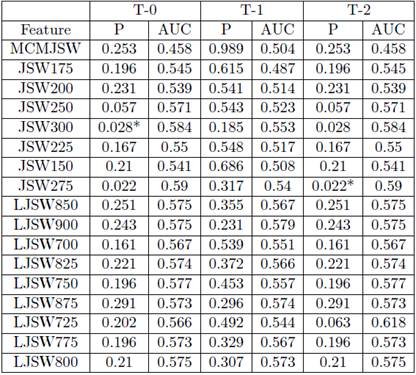
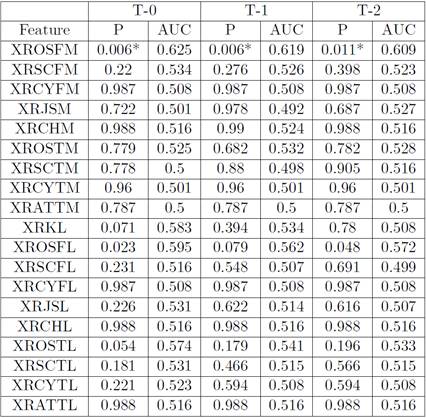
After data transformations and normalizations, six univariate searches were performed, T0, T-1, and T-2 in both quantitative and semi-quantitative scores. A logistic regression was used as a cost function in the univariate analysis, 60 month pain symptom was used as the outcome variable (0 indicates no pain, 1 indicates pain presence). After performing the logistic regression P values and the area under the Receiver Operating Characteristic curve (AUC) was calculated on each feature.
After the univariate analysis, the multivariate searches were then performed for each score, using the T0, T-1 and the T-2 data. For all searches, the 60-month visit pain information was used as the outcome. These searches were performed using Galgo29, a multivariate feature selection strategy based on genetic algorithms. The algorithm was set to return 600 predictive logistic regression models, with 5 features each. Each one of these models evolved throughout 200 generations, replicating, recombining and mutating from a set of models with random features, optimizing for its accuracy, obtained using a 3-fold cross validation with a 2/3-1/3 train-test proportion. Features were then ranked according to their frequency in the 600 models, and using such rank, a Forward Selection strategy was carried out, prompting a new predictive model. Finally, the size of this model was reduced by using a robust gene Backward feature elimination algorithm, in which features were removed if their contribution to the accuracy of the model, measured using the same cross-validation strategy, was negligible. AU C and Odd ratios were measured in the final model obtained in each of the 6 searches. All statistical analysis was done using R software. R is a free software environment for statistical computing and graphics30. In Figure 2 a scheme of the statistical analysis is presented.
IV. Experiments and results
The univariate analysis in quantitative data showed no statistical association between image features and future pain, in Table 3 the statistical information is presented. In semi quantitative data, the XROSF M is presented a significant P-Value, in Table 4 the statistical information about the analysis presented.
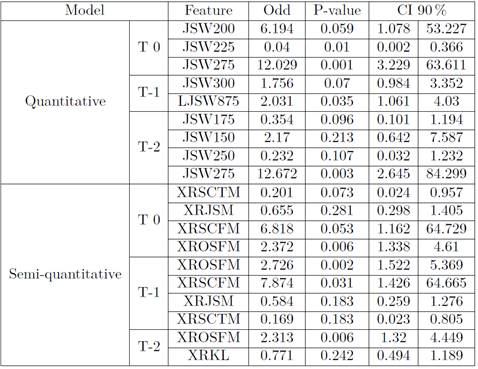
In multivariate analysis, for quantitative data: T0 information, the final model was a three-feature model with an AUC of 0.6516, T-1 information the final model was a two-feature model with an AUC of 0.6174, T-2 information the final model was a four-feature model with an AUC of 0.6737.
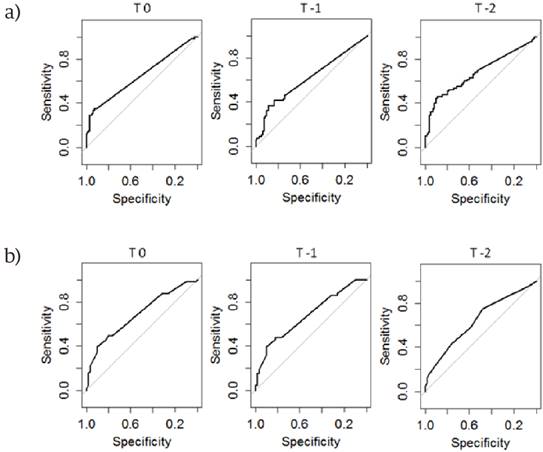
For semi-quantitative data: T0 information the final model was a four-variable model with an AUC of 0.6865, T-1 information the final model was a two-feature model with an AUC of 0.6486, T-2 information the final model was a two-feature model with an AUC of 0.6406. In Table 5 the statistical information of 6 models is presented. In Figure 3 a) and 3 b) the ROC curve of the models are presented.
V. Discussion
Unlike other cross-sectional studies1, 14, 20, this study takes into account the time of incidence of chronic pain in the right knee as starting point. This with the intention to diminish the bias due to the difference in arrival of symptoms in patients included in the experiment.
We have produced a better OA prediction and diagnosis using statistical and computational models. It is evident from results that the use of multivariate models increases the predictive power of measurements obtained by knee X-rays.
Based on the results presented in Table 3 and Table 4, it is evident that variables associated with cartilage loss do not have a predictive capability by themselves.
Variables related with measurements based on scores do not show a tendency. Instead of that, they show a statistical significance individually. These variables are related to early changes in bone structure, such as osteophytes31. Moreover, the results presented in Table 5 show that multivariate analysis and variables based on semi quantitative measurements, could be used for a possible prediction and diagnosis.
According to our study, early appearance of cartilage loss in medial knee, coupled with the early onset of changes in bone structure (osteophytes) may be associated with future chronic pain in the right knee32, 33. The weaknesses of this study are given in the number of subjects, due to the selection criteria, many of the subjects had to be discarded. On the other hand, maintaining control subjects makes our models more robust. Since similar works do not include such controls. The results are relevant and consistent with expectations from the clinical point of view. We can consider adding other risk factors in order to diagnosis or timely forecast OA.
From the computational point of view, the use of stochastic methods such as genetic algorithms, allow us to explore a large amount of information and be able to build robust and small enough models in order to classify the characteristics of a disease. The use of these tools is growing in medical science worldwide, and use of computing power, and optimization algorithms are one of the options for the study of chronic degenerative diseases such as the OA34.
VI. Conclusions
The results suggest that some early radiological features can be associated with OA symptoms. It is possible to achieve future pain prediction with multivariate models based on X-ray features. The association of future pain with X-ray features can be used to develop a prevention strategy for chronic pain. The public health systems could take advantage of the use of radiological biomarkers.
Besides that, computational analysis of data sets can be very helpful to develop image-based biomarkers, due to its nature, this analysis can manage big data sets and perform millions of operations to correlate some features/situations of subjects with disease symptoms in order to have a better and faster diagnosis.
The present study shows a close relation between the X-ray based models obtained with the multivariate regression and the develop of clinical pain associated with the disease, which strongly suggest the feasibility of a biomarker based in those features.
This biomarker can be used to aid the radiologist in the process of diagnose the patient or as a second opinion. Also, these models can be used with common technology (X-rays). So, it can be easily used in developing countries, in which access to high level health care systems is very restricted.
VII. Future work
In future work, a relationship between the X-ray features and clinical data will be explored. Using different bioinformatics and medical statistics tools, a combination of clinical and radiological features can be searched to obtain a robust biomarker. Also, the use of image registration will be explored as a predictor of future knee pain. Since access to the high-level health care system is very restricted. Then, using the new available information in OAI databases, a larger study will be explored, up to five years prior to pain incidence.
In the other hand, an exploration of left knee in combination with the right knee information can be useful to obtain a better predictor based on multivariate models. This option will be tackled with OAI databases and clinical information.
Finally, it’s proposed a data recompilation from Mexican patients for future studies, looking for the comparison between the results obtained in this work and the results obtained with the information of the Mexican phenotype, since the demography is a significant feature in the patients’ studies.

