


 nova página do texto(beta)
 Inglês (pdf)
 Artigo em XML
 Referências do artigo
 Enviar este artigo por email
 Citado por SciELO
  Similares em
SciELO
Similares em
SciELO 
 Permalink
Introduction
The main goal of brain machine interfaces (BMIs) is to provide a technological device in order to improve communication between brain and environment. According to the pathway of the neural information, BMIs are divided in efferent, afferent and bidirectional [1]. The first ones use neural information to decode motor intent, the extracted data is used afterwards to command an artificial actuator [2]. A efferent BMIs sense physical quantities from the environment and use such information to induce a stimulation in the brain (e.g. electrical microstimulation) [3,4]. Bidirectional BMIs are able to decode motor intention and encode sensory information to exchange it with the brain in a closed loop approach [5]. Nowadays BMIs are used in a wide variety of applications, from entertainment [6,7] to therapeutics [8,9]. In the field of therapeutic applications, BMIs are assistive devices that enable patients with severe motor impairments to control external actuators such as prostheses, orthoses or exoskeletons [10].
The restoration of locomotion in patients with lower-limb impairments using BCIs is a scientific and technological challenge. Currently one of the paradigms is to provide lower limb wearable robots for physical movement assistance and rehabilitation such as disabled people can recover their locomotion capabilities [11,12]. According to the efferent BMIs, the main idea is that the assistive device could be able to interpret the motion intention of the patient and carried it out. The understanding of the neural activity during human locomotion is the key for the interpretation of voluntary motion which has been widely studied in recent years. Two approaches have been proposed: (i) classification of time and/or frequency features from electroencephalographic (EEG) recordings [13,14], and (ii) decoding of kinematic variables from the lower limbs from time-variant EEG frequency features [15-17]. Both schemes have been used to interpret EEG data mainly during well-controlled walking protocols [18-21].
Although time and frequency features of EEG have provided useful information to understand neural activity, current advances in Neuroscience have pointed out that human locomotion involves a highly complex neural control in various locations of the central nervous system, including the planing and initiation in supraespinal areas (cortex, basal ganglia, midbrain and hindbrain) as well as timings and patterns of locomotor movements at spinal cord [22]. At this point emerges the interest in knowing the spatial behavior of the neural activity. This has two main purposes, to obtain information about the user motion intention and, allowing in this way that assistive devices can reproduce more precisely the human movement. In order to deal with spatial analysis of the neural activity in locomotion, in this work it is proposed a study of the neural connectivity during locomotion, including speed changes, in order to seek spatial patterns and their evolution that allows us to classify motion tasks.
Here, connectivity is studied through the coherence analysis, because is a widely used methodology in different fields of Neuroscience [23-25], when functional connectivity between regions of the brain must be evaluated, and it can be useful to identify neuroanatomical and neurophysiological factors in EEG signals [26]. Also, the connectivity dynamics during locomotion is evaluated via the graphs associated to the respective coherence matrices. The paper is organized as follows. The experimental protocol along with the connectivity analysis is described in Methodology section. Next, connectivity results and their statistical analysis are presented in the Results section. Finally, in the last section a brief discussion and the main conclusions of this work are presented.
Methodology
Experimental Control
A set of locomotion tasks were performed with three healthy research subjects, that did not present neuromotor pathologies in their lower limbs. All participants gave their consent before the experiment. The experiment consisted in a controlled walk on a treadmill (XTERRA® trail racer 3.0) at two different velocities. The treadmill is set at velocity 1 (V 1) and the subject start to walk; at this velocity (3 mph) the subjects should feel comfortable. After a minute in V 1 the treadmill velocity is changed to V 2 (5 mph). The transition time (T 1) where an acceleration occurs is the time interval between V 1 and V 2. After a minute in V 2 the treadmill velocity changes back to V 1. The transition time (T 2) where a deceleration occurs is the time between V 2 and V 1. Finally, the subject remains walking in V 1 for a minute. After that, the treadmill is stopped and the EEG acquisition is turned off after 15 second in idle state. This procedure was repeated ten times for each subject under examination, considering comfortable resting periods between trials.
The acquisition of the EEG signals was carried out by the B-Alert® X10 from Advanced Brain Monitoring, Inc. The system has nine electrodes according to the international 10-20 system (Fz, F3, F4, Cz, C3, C4, POz, P3 and P4), and its sampling frequency is 256 Hz. The signal pre-processing (low and high frequencies noise filtering, and artifacts) was carried out by the inner filters of the acquisition system.
Figure 1 shows the electrode distribution of the EEG equipment, according to the International 10-20 electrode placement system (left), and the research subject wearing the equipment (right). In order to study the neural connectivity, the spectral content of the EEG recordings at each electrode are analyzed. According to literature, changes in the α (8-13 Hz) and β (13-30 Hz) bands of neural activity have been observed during motion tasks [27]. Both bands were filtered using 5-order Chebyshev band-pass filters that were implemented in Matlab®.
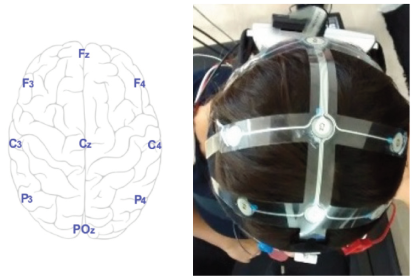
Figure 1: The neural activity is recorded with the B-Alert® X10 from Advanced Brain Monitoring, Inc. The electrode distribution is according to the International Standard 10-20 system.
Coherence is a frequency function that measures the statistical interrelation of two signals through several coefficients in the frequency domain. Coherence coefficients are normalized between 0 and 1 [26,28]. In order to determine connectivity between electrodes the spectral coherence was calculated in frequency domain ω, defined by:
where S XX and S YY define the auto-spectra densities of the X and Y time series, S XY defines the cross-spectrum density of both signals.
The result of Equation (1) is a set of coherence values in a frequency interval. When the coherence between electrodes is calculated, it is possible to group such sets in a symmetric matrix of dimension n×n, where n is the number of electrodes. In this case, the average coherence value is obtained among the range of the Nyquist frequency
In this manner, a symmetric matrix C of dimension n × n is obtained, where C coefficients determine the electrodes’s interrelations. However, from C the most important is know how relevant is the relation of each electrode respect to others. This is obtained by the average of the columns of C, i.e.,
where
In order to analyze the statistical data of the connectivity, an intra-subject one-way ANOVA was carried out by Minitab R 17. The analysis was organized as follows: the connectivity coefficient of the n electrodes per subject, three velocities (V 1, V 2 and V 1) and two transition (T 1 and T 2 ) stages that were repeated 10 times by each subject. The null hypothesis considers that the five stages means are equal, while in the alternative hypothesis considers that at least one mean is different from the others. The significance level are set at α = 0.05. The same assumptions made for meas are considered to analyze the variance of variables among the trials.
Graphs
The coherence is analyzed in pairs of electrodes, this is, the coherence value represents the connection weight between them. Therefore, the matrix C can be represented by a connectivity graph. According to the Graph Theory, a graph G is an ordered triad (V, E, Ψ) which consist of a not empty set V of vertices, an E set of edges, and an incidence function Ψ : E −→ V . For each edge the following condition holds: Ψ associates the edge e to a pair of vertices of V , Ψ(e) = u, v [29]. In this work the adjacent matrix of a graph G with a set of vertices V (electrodes) is the square matrix C = C(G) of dimension n × n. Each element c ij of this matrix ranges in [0.5, 1] if v i , v j belongs to E, elsewhere zero. Matrix C is symmetric with the null diagonal. The grade of vertex v i is d(v i ), and it is defined as the number of c ij ≥ 0,5 in each row (or column).
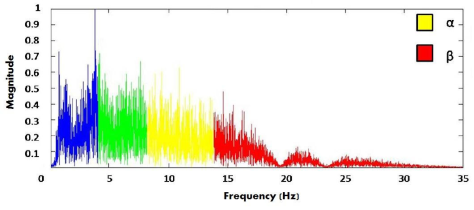
Figure 2: Frequency spectrum of a neural signal. The α (8-13 Hz) and β (13-30 Hz) bands provides information about the neural activity during motion activities [27].
The one-way ANOVA results (F and p values) for the three research subjects are the following: Subject 1 (F = 11.31, p ≈ 0.000), Subject 2 (F = 9.84, p ≈ 0.000) and Subject 3 (F = 16.47, p ≈ 0.000). This implies that significant differences (inside the 95 % Confidence Interval) were found among the means of velocity (V 1, V 2 and V 1) and transition stages (T 1 and T 2) at each subject. The statistical parameters of the coherence in α-band are summarized in Table 1, whereas Table 2 shows the statistical parameters of coherence in β-band. In both tables, the number of samples is defined as the average connectivity degree computed from data of α and β bands for each motion task.
Table 1: Results from statistical analysis of c in α-band: mean, standard deviation and confidence interval intra-subjects (CI).
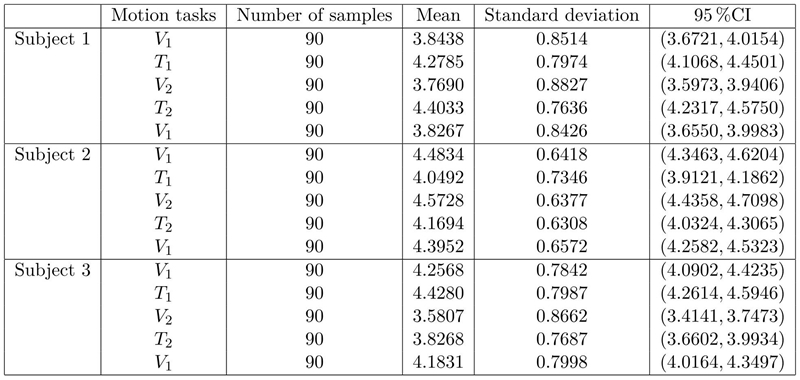
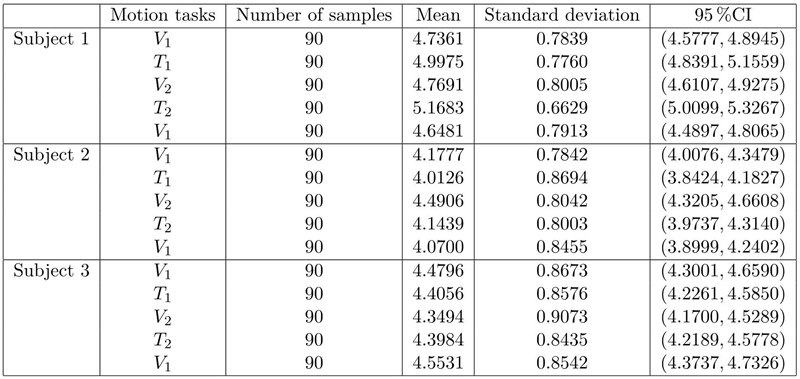
Table 2: Results from statistical analysis of c in β-band: mean, standard deviation and confidence interval intra-subjets (CI).
Additional to the results presented in Tables 1 and 2, Figure 3, 4 and 5 show the average and standard deviation of the filtered signals in the α-band (A) and β-band (B) for each of the three research subjects. In these figures, the dark-blue boxes include the means and variance of the average connectivity degree of each of the nine electrodes c i (horizontal axes) in each motion task described in the experimental protocol. More precisely, the first light-blue box represents velocity 1 (V 1), the second light-blue box is velocity 2 (V 2), whereas the third light-blue box is the V 1 again. The transition between V 1 and V 2 is the first white box (T 1) and the transition between V 2 and V 1 is the second white box (T 2).
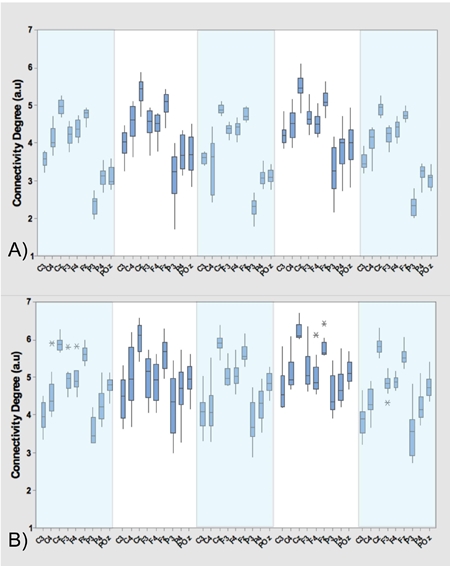
Figure 3: Analysis of data of Subject 1. Mean and standard deviation of ci during the motion tasks, that is, velocities V1, V2 (dark-blue boxes) and transitions T1 and T2 (light-blue boxes). The analysis includes α (A) and β (B) bands.
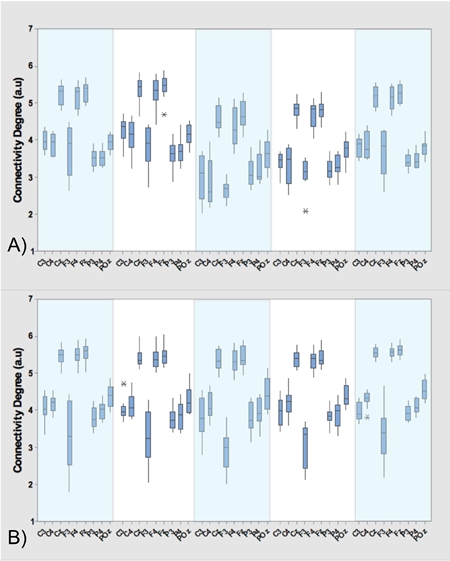
Figure 4: Analysis of data of Subject 2. mean and standard deviation of ci during the motion tasks, that is, velocities V1, V2 (dark-blue boxes) and transitions T1 and T2 (light-blue boxes). The analysis includes α (A) and β (B) bands.

Electrodes connectivity
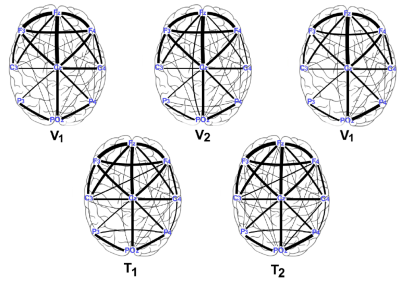
A graph was construct in order to observe the connectivity dynamics between electrodes, during the motion tasks (both, velocities and transitions). Based on the statistical analysis of the intra-subject result, an average graph at each of the five motion tasks (V 1, T 1, V 2, T 2 V 1), considering the three research subject and the ten performed trials. Figure 6 shows the topological structure of such graphs considering α-band of the EEG signal of each electrode. On the Figure 7 the graphs of β-band are shown.
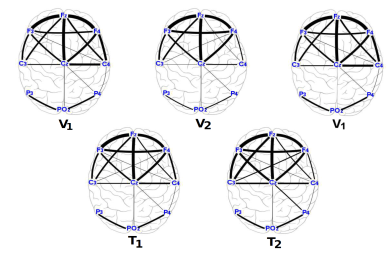
Figure 6: Connectivity graphs of the motion tasks for the average date of the three research subjects in α-band.
Discussion
As it was presented in Figure 3.A, Figure 4.A, Figure 5.A and Tables 1 and 2, the means of the motion tasks differ among them significantly; most precisely, means of velocity stages differ from means of transition stages while means of the same-kind stage (velocity/transition) do not differ in Subject 1 and 2, i.e. means are very close. A particular behavior is presented in Subject 3, where also significant differences between means of the same stage are present i.e. V 2 mean differs from both inicial V 1 and final V 1 means while T 1 mean differs from T 2 mean.
In general, an increment in the neural activity is reported (by the suppression of activity in α and β bands) over the cortical sensorimotor areas, which correspond to the lower limb control areas during locomotion, in comparison to imagery locomotion. On the other hand, there is a suppression of the α and β bands in the premotor and sensorimotor areas during locomotion, contrary to resting state such as it was previously reported in [18,20].
From the statistics of the coherence analysis, it can be shown that the α-band (Figure 3.A, Figure 4.A and Figure 5.A) provides more information than the β-band (Figure 3.B, Figure 4.B and Figure 5.B) regarding connectivity dynamics in each of the motion tasks. Figures 3-5 show that the electrode C z is the most reliable in all the activities, preserving its behavior between the three research subjects. To identify a reliable electrode gives the possibility of use its data as command control in BMIs applications. Regarding the spatial analysis of the connectivity, Figures 6 and 7 show that during the transitions the connectivity between electrodes tends to increase, while the connectivity during speed periods decreases. Moreover, the topology of V 1 is preserved independently disregarding which transition occurred. Although during V 2 the connection pattern holds, the connectivity grade increases in both bands (see Figure 6 and 7). These results are in concordance with the literature regarding EEG features during locomotion, but the graph dynamics shows the neural connectivity changes.
Conclusion
The use of the neural information from EEG signals is useful in BMIs application to interpret user motion intention. In this work it is shown that, along the frequency features of the signal, it is possible to find spatial patterns to classify locomotion tasks. In this manner, the connectivity analysis alongside graphs provides reliable information about the spatio-temporal characteristics in the neural activity, where dynamical evolution of the pattern during locomotions tasks is shown (see Figure 6 and 7). For BMIs applications it is important to find patterns that hold between subjects, as it was shown in this work. The role of the subject differences, as well as to include more variables in the experimental protocol such as treadmill angle and more walking speeds would be of interest in future works.
In general we have observed that differences among motion tasks can be detected from connectivity coeffcients such as coherence. The connectivity patterns in V 1, V 2, T 1 and T 2 are spatial characteristics of the neural activities for these well-defined locomotion tasks, and they can be quantified and validated by the statistical analysis of the average of the connectivity degree (c) along the full-locomotion trail, which includes the five motions tasks. Thus, the results also provide the time-evolution of the characterized spatial patterns. The proposed approach provides a quantitative analysis to find differences among motion tasks in order to show that is possible to use them as inputs of a BMI system.

