


 nueva página del texto (beta)
 Inglés (pdf)
 Artículo en XML
 Referencias del artículo
 Enviar artículo por email
 Citado por SciELO
  Similares en
SciELO
Similares en
SciELO 
 Permalink
Introduction
Respiratory rate (RR) is one of the basic physiological parameters that can help to assess the health condition of a subject. Several works have proposed different methods for detecting the breathing waveform and have estimated parameters of interest related to the ventilation of the subject 1-3. Nasal thermistor is a well- known and accurate method for recording the respiratory phase, which reacts to variations in air temperature 4. Formerly, this method was used for assessing respiratory patterns and nocturnal events in studies aimed to diagnose sleep disorders 5. Nowadays, it is still a reference in several polysomnographic studies in the diagnosis of obstructive sleep apnea (6, 7).
Resistive sensors, as thermistors, conveniently are set in voltage dividers or in a Wheatstone bridge, which are suited for sensors with large resistance variations and nonlinear response 8. With an appropriate configuration, it is possible to linearize the response of such sensors with circuits that provides an output voltage (or current) that depends on both the resistance variations of the sensor and the supply voltage (or current). In these conventional circuits, it is necessary some analog signal processing stages to adapt the voltage range to that of the analog-to-digital converter (ADC). Furthermore, the polarization stage can cause a self-heating problem, increasing the uncertainty of the measurement process. To enhance resolution, it has been proposed synchronous demodulation, which adds extra processing stages on the measurement system 9.
This paper proposes a novel system based on a direct sensor-to-microcontroller (μC) interface circuit (time-modulated circuit). The system is implemented by a thermistor in a Wheatstone quarter-bridge topology directly connected to a μC without any analog processing circuits, nor ADC; which results in a compact solution to detect temperature variations. Such a direct interface circuit relies on measuring the discharging time of a RC network that includes the resistances of the sensor bridge, and by means of a time-based equation, it is possible to estimate the fractional resistance change x (∆R/R 0) of the sensor 10.
In order to demonstrate the feasibility of the proposed method, we used the well- known nasal thermistor technique to detect the breathing by measuring the thermal fluctuations near the nostrils of several subjects. Although the proposed method has been successfully applied to piezoresistive and magnetoresistive sensors in full and half-bridge topologies 11, 12 to detect DC or quasi-DC signals, at the best of our knowledge, such method has not been used to sense AC magnitudes (such as respiratory rate), which could be extended to other medical applications.
Sensing approach
Thermistor description
In order to detect the temperature variations near the nostrils, it is necessary to know the thermistor characteristics (e.g., sensitivity and time response). Commonly, a normal breathing of an adult subject is between 12 and 15 breaths per minute, that is, a bandwidth up of 0.25 Hz 13. Temperature fluctuations (∆T) due to the subject breath depend on the environmental temperature, and it rarely exceeds 20 °C if the surrounding temperature is 13 °C 14, 15. In order to obtain a breathing waveform to estimate the RR, we considered that the system must be able, in principle, to have a resolution of 0.5 °C.
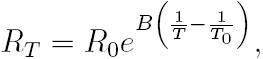
The thermistor used in this study is the NTCLE305E4202SB (VISHAY). It has a negative temperature coefficient (NTC), and the resistance R T at any temperature T (over a 50 °C span) can be determined by an exponential law 8:
 (1)
(1)
where B is the characteristic temperature of the material, R0 is the resistance of the thermistor at a reference temperature T0 , usually 25 °C. Here, we considered a temperature span of 25 °C (15 °C - 40 °C) where the relative sensitivity of the thermistor (α) has a nonlinear dependence on T:
 (2)
(2)
From (2), α15 = -4.23 %/K, α25 = -3.95 %/K α40 = - 3.58 %/K, which corresponds to a maximal relative non-linearity error of 15 % (calculated from the best-fit straight line). Theoretically, for a temperature resolution of 0.5 °C, the fractional resistance change of the thermistor must be 2 % (x = 0.02), which implies an effective resolution of 6 bit. According to 10, the method used to measure x has an effective resolution of 8 bit for a measuring time of 10 ms, and it has a theoretical resolution of 0.1 °C. Nonlinear errors modify the shape of the temperature variations, but not the estimation of the RR 16. A thermistor behaves as low-pass filter, and the bandwidth depends on the thermal constant τs. Thus, a high value in τs can produce a time delay in the estimation of the RR. Commonly, τs is often provided by the manufacturer, but under specific conditions; nevertheless, we can estimate τs from a simple experimental setup in order to assert this value. Table 1 shows the basic characteristics given by the manufacturer of the thermistor used.

Fundamentals of the interface circuit
Wheatstone bridges with resistive sensors (quarter-bridge, half-bridge, and full-bridge) can be directly connected to a μC by using time-based measurement circuits that yield a digital output that is proportional to the change of x.
Figure 1 shows a direct interface circuit for resistive bridge sensors, previously analized in 10, 17. In this kind of interface, the resistive bridge is considered a network with one input terminal and three output terminals. To estimate the changes on x, the direct interface circuit performs four discharging times measurements (t d1, t d2, t d3 and t d4) and applies a time-based equation accordingly with the bridge topology 10.

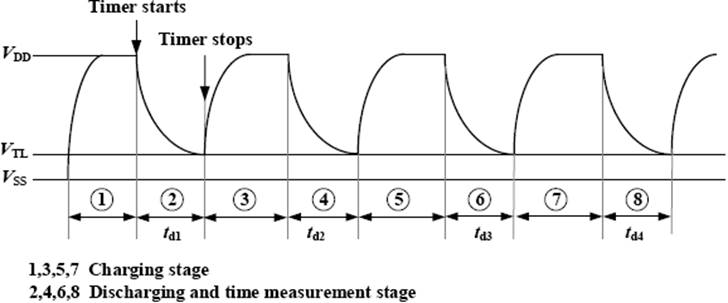
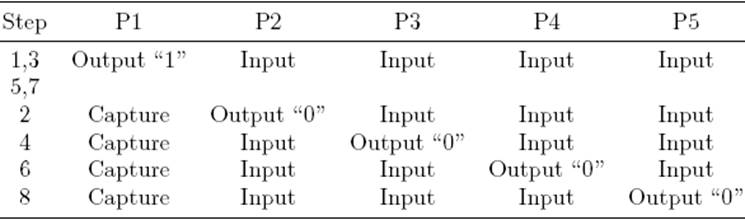
The measurement of each discharging time, t d, involves two stages: (a) charging and (b) discharging and time measurement. First, C is charged through R p (at least 5R pC) towards V DD. Then C is discharged towards V SS (ground reference) through each equivalent resistance, R eqi, between node A and pins P2-P5, respectively, which results in a RC circuit with a time constant τ = Reqi C . During the discharging time, when the voltage across C reaches VTL (low threshold voltage of the Schmitt Trigger (ST) input) on pin P1, the timing process stops. The count of the embedded timer is the digital equivalent to the discharging time t d. Figure 2 shows the voltage waveform across C during the measurement, which is accomplished in eight steps. Table 2 summarizes the μC pins configuration during the measurement sequence.
A quarter-bridge topology is considered when R 1 =R 2 =R 3 =R 0 and R 4 =R 0 (1− x), such a NTC thermistor (Figure 1). In this case, the respective equivalent resistances seen from pins P2-P5 and node A (when the internal resistance R ini of each uC pin are considered) are:
 (3a)
(3a)
 (3b)
(3b)
 (3c)
(3c)
 (3d)
(3d)
In such conditions, the respective discharging time through each equivalent resistance is:
 (4)
(4)
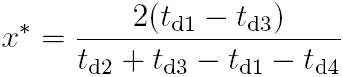
The time-based equation, originally proposed in 10 and improved in 17, to estimate x in a quarter-bridge topology is:
 (5)
(5)
Replacing (3) in (4), and subsequently in (5), yields:
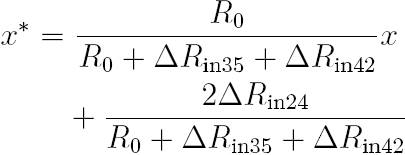 (6)
(6)
Gain and offset errors are small because they depend on the differences between Rini of the μC. For instance, if the internal resistances are equals, the errors will be zero. On the other hand, those errors can be corrected by calibration. The resistance Rp in Figure 1 is included to improve the rejection of power supply interferences in the charging stage 18, 19. R off was included to reduce the effects of R ini17, also this resistance limits the maximal current sunk by each pin during the discharging and time measurement. In 18, 19, there are some design guidelines to improve the performance of the direct interface circuits and therefore the measurement.
Design and implementation
Design of the measurement system
Figure 3 shows the proposed circuit for detecting the breathing. It was implemented by the microcontroller MSP430F123 (Texas Instruments) running at 8 MHz (quartz oscillator clock). So, the embedded 16-bit timer/counter counts the discharge time by incrementing its value each 125 ns. The supply voltage of the μC was V DD = 3.0 V, provided by a dedicated voltage regulator (LF30CV) to reduce power supply interference, which may result in trigger noise 19. The function of P1-P5 (Figure 1) was implemented by P1.2, P3.7, P3.6, P3.3, and P3.2, respectively. A quarter-bridge topology was implemented by R 1 =R 2 =R 3 =R 0 = 2.2 kΩ resistances (with 1 % of tolerance and 50 ppm). The resistance of the NTC at 25 ◦C was close to 2.06 kΩ (see Table 1). The thermistor was placed on R 4 = R 0(1 − x).

To reduce the effects of the internal trigger noise, the μC was set in LPM2 mode. This option disables the CPU but remains in active mode timers and interrupts, while the discharging times are being measured as suggested in 19. The pin P1.2 (external interrupt with ST buffer, capture mode) was configured to interrupt the μC on falling edge every time the discharging C voltage reaches the VTL value. The μC program was written in C language; however, to increase precision in time measurements, the sequences shown in Table 2 were written in assembler language. C was selected to obtain a suitable time constant, τ = R eqi C , for the discharging and time measurement stage. A large τ value implies a slow slew rate of the exponential voltage waveform at the trigger point, which makes the triggering process more susceptible to noise, increasing the count dispersion and the standard deviation of the measurement. In contrast, a too small value of τ yields few counts, giving a large quantization error. Thus, the optimal time constant value was experimentally determined, and it was between 2 and 3 ms 10, 19. Therefore, we selected C = 1 μF, with ±5 % of tolerance and 100 ppm/°C of temperature coefficient. We chose R p = 100 Ω that results in charging times (5R p C) of 500 μs.
The discharging times td 1 , td 2 , td 3 and td 4 were measured, and x was estimated by (5). Then, this value was sent to a PC via RS-232 by a control program in LabVIEWTM . The serial communication interface was implemented by a MAX3223 supplied by a separated voltage regulator (and was set in shutdown mode during the measuring process) to prevent induced transients in the power supply that could affect the discharging process 19.
Measurement protocol
The process to validate the proposed method was done over 23 volunteers (8 women and 15 men), all with distinct physical characteristics: (mean SD: age = (27 8) years; weight = (77 15) kg; height (1.72 0.09) m. We measured thermal fluctuations by placing the thermistor near to the nostrils of each subject. As a reference signal, a piezoelectric sensor LDT1-028K from Measurement Specialties 20, was attached to the chest of each volunteer in order to detect the movements of the thorax on each breathing. Figure 4 depicts the location of each sensor on the subject (a) and the position if the thermistor near the nostrils (b). The signal of the piezoelectric sensor was processed by a charge amplifier with a sensitivity of -212 mV/pC and filtered by a first-order low-pass filter with a corner frequency of 1 Hz.

Figure 4: (a) Location of the sensors on the body during the measurement protocol and (b) position of the thermistor near the nostrils.
The measurements were obtained by two procedures. In the first procedure called “Controlled Breathing”, every subject was asked to breathe following a baseline of an oscilloscope that showed a sinusoidal signal with 1 V peak-to-peak and 0.25 Hz. In the In the second procedure called ``Free Breathing”, the tests were performed while the subjects were breathing at their own rhythm. On each subject, the test was repeated three times with a measurement time of 30 s each test. The signal obtained from nasal thermistor was compared with that obtained from a piezoelectric sensor.
Results and discussion
In the proposed system, the low-pass response is limited by the time response of the thermistor. Figure 5 depicts the fractional resistance of the thermistor as a response to a thermal step input, which was between 23 °C and 9 °C. We obtained τs = 0.8 s, which is suitable for detecting the RR. The nonlinear errors of the thermistor were not considered because we were only interested on the detection of an AC magnitude (temperature fluctuations).

Figure 5: Experimental time response of the thermist NTCLE305E4202SB for a thermal step between 23 °C an 9 °C. The sensor is able to respond in 0.8 s, enough f detecting the breathing-related thermal fluctuations.
Figure 6 shows the signals obtained with the proposed system and with the piezoelectric sensor. Both signals match in the number of breaths and also coincide with the 0.25 Hz of the Controlled Breathing measured during the 30 s.

Figure 6: Controlled Breathing waveform obtained from a nasal thermistor directly connected to a μC (top) and from a piezoelectric film sensor attached to the chest of a volunteer (bottom).
Figures 7 and 8 show the frequency spectrum of the breathing waveforms of two subjects who were asked to breathe at their own rhythm. The signals were obtained with the direct interface circuit. As can be seen, both figures presented remarkable differences. For example, Figure 7 shows a clear peak at 0.3 Hz (18 breaths per minute) while Figure 8 shows a clear peak at 0.16 Hz (10 breath per minute). These results demonstrate that the proposed system is able to detect RR breath-by-breath, and it is also able to detect different breathing rates, Moreover, the frequency spectrum of both signals shows a negligible contribution of noise.

Figure 7: Free Breathing waveform obtained from a nasal thermistor directly connected to a μC (top) and the frequency spectrum showing a clear peak at 0.3 Hz

Figure 8: Free Breathing waveform obtained from a nasal thermistor directly connected to a μC (top) and the frequency spectrum showing a clear peak at 0.16 Hz.
The sensitivity of the proposed method relies on the sensor sensitivity. Since the thermistor is not supplied by any constant voltage or current, self-heating problems are avoided and the sensitivity does not depends on any polarization source, as usually happens in conventional signal conditioning systems.
Figure 9 shows a Bland-Altman plot that compares the RR time interval of the breathing signals, detected from the 23 volunteers with the piezoelectric sensor. The mean bias was 17 ms and the dispersion (whit a 95% confidence interval) was about 303ms, which is practically negligible. Figure 10 shows the scatter plot and the correlation coefficient for the RR time interval, where both were estimated from signals detected with the proposed method and with the piezoelectric sensor. the correlation coefficient for the data on the 23 volunteers was 0.95, which is a statistically significant correlation.

Figure 9: Bland-Altman plot of each RR time interval detected from the signal obtained with the thermistor and with the piezoelectric sensor of the 23 volunteers.

Conclusions
A simple, low-cost and compact system has been implemented for detecting the breathing using a nasal thermistor. The sensor, mounted in a Wheatstone querter-bridge topology, was directly connected to a μC. The temperature fluctuations near the nostrils (due to breathing of the subjects) have been clearly detected. The proposed system did not require the use of any analog processing circuits, nor ADC. The proposed circuit could detected fractional changes in resistance of x > 0.01, which resulted in a resolution of 0.2 °C, enough to follow the breathing-related temperature fluctuations. This achieved well-shaped breathing waveforms, with a negligible noise contribution, from which it is easy to estimate the RR. The system was able to detect the respiration breath-by-breath, just by measuring the discharging time in a capacitor. It was not necessary to supply any voltage or current to the thermistor, so the self-heating was avoided. The methodology proposed in this research can be considered in other medical applications, where the temperature measurement (e.g. the body temperature) could be obtained by a resistive sensor. Bland-Altman and Scatter plots were used to compare de RR time interval between the signal detected with the thermistor and that detected with the piezoelectric sensor.
The calculated mean bias was less than 17 ms, and the dispersion was lower than 303 ms, and correlation coefficient was 0.95, which is statistically significant.

