Servicios Personalizados
Revista
Articulo
 Inglés (pdf)
 Artículo en XML
 Referencias del artículo
 Enviar artículo por email
Indicadores
-
 Citado por SciELO
 -
 Accesos
Links relacionados
-
 Similares en
SciELO
Similares en
SciELO
Compartir

 Permalink
Revista mexicana de ingeniería biomédica
versión On-line ISSN 2395-9126versión impresa ISSN 0188-9532
Rev. mex. ing. bioméd vol.35 no.1 México abr. 2014
Artículo de investigación original
Leukocytes Detection, Classification and Counting in Smears of Peripheral Blood
Detección, Clasificación y Conteo de Leucocitos en Frotis de Sangre Periférica
J. Martínez-Castro* S. Reyes-Cadena** E. Felipe-Riverón *
* Centro de Investigación en Computación. Instituto Politécnico Nacional.
** Instituto Nacional de Rehabilitación.
Correspondencia:
J. Martínez Castro
Centro de Investigación en Computación
Instituto Politécnico Nacional
Av. Juan de Dios Bátiz s/n l
Col. Nueva Industrial Vallejo
Delegación Gustavo A. Madero
C.P 07738, México D.F.
Correo electrónico: jesus.martinez.castro@cic.ipn.mx
Fecha de recepción: 8 de Noviembre de 2013.
Fecha de aceptación: 24 de Marzo de 2014.
ABSTRACT
Using the k-NN classifier in combination with the first Minkowski metric, in addition to techniques of digital image processing, we developed a computational system platform-independent, which is able to identify, to classify and to count five normal types of leukocytes: neutrophils, eosinophils, basophils, monocytes and lymphocytes. It is important to emphasize that this work does not attempt to diferentiate between smears of leukocytes coming from healthy and sick people; this is because most diseases produce a change in the differential count of leukocytes rather than in theirs forms. In the other side, the system could be used in emerging areas such as the topographic hematology and the chronobiology.
Keywords: Automatic classifier of leukocytes, k-NN, Minkowski metric, Pattern recognition, Digital image processing.
RESUMEN
Mediante un clasificador k-NN en combinación con la primera métrica de Minkowski y técnicas de procesamiento digital de imágenes, se desarrolló un sistema computacional independiente de la plataforma, capaz de identificar, clasificar y contar cinco formas normales de leucocitos: neutrófilos, eosinófilos, basófilos, monocitos y linfocitos. Es importante enfatizar que este trabajo no intenta diferenciar entre muestras de leucocitos provenientes de gente sana y enferma, debido a que la mayoría de las enfermedades se detectan principalmente por un cambio en el conteo diferencial de leucocitos más que por cambios en su forma. Finalmente, el contador de leucocitos puede ser usado en áreas emergentes como la hematología topográfica y la cronobiología.
Palabras clave: Clasificador automático de leucocitos, k-NN, Métrica de Minkowski, Reconocimiento de patrones, Procesamiento digital de imágenes.
INTRODUCTION
Hematology is the branch of medical science responsible for the study of the elements integrating the blood as well as their precursors, and the structural and biochemical disorders of these elements that can lead to a disease. The hematologic diseases affect mainly the production of blood and its components, such as the red blood cells (erythrocytes), white blood cells (leukocytes), hemoglobin, plasma, platelets and the mechanism of blood clotting.
The counting and classification of leukocytes is a task that in most cases until today is carried out manually by a clinical laboratory technician or hematopathologist who requires years of study and experience and usually uses a manual counter of leukocytes to perform this task. The repetitive procedure proved to be very tedious and in the long run can cause disruptions in the visual health of the people responsible for this task. Additionally the reliability of the results depends largely on the ability of the person that performs the study.
Fortunately, the science of electronics and computing has moved closer to other branches of knowledge, as it is the case of the hematology, in order to support and provide solutions to the problems they face. These solutions are built, in its majority, based on the introduction of mathematical methods, algorithms and software tools.
There are instruments such as flow cytometer and automatic counting machines that examine white blood cells quantitatively but not qualitatively. Computer-aided automatic analysis not only saves manpower and time, but also reduces the effects of human errors. Up to now, automatic cell classification systems cannot meet the complexity of real clinical demands.
Segmentation subdivides an image into its constituent regions or objects. The level to which the subdivision is carried out depends on the problem being solved. Segmentation should stop when the objects of interest in an application have been isolated [1]. In order to validate segmentation output it is necessary to know the ground truth that is the true features of each object of interest. However, the ground truth in medical imaging is an elusive concept because there is not a clear and absolute way to define it. The only way and often the best option is to have a human expert observer (or more than one) to define the ground truth by generating manual outlines [2]. The final objective of blood cell segmentation is to extract each constituent object and segment every cell into its morphological components such as nucleus, cytoplasm, holes and other organelles [3].
The paper is organized as follows. In the Background, we briefly introduced some general characteristics of leukocytes and their different types. Next, we included an analysis of the antecedents and the state of the art. Then, we described the methodologies carried out in the segmentation of each type of leukocyte. Finally we discuss the results and conclusions of the paper.
BACKGROUND
For our objective, it is interesting to know what constitutes the blood, the unique fluidic tissue of our body. For this, the Hematology is supported by the process of hematopoiesis, that is, the process of production, maturation and growth of the cell lines present in the blood and tissues, in order to be aware of the morphologies and components of the blood cells during the process of maturation and growth. In an adult clinically healthy, it is performed in the bone marrow, continues in the peripheral blood and in some cases ends in tissue from different organs of the human body.
The hematopoiesis presents three major cell lines: The erythrocyte cell line, the leukocyte cell line and finally the megakaryocytic cell line producing platelets. Below we will shortly describe the erythrocyte and leukocyte lines.
Erythrocytes are a-nucleated cells that belong to the series of red blood cells. Its role is to carry out the exchange of gases in the body, i.e. carry oxygen to the body and discard carbon dioxide. The erythrocytes are characterized by a natural pigmentation in reddish tone related to the amount of iron present in the cells.
Leukocytes are cells that represent the main mechanism of the body's defense against infectious processes and inflammatory and allergic reactions. The leukocytes, better known as white blood cells, lack of pigment.
In order to differentiate white blood cells in the microscope, it is needed to process the samples and apply a specific stain. The tincture most frequently employed for dying leukocytes is called Wright and Giemsa. In contrast to the erythrocytes, leukocytes contain abundant cytoplasmic granulations among other characteristics that let us clearly distinguish them from each other. Different types of white blood cells vary in color, granularity and texture, especially in the cytoplasm. However, in many cases leukocytes must be extracted using only the nuclei since the nucleus is a relatively stable structure. In blood smears, the number of red cells is many more than white blood cells. Platelets are smaller particles not clinically so important.
The main goal of this paper is related to those leukocytes present in the peripheral blood; they constitute an important component of the immune system which defends the body against infectious diseases and foreign substances. White blood cells are classified into five main groups: phagocytic polymorph nuclear leukocytes (neutrophils), eosinophils, basophils, mononuclear phagocytes (monocytes) and lymphocytes [4]. Neutrophils, eosinophils and basophils are known as granulocytes, because they present a granulated nucleus, whereas monocytes and lymphocytes present a well-defined one-piece nucleus. On the other hand, neutrophils and eosinophils have a greater size than basophils, and have a clear differentiation in the amount of cytoplasm with respect to the monocytes and lymphocytes.
The objective of this work is to describe a computational system, platform independent, that enables the identification, counting and classification of the five normal forms of leukocytes present in the peripheral blood. Simultaneously, it is intended that the computational system manages in a secure and efficient way the data of users and patients introduced to the system.
To achieve our goal, we digitalized samples of blood and we preprocessed them in order to enhance their quality. Images are initially normalized in size. Then, the processes for the reduction of the additive noise and the contrast improvement are carried out. With this, we can get images of higher quality ready to be analyzed. This work uses color images in the frequently used RGB (Red-Green-Blue) color space.
ANTECEDENTS AND STATE OF THE ART
In recent times there have been efforts to develop computer systems that perform the leukocitary differential count automatically, looking for shorten the waiting times and help to give a more accurate diagnosis as soon as possible and independent of the human factor. Hitherto, automatic cell classification systems cannot meet yet the complexity of real clinical demands. Nevertheless, yet 21% of all processed blood samples still require microscopic review by experts [5].
In 2002 Liao and Deng [6], were the first to introduce a shape analysis for white blood cell segmentation. Through basic segmentation using simple thresholding the borders of white blood cells are identified using a shape analysis step. However, despite the simplicity and effectiveness, this method only applies to circular-shaped white blood cells such as lymphocytes.
An approach that actively selects efficient samples by simulating visual attention [7], uses a two-stage method (bottom-up and top-down) via learning by on-line sampling to automatically segment complex leukocyte images. Adollah et al., in [8], present a review of segmentation methods that have found application in classification in biomedical-image processing especially in blood cell image processing up to 2008.
More recently Ghosh et al. [9] developed an automated leukocyte recognition approach using fuzzy divergence and modified thresholding techniques. They concluded that Cauchy functions provide better segmentation, particularly for leukocyte recognition, in comparison with Gamma function-based divergence. Morphological operators have been developed to detect and classify other objects, i.e. malaria parasites, in infected blood cell images [10].
Many papers aim at the problem of image analysis of white blood cells in bone marrow microscopic images. One of them [11] proposed the use of multispectral imaging techniques with spectral calibration method to acquire device independent images. For image segmentation they applied Support Vector Machines (SVM) directly to the spectrum of each pixel, and sequential minimal optimization algorithm for feature selection to reduce the time of training SVM classifier. The use of a differential evolution algorithm has been used also to segment the leukocytes from the images of mice skin tissue images stained with hematoxylin and eosin [12].
In [13] image processing algorithms are proposed to recognize five types of white blood cells in peripheral blood automatically. First, a method based on Gram-Schmidt orthogonalization is proposed along with a snake algorithm to segment nucleus and cytoplasm of the cells. Then, a variety of features are extracted from the segmented regions. Next, most discriminative features are selected and compared using a Sequential Forward Selection algorithm and performances of two classifiers, Artificial Neural Network and Support Vector Machine.
METHODOLOGY
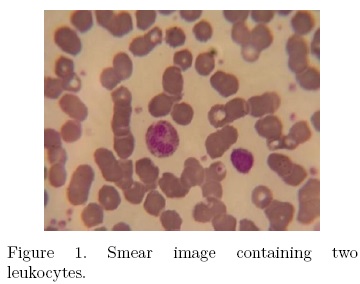
The main objective of the system developed is to identify, count and classify the type of leukocytes present in a digital image of a peripheral blood sample obtained through a microscope (smear). A typical image of it is shown in Fig. 1.
In general, papers dealing with automatic means to isolate leukocytes from erythrocytes and other organelles in peripheral blood are based on the color and size of these objects. The clear difference in color of leukocytes is achieved by using a particular tincture to produce the smear. The task of segmenting them is carried out after the contrast enhancement of the adequately prepared smear and the prior transformation to a gray-level image of the commonly used color RGB image. Now the nuclei and its corresponding membrane are segmented. The objects of interest will be set with nucleus and cytoplasm.
Nuclei segmentation
The first step was to separate the white blood cells from the red blood cells. To segment the nuclei of the leukocytes we used the green channel (G), since in this channel the image presents more details and less additive noise. In this image the nuclei of interest presented a darker grey level than the rest of the objects.
Subsequently, we threshold the image obtained from the previous process by means of an adaptive thresholding of the histogram of the image. The adaptive thresholding [13] is a method that enables us to select the optimal threshold based on the probability distribution of gray levels represented in the histogram of the image. The result of the adaptive thresholding is shown in Fig. 2. Then we used the negative of the image for smoothing the noise and filtering the artifacts.
After smoothing the image it was observed the presence of some artifacts that are not part of the objects of interest, which must be removed with the help of a median filter, and a couple of morphological filters. With this, we obtained an image with the objects of interest more defined (nuclei), Fig. 3. The morphological filters used were the closing (Fig. 3b) and the opening (Fig. 3c), which helped us to strengthen the weak links between objects, increase the definition of forms and remove the small unwanted dark objects; also the contours of the objects were finely smoothed.
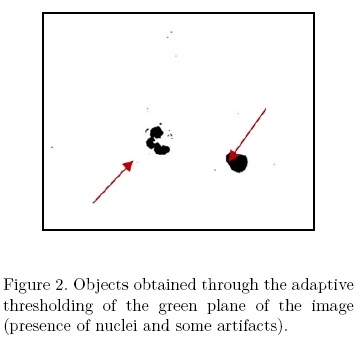
As it can be noted in Fig. 3c, filters applied so far did not completely eliminate the unwanted artifacts in the image. For this reason, we calculated the area of objects counting the pixels of each object. Those objects having an area smaller than the average area of the nuclei were removed, obtaining the clean nuclei shown in Fig. 4.
Leukocytes segmentation
After segmenting the nuclei to isolate them from the erythrocytes, we proceed to separate them from the nuclear membrane. To do this, we equalize the histogram of the original image (Fig. 1). The result of this operation is shown in Fig. 5). Note the difference in color of leukocytes respect to the erythrocytes color and background.
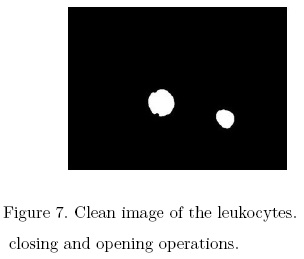
Next, the binary image is obtained by using adaptive thresholding over the green plane. In this way we could get the segmented cells. The result is shown in Fig. 6a. Similarly the median filter, and closing and opening operators are applied in order to obtain an image with the least possible noise and the cell membrane well defined (Fig. 6b). Finally, we got the image without noise and artifacts as shown in Fig. 7.
At this stage of the process, we already have the binary images of the nuclei (Fig. 4) and of the segmented cells (Fig. 7). However, it is still necessary to obtain the objects of interest in its original color in order to extract from them the characteristics that will help us to classify them. To get these objects in their original color we apply the logical AND between the original image (Fig. 1) and the segmented leukocytes without noise (Fig. 7). The fully segmented objects are shown in the Fig. 8a and separately in Fig. 8b.
Once the cells are fully segmented, the classifier k-NN was applied using the first Minkowski metric1 to perform the count of the five normal shapes objects of study.
k-NN classifier
The algorithm k-NN (k-Nearest Neighbor), originally proposed by Fix and Hodges [14], is a very simple "instance-based" learning algorithm. Despite its simplicity, it offers very good performance on many problems. k-NN classification classifies instances based on their similarity to instances in the training data.
In this work we have not considered a very long data set, that is, it had only 60 elements. We know a priori five classes, namely, the five types of leukocytes to be classified: Neutrophils, Eosinophils, Basophils, Monocytes and Lymphocytes. For classifying the type of leukocytes we used a multidimensional vector with 6 features, all related to every segmented object in each image, namely, the nucleus area, the total area, the AN/AC rate (Nucleus area/Cytoplasm area rate), the R/B cytoplasm (Red-Blue), the R/B (Red-Blue) nucleus, and finally the Compacity. The distance measure used was the Manhattan distance. In all cases the results were based on the medium value and on the standard deviation of measured parameters. Objects detected in images during the segmentation process were those with purple color; that is the reason why the color planes related in measurements were only the red and blue planes. The value selected for k was 60.
RESULTS AND DISCUSSION
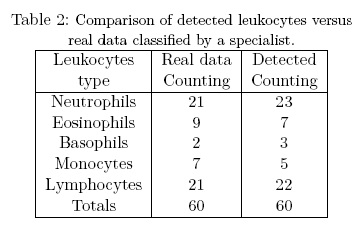
To test the effectiveness of the proposed method, we compared the results obtained by our system against those obtained by a hematologist. The test consisted in classifying and counting the leukocytes present in a sample of 45 smears obtained from patients of the National Institute of Rehabilitation, in Mexico City. The sample contained 21 neutrophils, 9 eosinophils, 2 basophils, 7 monocytes and 21 Lymphocytes previously classified by the hematologist. Table 2 shows the number of leukocytes of each type present in 45 smears previously classified by a specialist vs. the number of object detected and classified by our application.
During the recognition process many data were obtained related to the five types of leukocytes detected with the application. The most definitories were the Mean Value and the Standard Deviation, which are shown in Table 3. The k-NN classifier in combination with the first Minkowski metric was used for classifying the type of leukocytes amongst the five possible types.
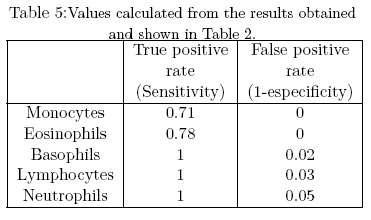
The efficiency of the application was calculated based on the number of detection included in Table 2. Table 4, shows the classification of the results obtained for each type of leukocytes based on the equations
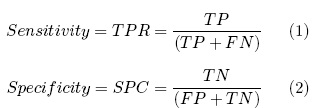
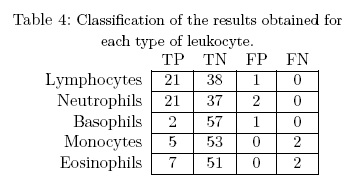
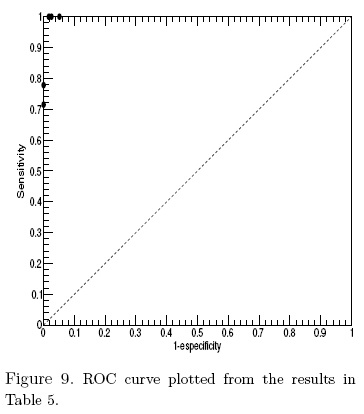
Table 5 shows the values achieved with the common equations related to the confusion matrix. Fig. 9 shows the ROC (Receiver Operating Characteristic) curve plotted from the values of Table 5. The point (0, 1) represents the perfect classification. That means 100 % sensitivity (no false negatives) and 100 % specificity (no false positives). Note the diagonal that divides the ROC space; this diagonal represents the random classification. Points above the diagonal represent good classification and points below represent poor classification. From our test we obtained results that could be considered very near the perfect classification.
CONCLUSIONS
In this work we presented a methodology to detect, classify and count five normal types of leukocytes, namely, neutrophils, eosinophils, basophils, monocytes and lymphocytes. The effectiveness of our method was tested with a blind experiment. Using the k-NN classifier in combination with the first Minkowski metric, in addition to techniques of digital image processing, a computational system platform-independent was able to identify, to classify and to count the five normal types of leukocytes. The paper does not attempt to differentiate between smears of leukocytes coming from healthy and sick people; but only to detect their presence in peripheral blood independently of their number. The system could be used in emerging areas such as the topographic hematology and the chronobiology.
ACKNOWLEDGEMENTS
Jesús Martínez-Castro and Edgardo Felipe- Riverón thank the Centro de Investigación en Computación of the Instituto Politécnico Nacional, COFAA-IPN, EDI-IPN and SNICONACYT programs, Mexico, for the support given to this work.
Susana Reyes Cadena thanks the National Instituto Nacional de Rehabilitación, Mexico City, Mexico for the support given to this work.
REFERENCES
[1] R.C. Gonzalez and R.E. Woods. Digital Image Processing. Pearson/Prentice Hall, 2008. [ Links ]
[2] Costrarido L. Evaluation Strategies for Medical-Image Analysis and Processing Methodologies. CRC Press, 2013/10/16 2005. [ Links ]
[3] India Department of Electrical Communication Engineering. Indian Institute of Science. Bangalore, editor. Teager Energy Based Blood Cell Segmentation, 2002. [ Links ]
[4] A. Bello. Hematología básica. Prado, 2001. [ Links ]
[5] H Ceelie, R B Dinkelaar, and W van Gelder. Examination of peripheral blood films using automated microscopy; evaluation of diffmaster octavia and cellavision dm96. Journal of Clinical Pathology, 60(1):72–79, 2007. [ Links ]
[6] Qingmin Liao and Yingying Deng. An accurate segmentation method for white blood cell images. In Biomedical Imaging, 2002. Proceedings. 2002 IEEE International Symposium on, pages 245–248, 2002. [ Links ]
[7] Chen Pan, Dong Sun Park, Sook Yoon, and Ju Cheng Yang. Leukocyte image segmentation using simulated visual attention. Expert Syst. Appl., 39(8):7479– 7494, June 2012. [ Links ]
[8] Robiyanti Adollah, M.Y. Mashor, N.F. Mohd Nasir, H. Rosline, H. Mahsin, and H. Adilah. Blood cell image segmentation: A review. In NoorAzuan Abu Osman, Fatimah Ibrahim, WanAbuBakar Wan Abas, HermanShah Abdul Rahman, and Hua-Nong Ting, editors, 4th Kuala Lumpur International Conference on Biomedical Engineering 2008, volume 21 of IFMBE Proceedings, pages 141–144. Springer Berlin Heidelberg, 2008. [ Links ]
[9] Madhumala Ghosh, Devkumar Das, Chandan Chakraborty, and Ajoy K. Ray. Automated leukocyte recognition using fuzzy divergence. Micron, 41(7):840 – 846, 2010. [ Links ]
[10] Cecilia Di Ruberto, Andrew G. Dempster, Shahid Khan, and Bill Jarra. Analysis of infected blood cell images using morphological operators. Image Vision Comput., 20(2):133–146, 2002. [ Links ]
[11] Ningning Guo, Libo Zeng, and Qiongshui Wu. A method based on multispectral imaging technique for white blood cell segmentation. Comput Biol Med, 37(1):70– 76, Jan 2007. [ Links ]
[12] Mukesh Saraswat, K.V. Arya, and Harish Sharma. Leukocyte segmentation in tissue images using differential evolution algorithm. Swarm and Evolutionary Computation, 11(0):46 – 54, 2013. [ Links ]
[13] Seyed Hamid Rezatofighi and Hamid Soltanian-Zadeh. Automatic recognition of five types of white blood cells in peripheral blood. Computerized Medical Imaging and Graphics, 35(4):333 – 343, 2011. [ Links ]
[14] Fix E. and Hodges J.L. Discriminatory analysis, nonparametric discrimination: Consistency properties. Technical Report 4, USAF School of Aviation Medicine, Randolph Field, Texas, 1951. [ Links ]
1The first Minkowski metric between two points (also known as Manhattan) is defined as