


Servicios Personalizados
Revista
Articulo
 Inglés (pdf)
 Artículo en XML
 Referencias del artículo
 Enviar artículo por email
Indicadores
-
 Citado por SciELO
 -
 Accesos
Links relacionados
-
 Similares en
SciELO
Similares en
SciELO
Compartir

 Permalink
Revista mexicana de ingeniería biomédica
versión On-line ISSN 2395-9126versión impresa ISSN 0188-9532
Rev. mex. ing. bioméd vol.31 no.2 México dic. 2010
Artículo de investigación original
Thermodynamic efficiency of the cardiac cycle and irreversibility in the interbeat interval time series
Alejandro Muñoz-Diosdado*, Gonzalo Gálvez-Coyt*, Alejandro Alonso Martínez*
* Departamento de Ciencias Básicas, Unidad Profesional Interdisciplinaria de Biotecnología del Instituto Politécnico Nacional.
Correspondence:
Alejandro Muñoz Diosdado.
Av. Acueducto s/n, Col. Barrio la Laguna
Ticomán, 07340, México, D. F. Teléfono:
57296000 ext. 56358.
amunoz@avantel.net; ggalvezcoyt@gmail.com; alexalonso66@gmail.com
Received article: 26/may/2010.
Accepted article: 21/november/2010.
ABSTRACT
Cardiac cycle can be analyzed as a thermodynamic cycle, however, the inherent variability of this cycle implies that, although in the short term the cycle is quasi-reversible, in the long term is irreversible. This work discusses two important aspects of the cardiac cycle related with thermodynamic concepts: the calculation of the cycle's efficiency and the quantification of the irreversibility of interbeat interval time series. The results show that there is a variability of cardiac efficiency along the day for both healthy and congestive heart failure (CHF) patients, and there is a substantial reduction in efficiency for CHF patients. If time reversibility on different scales is taken into account, methods as spectral power, fractal dimension and detrended fluctuation analysis (DFA) give the same results, but if the analysis is performed with the multiscale time irreversibility method applied to the interbeat interval time series, it results that the interbeat interval time series of healthy persons are irreversible and time series of CHF patients tend to reversibility.
Key words: Efficiency, heart rate variability, irreversibility, time series analysis.
RESUMEN
El ciclo cardiaco puede ser analizado como un ciclo termodinámico, sin embargo, la variabilidad intrínseca de este ciclo implica que, aunque a corto plazo es cuasi-reversible, a largo plazo es irreversible. En este trabajo se analizan dos aspectos importantes del ciclo cardiaco relacionados con conceptos termodinámicos: el cálculo de la eficiencia del ciclo y la cuantificación de la irreversibilidad a través del análisis de series de tiempo de interlatido cardiaco. Se obtuvo una variación en la eficiencia del ciclo a lo largo del día, y hay una disminución importante en la eficiencia para pacientes con insuficiencia cardiaca (CHF). Al tomar en cuenta la reversibilidad en el tiempo sobre diferentes escalas, ni la potencia espectral, ni la dimensión fractal o el método de análisis de fluctuaciones sin tendencia (DFA) encuentran diferencias, pero si el análisis se realiza con el método de irreversibilidad temporal de múltiples escalas aplicado a las series de tiempo de intervalos de interlatido cardiaco, se encuentra que las series de interlatido de las personas sanas son irreversibles y las series de los pacientes de insuficiencia cardiaca tienden a la reversibilidad.
Palabras clave: Eficiencia, irreversibilidad, variabilidad del ciclo cardiaco, análisis de series de tiempo.
INTRODUCTION
In living organisms, continuous interplay among different regulatory systems ensures that information is constantly exchanged across all their levels of organization. This fact enables an organism to adjust to a changing environment and to perform a variety of activities. These dynamic processes are evident in the complex fluctuations of physiological output signals, such as heart rate, brain electrical activity and blood pressure, especially under healthy conditions15. In contrast, pathologic and aging systems have degraded control mechanisms and they generate less complex signals with less variability6,7. This loss of complexity is manifest as increased randomness or greater periodicity1'3,8,9 and it is associated with a breakdown of long range correlations, multiscale variability and time irreversibility properties of the signals of healthy subjects3,5,10-14. From a complex systems approach4 random uncorrelated signals are among the least complex signals and those with long-range correlations are among the most complex. Complex signals exhibit one or more of the following features: (1) non-linearity, which means that the relationships among components are not additive, therefore small perturbations can cause large effects; (2) non-stationarity, i.e. the statistical properties of the system's output change with time; (3) time irreversibility or asymmetry, which means that systems dissipate energy as they operate far from equilibrium; (d) multiscale variability, i.e. systems exhibit spatio temporal patterns over a range of scales3,15.
Living systems have mass, energy, entropy and information flows across their borders, event at rest. In healthy conditions, these open dissipative systems operate in distant equilibrium conditions. In contrast, for extreme cases often close to death, they approach to a maximum equilibrium3,10. Such systems use energy to evolve to more structural configurations hierarchically ordinate and less entropic states compared with their environment. Their ability to self-organize is related to the energy flow through the borders and the irreversibility of the underlying process. A loss of this self-organization ability is associated with aging or disease and time irreversibility loss may be a pathology marker. Time irreversibility refers to the lack of invariance of the signal statistical properties under the operation of reversal in time3,10,12,13. This is a fundamental property of systems out of equilibrium and, therefore, it is expected to be present in biological systems even from the cellular level11. There is evidence that time irreversibility is larger for healthy physiological systems, which exhibit more complex dynamics and irreversibility decreases with aging and disease10,12,13, to the extent that all processes occurring under equilibrium conditions are time reversible, states approaching death are expected to be more time reversible than those representing far from equilibrium healthy physiology. Therefore, measurements of time irreversibility could be of theoretical and practical importance.14 Time irreversibility has been reported, for instance, in time series of tremors from patients with Parkinson's disease16, these studies are based on analysis that focuses on single scale measurements. However, physiological time series generate complex fluctuations on multiple scales associated with a hierarchy of interacting regulatory mechanisms. It is therefore important to introduce a measure of asymmetry which takes into account the inherent multiple time scales in the physiological control mechanisms.
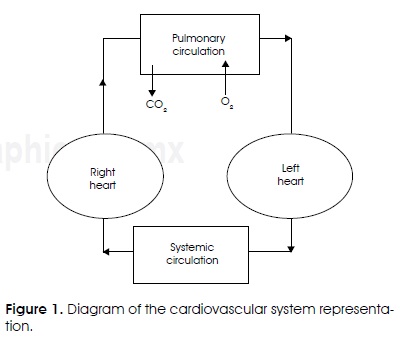
The heart is an aerobic organ that relies almost exclusively on the aerobic oxidation of substrates for generation of energy. Focusing on the cardiac cycle dynamics, irreversibility has important aspects related with thermodynamic features. As in any mechanical pump, only part of the energy invested is converted to external power. Doing some approximations, cardiac cycle can be displayed as a cycle similar to a thermal machine cycle, e.g. to determine work and energy spent on pumping blood17-20. Figure 1 is a representation of the cardiovascular system, which is divided into two systems for the systemic and pulmonary circulation. The heart is divided into 2 parts, each one has 2 cameras, the atrium and the ventricle, which collapse and relax continuously (systole and diastole). The right ventricle pumps blood to blood vessels of the lungs (pulmonary circulation) and the left ventricle pumps blood to all other tissues (systemic circulation). A valve system ensures that blood flows in the direction indicated in Figure 1. To calculate the power generated by the heart in a first approach, only the dominant terms are considered17,18. The process of filling the left ventricle and the transfer process of the blood out to the vascular system can be described with a pressure-volume diagram as the one shown in Figure 2, which illustrates the cardiac cycle of the left ventricle17.
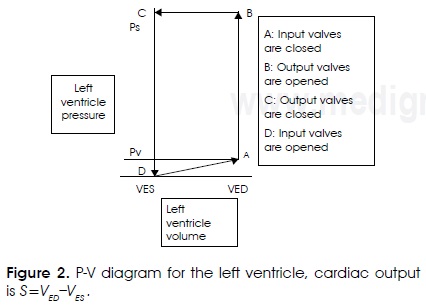
The DA line describes the filling of the ventricle, where volume increases from VES (final systolic volume) to VED (end-diastolic volume). The vertical line AB describes the isometric increase with no volume change because both valves, input and output, are closed. Horizontal line BC describes the output of blood to the vascular system. The output volume of blood S = vED-vES is the cardiac output. Vertical descending line CD describes the isometric ventricular pressure decrease. During the filling process, described by the line DA, blood flows from the pulmonary vein to the left ventricle, which is relaxed. Thus, filling pressure is equal to the pressure of the pulmonary vein PV, which is much smaller than the blood pressure of the systemic circulation. During the output process of the blood, described by the BC line, the ventricular pressure must be much larger than the blood pressure of the systemic circulation, which varies between systolic and diastolic values. The average value of ventricular pressure is approximately equal to systolic systemic pressure.
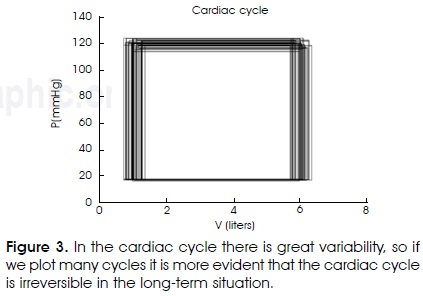
Closing the cycle at the same point that starts implies that it is reversible, otherwise is irreversible. There is great variability in the cardiac cycle; this means that although in the short-term the cycle is quasi-reversible; at long-term the cycle becomes irreversible. If consecutive cycles are plotted it can be observed the formation of a spot around the first cycle diagram (Figure 3), this oscillating cycle means that the cycle is irreversible, but as stated above, both variability and irreversibility are greater for healthy people. Furthermore, if the efficiency of the cycle is calculated, it can be expected smaller efficiency values of the patient's cardiac cycle than the efficiency of the cardiac cycle of the healthy subjects. Now, it is going to be briefly described the way to calculate efficiencies and how it was retrieved efficiency values for healthy subjects and patients with heart failure. Finally, the irreversibility in heartbeat time series will be quantified.
METHODOLOGY
The efficiency of a system is defined as the rate of the energy provided to the system to the energy that the system provides, when the energy is divided by time we obtain an efficiency definition in terms of power, the power is a physical quantity that can be measured more easily21. From a thermodynamic point of view, the heart can be considered as a machine that transforms part of the spent power in external power when it pumps blood17. During the contraction of the heart muscle most of the spent chemical energy converts into heat and a much lesser portion becomes work. The ratio of the work and the chemical energy expenditure is called efficiency of the cardiac contraction, or simply heart efficiency. Efficiency can be written as:
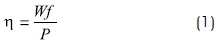
Where Wf is the average power generated by the heart, W is the energy generated by the heart and f is the frequency (number of beats per minute), P is the expended power. According to scientific medical literature22 the maximum efficiency of a normal heart yields between 20% and 25%, and the residual energy mainly dissipates as heat. This value may decrease up to 5% to 10% in heart failure and it has been hypothesized that the increased energy expenditure relative to work contributes to the progression of the disease23. It is therefore desirable to quantify efficiency of the heart to study disease processes. The average power generated by the heart is:

WL = PSS is the external work done by the left ventricle in one heart cycle (which is proportional to the ABCD area) PS and is the blood pressure peak in the systemic circulation. External work produced by the right ventricle heart cycle is given approximately by WR = PPS PP is the pulmonary systolic pressure that is approximately seven times smaller than systolic systemic pressure24,25. This approach assumes that the average on time of the ventricular pressure during the output is equal to the systolic pressure Ps and the work done to the heart by the vascular system (during ventricular filling) is insignificant.
Power spent by the heart is P = Ew. Where E is the released metabolic energy per liter of consumed oxygen and w is the rate of oxygen consumption by the heart that is a fraction of the total average of oxygen consumed by the body, that can be written as:

where Ω is the rate of total oxygen consumption by the body.
Equation (1) was used to evaluate the efficiency of the cardiac cycle of healthy persons and persons with heart failure. Heart interbeat data were taken from Physionet26. Data from cardiac variability are signals arising from ECG recordings; they were obtained with Holters with a bandwidth of 0.1-40 Hz. Each set of data was taken in a 24 hour period. Heart interbeat data were obtained in Physionet from these ECG recordings and these heart interbeat time series were used in this work. The files were divided in one hour-long files to see the variability and the efficiency separately in 24 hours. Healthy cases were taken from the «normal sinus rhythm RR interval database» containing 54 cases (28-72 years old) of both sexes; the heart failure patients were taken of the «congestive heart failure RR interval database» that has 29 cases and the «BIDMC congestive heart failure database» that has 15 additional cases. Frequencies or heart rates were calculated from these data, and appropriate values of pressures and volumes were obtained generating random values for each case within windows where appropriate values were calculated. For example, when a person is at rest the heart only pumps every minute 4 to 6 liters of blood. These values change for congestive heart failure, it ranges from 2 to 4 liters per minute, depending on the pathology. During intense exercise may be necessary that the heart pumps 4 to 7 times this amount. Sympathetic stimulation increases the force of heart contraction thus increasing the volume of blood that is pumped and increasing pressure from ejection up to twice the normal. Thus, often sympathetic stimulation can increase the maximum cardiac output up to two or three times22.
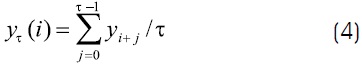
Regarding the irreversibility in time, the used method is named the multiscale time irreversibility method3. First, we mapped the original series, denoted as X={x1}, 1 ≤ i ≤ N, to the sequences of increments and decrements of the heart rate. Y={y1},1 ≤ i ≤ N-1, where y Y1= xi+1- xi y N is the data number. To extract information from multiple scales, we analyzed the original series to different resolutions and we constructed a set of coarse grain series. Each coarse grain series is constructed taking the average within a mobile window with t data, where t is the scale factor. Each element of the coarse grain series is defined as
The temporal irreversibility can be measured with the following variable10:
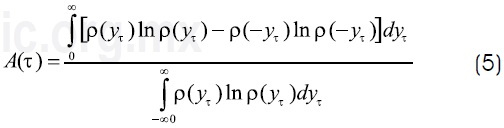
In this equation ρ is the probability density function. The time series is reversible if and only if A(π)=0. As actual signals are sampled at finite frequencies, yπ is a discrete variable. So the following equation provides an estimator of A(π):
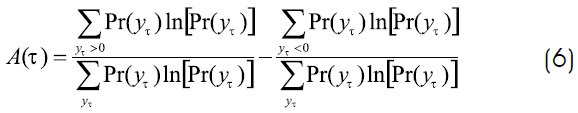
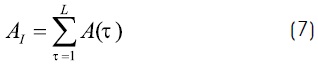
where Pr(γπ)denotes the probability value of γπ, and π= 1,2,...,L is the scale factor, L is the maximum value of π. For a range of time scales, Costa, Goldberger and Peng10 defined an easily computed multiscale asymmetry index (Al) as the summation of the asymmetry values obtained for each time scale,
To obtain the probabilities Pr(γπ) the histogram for each coarse-grained time series is calculated, the inverse of the electrocardiographic Holter recording sample frequency (125 Hz) is used as the histogram's bin size, denoted as Δ. The histogram is a function H(n) that associates the number of data points between nΔ and (n + 1)Δ to each n ∈ N, H(n)/N gives the probability.
RESULTS
By using the equations (1-3) the cardiac efficiency of healthy persons and CHF patients. For example was estimated, for a CHF patient a typical calculation can be as shown below:
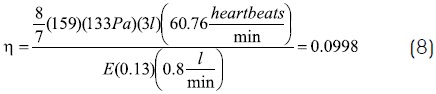
In which we obtained efficiency close to 0.01 as reported in medical references17,22. It has been taken into account for this calculation that pulmonary systolic pressure is approximately 1 /7 of systolic pressure; the factor 159 is due to the conversion of mmHg to Pascal. The c and E values were taken from references17-22 and we consulted cardiologists to obtain the best values for the parameters for this calculation. As the units of E are J/m3 in the international system, so the units can be expressed as N/ m2, these are the same units of pressure, therefore efficiency has no dimensions.
CHF patients and healthy persons have different values of the parameters used to calculate the cardiac efficiency; different values for both efficiencies are expected to be obtained. However, the most interesting feature of the results is that the obtained efficiency values were generally in the reported interval for all the calculations22.
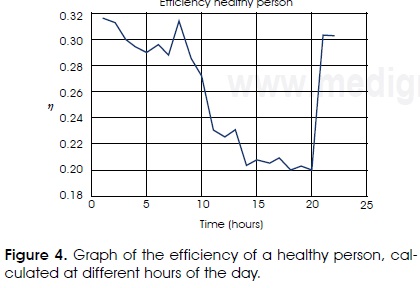
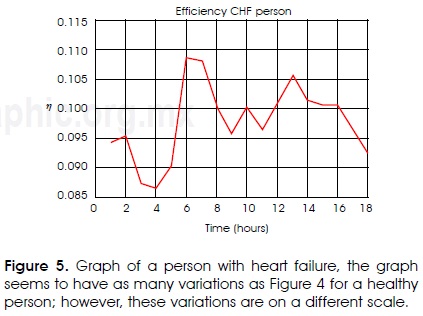
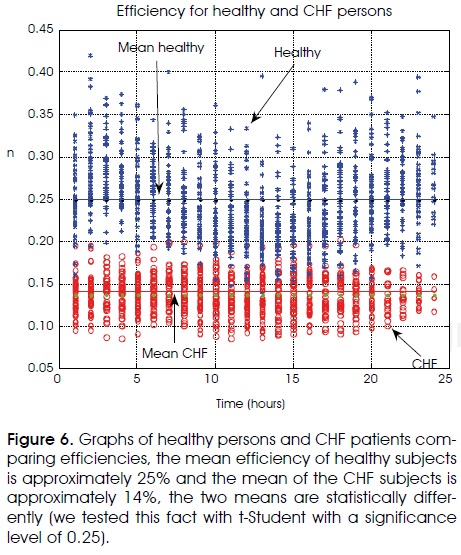
Other interesting result is that when efficiencies are obtained along the length of the day we obtained great variability in the results. In Figure 4 it is shown that on the day the cardiac efficiency of the healthy heart has an important variation. However, for a CHF patient there are also variations as shown in Figure 5. In spite of this fact, in Figure 6 it is shown that efficiency variations of the healthy are in a separate region of the CHF efficiency variations.
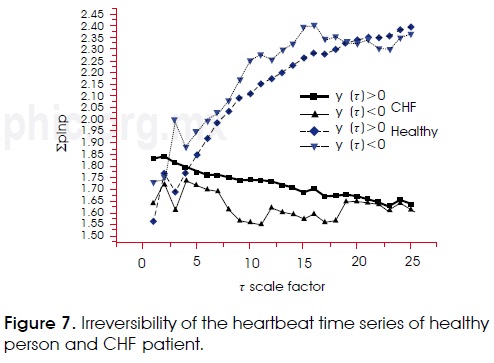
Relationship (5) was used to evaluate the irreversibility of the heartbeat time series; in Figure 7 it is shown separately the first part of the eq. (6) (of positive changes) and the second part of the same equation (negative changes). As it can be noted, there exists irreversibility in the heartbeat time series. If a time series that is Gaussian noise is generated, this turns out to be completely reversible. Anyway, interbeat time series of people with heart failure series tend to be more reversible than those of healthy persons. Fractal dimension and power spectra were calculated27,28, and the detrended fluctuation analysis (DFA method) was applied29 to the same time series, but it seems to be that these techniques do not observe irreversibility, because they give the same results for series of positive and negative changes.
DISCUSSION
Cardiac efficiency calculation shows a variability that in principle might seem too broad, however, it is not, to do the calculation, there is a variability in heart rate, this frequency was obtained from the RR heartbeat databases of Physionet, we calculated average heart rates per hour for all healthy subjects and CHF patients, the goal is to show the variability that have the physiological parameters along the length of the day even if the person is at rest. If the calculated efficiency depends on these variables then it is reasonable to expect variable efficiency. If for example, all variables are given a constant value, except the frequency, then obviously efficiency variations reflect the heart rate variations.
On the other hand, it is somewhat difficult to access actual data showing how is the variability of the other variables involved in the efficiency calculation, we have time series of 24-hour blood pressure measurements, but do not exactly correspond to these patients or these healthy subjects. At other hand, the values of variables as S, E and c, should also have variations in the day, but there are not measurements of these variables during 24 hours, there are only reported intervals for the values of these variables for healthy people or for certain kind of patients. For this situation, functions that generate one random value in the range of values generally accepted were used, each time the efficiency is calculated. However, if the randomization is uniform it is possible to obtain huge variation with values that do not even have physical sense (e.g. efficiencies close to zero or one). To avoid this problem Gaussian random functions were used in the calculation, which give us distribution values at appropriate intervals, but always more or less close to the average, which from a physiological standpoint seems to make much more sense. However, in all cases the separation that was shown in Figure 6 is still observed, i.e. the efficiency values of the healthy are separated from the patients. Cardiac efficiency is an important biomedical research subject with multiple applications, because in pathophysiological disease states mechanical efficiency is reduced and it has been hypothesized that the increased energy expenditure relative to work contributes to progression of the disease30. For instance, obesity and insulin resistance cause efficiency reduction31. There are a lot of methods to measure mechanical efficiency of the heart, for instance, in refer-ence30 Knaapen et al. report nine methods, three invasive and six noninvasive to measure efficiency, for healthy persons the reported values ranged between 14 to 35%, so the values calculated in this work are acceptable in spite of all the approximations assumed in calculations. Therefore we need better methods to calculate the cardiac efficiency and to understand the Thermodynamics role in the understanding of the cardiac cycle mechanisms32.
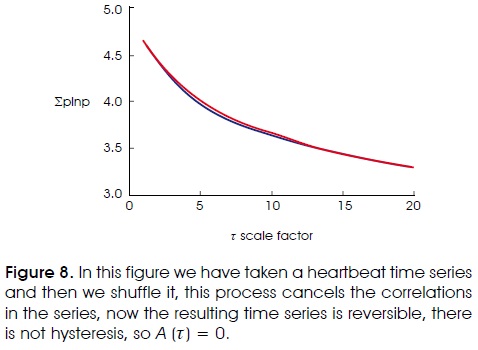
In calculations of time irreversibility we have observed irreversibility in the series of healthy people and in the series of CHF patients, there is a kind of hysteresis (see Figure 7) in the series when we change the sense of time and calculate A(π), this becomes more evident when we increase the π size. When we applied the method to quantify the irreversibility of heartbeat time series, there are differences between the series of increases and decreases. In equation (6) we have two terms in the sum, the first refers to the series of increases and the second refers to the series of decreases. In Figure 7 we have the results for two persons, there are two graphics for each person, one is the first term in equation (6), and the other is the second term in this equation. If the time series were reversible both terms in equation (6) and both graphs in Figure 7 must be equal, therefore the time series is reversible if and only if A(π)=0 and there is not hysteresis in a plot similar to Figure 7. However, if the method is applied to a random series or to a new time series obtained by making a shuffling of the heartbeat time series we obtain that A(π)=0 and the two graphs coincide as it is shown in Figure 8.
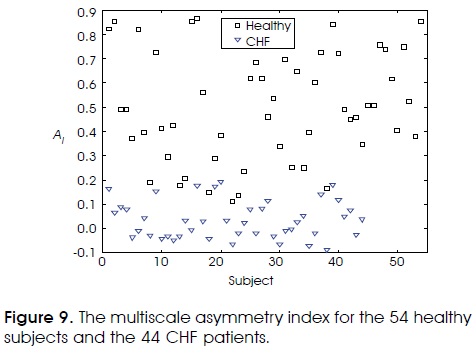
The Al multiscale asymmetry index was calculated for the 54 healthy subjects and the 44 CHF patients, Figure 9 shows the results, note that when the index tends to zero the time series is reversible and if the index is different from zero the time series is irreversible. However, there is an overlapping region that involves approximately 10% of the data.
CONCLUSIONS
The variability of the heartbeat time series is reflected in this work in two ways: the efficiency of the cardiac cycle of subjects with CHF decreases significantly with respect to the efficiency of the cardiac cycle of healthy persons. The values obtained for efficiency match with the values that have been reported in the scientific literature. Quantifying efficiency is an important task from the medical point of view, because there are pathophysiological disease states that reduce he mechanical efficiency. There are therapeutic interventions that enhance mechanic efficiency that are beneficial to the patient30, therefore it is important to have methods to quantify efficiency of the heart to monitor these interventions and to study disease processes. On the other hand, it was shown that there is indeed irreversibility in heartbeat time series and what is observed in this case is that heartbeat time series of persons with heart failure series tend to be less irreversible. Pathological time series are more symmetric under the operation of time reversal than the healthy ones, indicating a loss of temporal irreversibility with pathology. Quantifying multiscale variability and time irreversibility may have important applications, including aging effects and risk stratification, but more research is needed in order to establish their real scope and limitations.
ACKNOELEDGEMENTS
The authors wish to acknowledge the support of CONACYT (project number 91529) and SIP-IPN (project numbers 20091459, 20101336), and EDI and COFAA-IPN for partial support.
REFERENCES
1. Ivanov PCh, Goldberger AL, Stanley HE. «Fractal and Multifractal Approaches in Physiology», in Bunde, A, Knopp J, Schellnhuber H J eds., The Science of Disasters, Springer-Verlag (Germany), 2002. [ Links ]
2. Ivanov PCh, Nunez Amaral LA, Goldberger AL, Havlin S, Rosemblum MG, Struzik ZR et al. «Multifractality in human heartbeat dynamics». Nature (London), 1999; 399: 461-465. [ Links ]
3. Costa MD, Chung-Kang P, Goldberger AL. «Multiscale analysis of heart rate dynamics: entropy and time irreversibility measures». Cardiovasc Eng 2008; 8: 88-93. [ Links ]
4. Stanley, HE. «Exotic statistical physics: Applications to biology, medicine and economics». Physica A 2000: 285: 1-17. [ Links ]
5. Ivanov PCh. «Scale-invariant aspects of cardiac dynamics». IEEE Engineering in Medicine and Biology Magazine, 2007: 33-37. [ Links ]
6. Goldberger AL, Amaral LA, Hausdorff JM, Ivanov PCh, Peng CK, Stanley HE. «Fractal dynamics in physiology: alterations with disease and aging». Proc Natl Acad Sci USA 2002; 19: 2466-2472. [ Links ]
7. Buchman TG. «The community of the self». Nature 2002; 420: 246-251. [ Links ]
8. Muñoz Diosdado A. «Analysis of the relation between complexity and multifractality in cardiac interbeat intervals time series». IFMBE Proceedings 2009; 25(9): 1506-1509. [ Links ]
9. Muñoz Diosdado A, Gálvez Coyt G, Pérez Uribe BM, Arellanes González J. «Analysis of RR intervals time series of congestive heart failure patients with Higuchi's fractal dimension». Proceedings IEEE EMBS Annual International Conference, 2009; 31: 3453-3456. [ Links ]
10. Costa M, Goldberger AL, Peng C-K. «Broken asymmetry of the human heartbeat: Loss of time irreversibility in aging and disease». Phys Rev Lett 2005; 95: 198102. [ Links ]
11. Chialvo DR, Millonas, M. «Asymmetric unbiased fluctuations are sufficient for the operation of a correlation ratchet». Phys Lett A 1995; 209: 26-30. [ Links ]
12. Costa M, Goldberger AL, Peng C-K. «Multiscale Entropy Analysis of Complex Physiologic Time Series». Phys Rev Lett 2002; 89: 068102. [ Links ]
13. Costa M, Goldberger AL, Peng C-K. «Multiscale entropy analysis of biological signals». Phys Rev E 2005; 71: 021906. [ Links ]
14. Daw CS, Finney EA, Kennel MB. «Symbolic approach for measuring temporal «irreversibility». Phys Rev E 2000; 62: 1912-1921. [ Links ]
15. Malamud BD, Turcotte DL. «Self-Affine Time Series: I Generation and Analyses». Advances in Geophysics 1999; 40: 1-90. [ Links ]
16. Edwards R, Beuter A. «Using Time Domain Characteristics to Discriminate Physiologic and Parkinsonian Tremors». J Clin Neurophysiol 2000; 17: 87-100. [ Links ]
17. Uehara M, Sakane KK, Bertolotti SA. «Thermodynamics of the heart: Relation between cardiac output and oxygen consumption». Am J Phys 2008; 76(6): 566-567. [ Links ]
18. Blick EF, Stein PD. «Work of the heart: A general thermody-namic analysis». J Biomech 1997; 10: 598-595. [ Links ]
19. Badeer HS. «Work and energy expenditure of the heart». Acta Cardiol 1969; 24: 227-241. [ Links ]
20. Katz, LN. «Observation on the external work of the isolated turtle heart». J Physiol (London) 1931; 99: 579-597. [ Links ]
21. Çengel YA, Boles M. Thermodynamics: An Engineering Approach. McGraw-Hill (USA), 2010. [ Links ]
22. Guyton AC, Hall JE. Tratado de fisiología médica, 11th Ed. McGraw-Hill (NJ), 2008. [ Links ]
23. Ingwall JS, Weiss RG. «Is the failing heart energy starved? On using chemical energy to support cardiac function». Circ Res 2004; 95: 135-145. [ Links ]
24. Higginbotham MB, Morris KG, Williams RS, McHale PA, Coleman RE, Cobb FR. «Regulation of stroke volume during submaximal and maximal upright exercise in normal man». Circ Res 1986; 58: 281-291. [ Links ]
25. Grodins FS. Control Theory and Biological System. Columbia University Press (New York), 1963. [ Links ]
26. Goldberger AL, Amaral LAN et al. «PhysioBank, PhysioToolkit, and Physionet: Components of a New Research Resource for Complex Physiologic Signals». Circulation 2000; 101 (23): e215-e220 [ [ Links ]http://circ.ahjournals.org/org/cgi/content/ full/101/23/e215].
27. Higuchi T. «Approach to an irregular time series on the basis of the fractal theory». Physica D 1988; 31: 277-283. [ Links ]
28. Turcotte DL. Fractals and chaos in geology and geophysics 2nd ed. Cambridge University Press (Cambridge), 1997. [ Links ]
29. Peng C-K, Buldyrev SV, Goldberger AL, Havlin S, Simons S, Stanley HE. «Finite-size effects on long-range correlations: implications for analyzing DNA sequences». Phys Rev E 1993; 47(5): 3730-3733. [ Links ]
30. Knaapen P, Germans T, Knuuti J, Paulus WJ, Dijkmas PA, Al-lart CP et al. «Myocardial energetic and efficiency: current status of the noninvasive approach». Circulation, 2007; 115: 918-927. [ Links ]
31. Peterson LR et al. «Effect of obesity and insulin resistance on myocardial substrate metabolism and efficiency in young women». Circulation, 2004; 109: 2191-2196. [ Links ]
32. Wu Y, Yu Y, Kovács SJ. «Contraction-relaxation coupling mechanism characterization in the thermodynamic phase plane: normal vs. impaired left ventricular ejection fraction». J Appl Physiol 2007; 102: 1367-1373. [ Links ]
Nota
Este artículo también puede ser consultado en versión completa en: http://www.medigraphic.com/ingenieriabiomedica/

