


 nueva página del texto (beta)
 Inglés (pdf)
 Artículo en XML
 Referencias del artículo
 Enviar artículo por email
 Citado por SciELO
  Similares en
SciELO
Similares en
SciELO 
 Permalink
INTRODUCTION
Linear dimension shrinkage is a rather important concern in morphometric studies conducted on fixed specimens (Cutts, 1988; Beger, et al., 2020). Therefore, the effects of fixation are reported as limitations in numerous studies (Cutts, 1988; Beger, et al., 2020). There are few studies analyzing the dimensional change effects of fixative solutions on specimens and the effect on morphometry and allometry analysis (Cutts, 1988; Vergara-Solana et al., 2014; Sotola et al., 2019).
Formalin solution at 10% is one of the most convenient and commonly used fixative solutions used for cadaver and tissue fixation without much modification since 1893 (Brenner, 2014). Formaldehyde is an excellent fixative, disinfectant, and antiseptic; however, it causes discoloring, loss of consistency and flexibility, and represents a risk to public and environmental health (Brenner, 2014; Wolkoff & Nielsen, 2010). It is known that the preservation of linear dimensions is reduced by the fixation of the specimens, reaching 2-10% of the initial value (Parker, 1963). For instance, in the specific case of preservation of the external morphology of fish, some studies have described significant effects of preservation by freezing and long-term storage in a 10% formalin solution (Berbei-Filho et al., 2013). In contrast, others have claimed no effect on preservation (Larochelle et al., 2016) or with deformities so minimal that they don´t cause confusion between species (Vergara-Solana et al., 2014).
There is evidence that preservation produces only minor effects in different analyzes of shape variation; even using a mixture of differently preserved specimens has a relatively small effect in subsequent analyzes (Fruciano et al., 2020). In ichthyology and fisheries research, fish are routinely prepared for osteological studies using a common full-mount procedure known as clearing and staining (Dingerkus & Uhler, 1977). Samples are frequently measured after this process (Mabee & Trendler, 1996). In research on the biology of skeletal development, they also clear and stain fish to study skeletal growth (Schilling et al., 1996) and heterochrony (Strauss, 1990). Similarly, samples are often measured after clearing and staining. Although, it is well documented that fish shrink relative to their living length when fixed in formalin or ethanol (Rosenthal et al., 1978; Hjorleifsson & Klein-MacPhee, 1992), and those small specimens shrink relatively more than larger specimens (Radtke, 1989). It is unknown if clearing and dyeing affect fish length.
In an interesting investigation, Mabee et al. (1998) determine whether the process of clearing and staining has a significant effect on fish length. Repeated-length measurements were made on individual specimens of laboratory-reared Tilapia mossambica while life, after formalin fixation and ethanol storage (2 days and 30 days), and finally after clearing and staining. These results show that clearing and staining cause significant shrinkage (3-6%). In contrast to previous studies showing that small specimens shrink relatively more than larger ones when fixed in formalin or ethanol, they found that larger fish shrink relatively more than smaller ones when subsequently cleared and stained. They provide regression equations that relate cleared-and-stained lengths to fresh or fixed.
However, nothing has been done about the effect of the alizarin red “S” staining and clearing technique on the morphometric and allometric analysis. Hence, this study analyzes the effect on long-time previously fixed specimen’s morphology, issue lacking evidence but useful for several collections that usually store their specimens this way.
MATERIALS AND METHODS
Sample: Thirty-three specimens of Chloroscombrus chrysurus (Linnaeus, 1766), with a previously fixed for 23 years in a 10% formalin solution, were washed in tap water for a day (24 hours). Morphometric measurements were taken according to the Morphometric Measurements for Advanced Species Identification from the FishBase (MMASI) (Fig. 1). The morphometric measurements of all specimens were registered on the left side of the fish body. All measurements for the fish lengths were recorded in the laboratory using a digital caliper (FUMETA mod. XSW-81390102-P) with a precision of 0.01 mm. For data control, the same person takes both measures with even the same digital caliper, thus minimizing systematic error.
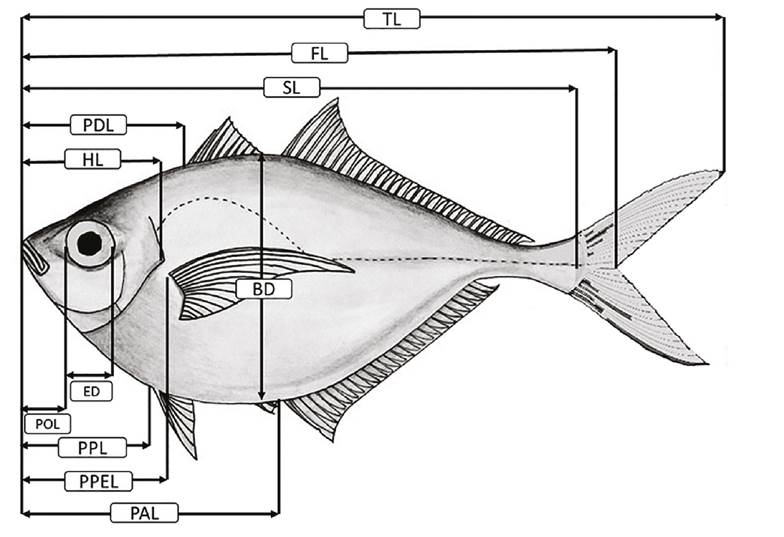
Figure 1 Morphometric Measurements for Advanced Species Identification from FishBase, adapted to the scheme of Chloroscombrus chrysurus. Nomenclature: Total Length (TL); Standard Length (SL); Fork Length (FL); Head Length (HL); Pre-anal Length (PAL); Pre-dorsal Length (PDL); Pre-pectoral Length (PPEL); Pre-pelvic Length (PPL); Eye Diameter (ED); Pre-orbital Length (POL); Max. Body Depth (BD). MMASI adapted from https://www.fishbase.se/identification/MorphometricsAdvanced/centimeters/index.php.
Clearing and staining: The skin, eyes, and viscera were removed, then we cleared and stained the bone (alizarin red “S”) following the method of Hollister (1934) with modifications. This process involved staining for bone (alizarin red 0.1% in 4% KOH) for 24 hours, tissue digestion in 4% KOH for 4 to 8 weeks, depending on specimen size, clearing them in glycerin solutions (40, 60, 80 and 90 %) one day for each solution and storing them in 100% glycerin (Fig. 2). All specimens were deposited at Laboratorio de Anatomía Animal Comparada UMF-FES Iztacala-UNAM. MMASI were adapted to C. chrysurus in this study (Figure 1).

Figure 2 Specimens of Chloroscombrus chrysurus. The upper figure represents a fixed specimen, and the lower is a clearing. Scale bar: 1 cm.
Morphometric analysis: The data of morphometric measurements were transformed into an index with the formula of Schindler and Schmidt (2006) in Microsoft Excel ® as follows:
All indexes were analyzed using STATISTICAL software version 10. Then the mean and standard deviation for all the fixed and clearing specimens was carried out, followed by a paired t-test.
Deformation analysis: Microsoft Excel ® used to transform Sotola et al. (2019) equation into deformation percent as follows:
Where:
MmCl |
morphometric measurements data of clearing specimen, |
MmFi |
morphometric measurements data of fixed specimen. |
Deformation´s mean and standard deviation from fixed and clearing specimens were calculated using STATISTICAL version 10.0, followed by one-sample t-test.
Allometric analysis: Allometric growth of clearing and fixed specimens was calculated as a power function of TL, using the data of the measured morphometric characteristics with the following model of Froese (2006) as follows:
where “y” is the measured character, “a” is the intercept, “x” is the TL, and “b” is the allometric growth coefficient (Fuiman, 1983). Regarding the specific morphological characteristics, the measured morphometric was compared with TL, and isometric growth was determined when b = 1 for length. Positive allometric growth was determined when b > 1, corresponding to a higher growth rate than TL, while negative allometric growth was determined when b < 1. Linear regression analysis was performed on the log transformed data according to (Zar, 2014).
Regression analyses calculated with STATISTICAL software version 10.0. Once t-tested, were contrasted to 1-value for type of allometric growth (Zar, 2014).
RESULTS
Obtaining data:
Fixed specimens. The MMASI of each fixed specimen were obtained (n = 33; TL = 107.8-148.1 mm; FL = 95.3-129.7mm; SL = 89.1-121.5 mm POL= 5.3-9.8 mm, HL= 22.4-29.9 mm, ED = 7-8.9 mm, BD = 37.4-50.5mm, PDL= 28.8-42 .8 mm; PPL = 32.5-45.2 mm; PAL = 33-44.1 mm; PPEL = 28.5-39.9 mm). A database was built in Excel ® using these measurements to obtain the different values of the morphometric indices using the equation (1) (n = 33; FL/TL = 0.8055-0.9603; SL/TL = 0.7922-0.8861; POL/TL = 0.0492-0 .0865, HL/TL = 0.2019-0.2374, ED/TL= 0.0592-0.0759, BD/TL = 0.3276-0.3801, PDL/TL = 0.2459-0.3784; PPL/TL = 0.2889-0.3539; PAL/TL = 0.2918-0.3689; PPEL/TL= 0.2403-0.2946). For each one, we obtained the mean, standard deviation, and coefficient of variation (see Table 1).
Table 1 Morphometric analysis for the Chloroscombrus chrysurus (Linnaeus, 1766) measurements.
| Fixed | Clearing | ||||||||||
|---|---|---|---|---|---|---|---|---|---|---|---|
| Index | Mean | SD | CV | Mean | SD | CV | T | Effect | |||
| FL/TL | 0.8937 | 0.0263 | 2.94 | 0.8805 | 0.0146 | 1.65 | -3.0053*** | ↓ | |||
| SL/TL | 0.8248 | 0.0226 | 2.74 | 0.7841 | 0.0218 | 2.776 | -8.5549*** | ↓ | |||
| POL/TL | 0.0643 | 0.0072 | 11.15 | 0.0864 | 0.0094 | 10.93 | 11.278*** | ↑ | |||
| HL/TL | 0.2189 | 0.0085 | 3.88 | 0.1827 | 0.0119 | 6.52 | -14.0531*** | ↓ | |||
| ED/TL | 0.068 | 0.0047 | 6.92 | 0.0533 | 0.0046 | 8.62 | -13.9622*** | ↓ | |||
| BD/TL | 0.3546 | 0.0129 | 3.63 | 0.329 | 0.0103 | 3.13 | -8.819*** | ↓ | |||
| PDL/TL | 0.2905 | 0.0232 | 7.99 | 0.2946 | 0.0488 | 16.57 | 0.4641 ns | ↔ | |||
| PPL/TL | 0.3119 | 0.01729 | 5.52 | 0.2943 | 0.0093 | 3.17 | -5.3845*** | ↓ | |||
| PAL/TL | 0.3307 | 0.0184 | 5.56 | 0.3408 | 0.0152 | 4.47 | 2.4242* | ↑ | |||
| PPEL/TL | 0.2695 | 0.0101 | 3.75 | 0.2392 | 0.0152 | 6.34 | -9.8879*** | ↓ | |||
Nomenclature: SD = Standard deviation; CV = Variation coefficient; T = value of the t-test of Students; ns = not significant; *=p<0.05; **=p<0.01; ***=p<0.001; ↔: no change; ↑: increase; ↓: decrease; Total Length (TL); Fork Length (FL); Standard Length (SL); Pre-orbital Length (POL); Head Length (HL); Eye Diameter (ED); Max. Body Depth (BD); Pre-dorsal Length (PDL); Pre-pelvic Length (PPL); Pre-anal Length (PAL); Pre-pectoral Length (PPEL). MMASI adapted from https://www.fishbase.se/identification/MorphometricsAdvanced/centimeters/index.php
Clearing specimens. An Excel ® MMSAI database was built for each clearing specimen (n = 33; TL = 111-146.9 mm; FL = 95.5-130.5 mm; SL = 84.5-113 mm; POL = 8.6-13 mm, HL = 19.3-26.2 mm, ED = 5.5-8 mm, BD = 36.1-47.2 mm, PDL = 31-42.7 mm, PPL= 31-40.8 mm; PAL = 36.6-48.5 mm; PPEL = 24.4-37.4 mm). Equation (1) - based morphometric indices Excel ® database as follows (n = 33; FL/TL= 0.8521-0.9199; SL/TL=0.7318-0.8339; POL/TL= 0.06470-0.1048; HL/TL = 0.1623-0.2175, ED/TL = 0.0460-0.064, BD/TL = 0.3118-0.3505, PDL/TL = 0.2712-0.3163, PPL/TL = 0.2777 -0.3159; PAL/TL = 0.295-0.3718; PPEL/TL = 0.1946-0.2642); mean, standard deviation and coefficients of variation in Table 1.
Morphometric analysis. The paired student’s t-test was applied for each MMASI to verify if there were significant differences between the morphometric indices. Results and observed probability were placed in Table 1.
Deformation analysis. The deformation percentage was obtained from the MMASI using equation (2) (n = 33, % strain for; FL= -6.51% to 12.93%; SL = -8.02% to 11.41%; POL = -14.01% to 9.97%, HL = -4.08% to 95.16%, ED = -28.25% to 0%, BD = -16.99% to 9.9%, PDL = -16.59% to 29.17%, PPL = -17.46% to 15.77%, PAL = -11.85% to 23.87%, PPEL = -23.7% to 3.7). The paired student’s t-test was applied for each deformation to verify if there were significant differences. Results and observed probability were placed in Table 2.
Table 2 Deformation analysis for the morphometric measurements of Chloroscombrus chrysurus (Linnaeus, 1766).
| Morphometric measurement | Deformation Mean in % | SD | T | Effect |
|---|---|---|---|---|
| TL | 2.53 | 4.5343 | 3.2037** | ↑ |
| FL | 1.0583 | 4.6521 | 1.3068ns | ↔ |
| SL | -2.46 | 5.659 | -2.4939* | ↓ |
| POL | 39.12 | 20.6165 | 10.8984*** | ↑ |
| HL | -14.42 | 5.9938 | -13.8193*** | ↓ |
| ED | -19.5 | 8.3369 | -13.438*** | ↓ |
| BD | -4.76 | 5.9992 | -4.5575** | ↓ |
| PDL | 7.1642 | 9.7061 | 4.2402*** | ↑ |
| PPL | -3.06 | 6.4295 | -2.7359* | ↓ |
| PAL | 5.94 | 8.7626 | 3.893** | ↑ |
| PPEL | -8.89 | 7.3823 | -6.9181*** | ↓ |
Nomenclature: SD = Standard deviation; T = value of the t-test of Students; ns = not significant; *= p<0.05; **= p<0.01; ***= p<0.001; ↔= no change; ↑= increase; ↓= decrease; Total Length (TL); Fork Length (FL); Standard Length (SL); Pre-orbital Length (POL); Head Length (HL); Eye Diameter (ED); Max. Body Depth (BD); Pre-dorsal Length (PDL); Pre-pelvic Length (PPL); Pre-anal Length (PAL); Pre-pectoral Length (PPEL). MMASI adapted from https://www.fishbase.se/identification/MorphometricsAdvanced/centimeters/index.php .
Allometric analysis. Linear regression analysis was carried out on MMASI -Log transformed- fixed vs. clearing specimen´s LT values. Notably, only clearing´s Log LT vs Log PDL correlation was not significant. Student´s t-test on allometric coefficients (Zar, 2014) comparisons as follows: near 1-value denotes isometric, meaning not- significant differences; t < 0 plus significant differences, there is negative allometry and t > 0 with significant differences indicates positive allometry (Table 3).
Table 3 Allometric analysis for the morphometric measurements of Chloroscombrus chrysurus (Linnaeus, 1766), taking TL as the independent variable.
| Fixed specimens | |||||
|---|---|---|---|---|---|
| Log TL vs | a | b | r | T | Observed allometry |
| Log FL | 0.9139 | 1.3472 | 0.8930*** | -1.0414 ns | Isometric |
| Log SL | 1.0377 | 0.6887 | 0.9259*** | 0.4962 ns | Isometric |
| Log POL | 0.9558 | 0.0790 | 0.4889* | -0.1444 ns | Isometric |
| Log HL | 0.8362 | 0.4778 | 0.8167*** | -1.5436 ns | Isometric |
| Log ED | 0.3216 | 1.7261 | 0.3506* | -4.3977 ** | Negative allometric |
| Log BD | 0.9836 | 0.3832 | 0.8652*** | -0.1602 ns | Isometric |
| Log PDL | 0.8094 | 0.7192 | 0.5591*** | -0.8844 ns | Isometric |
| Log PPL | 0.8423 | 0.6606 | 0.7087*** | -1.0468 ns | Isometric |
| Log PAL | 0.7661 | 1.0079 | 0.6691*** | -1.5306 ns | Isometric |
| Log PPEL | 0.9863 | 0.2875 | 0.8564*** | -0.1285 ns | Isometric |
| Clearing specimens | |||||
| Log TL vs | a | b | r | T | observed allometry |
| Log FL | 1.0833 | 0.5905 | 0.9728*** | 1.7971 ns | Isometric |
| Log SL | 1.0498 | 0.6173 | 0.9173*** | 0.6091 ns | Isometric |
| Log POL | 0.3562 | 1.8815 | 0.2050 ns | ------ | ------ |
| Log HL | 0.8616 | 0.3540 | 0.6376*** | -0.7400 ns | Isometric |
| Log ED | 0.7957 | 0.1413 | 0.4985* | -0.8219 ns | Isometric |
| Log BD | 0.9889 | 0.3468 | 0.8880*** | -0.1208 ns | Isometric |
| Log PDL | 0.9471 | 0.389 | 0.8563*** | -0.5156 ns | Isometric |
| Log PPL | 0.8718 | 0.5438 | 0.8652*** | -1.4124 ns | Isometric |
| Log PAL | 0.9308 | 0.4744 | 0.7803*** | -0.5166 ns | Isometric |
| Log PPEL | 0.9412 | 0.3165 | 0.6596*** | -0.3051 ns | Isometric |
Nomenclature: a = allometric coefficient, b = y-intercept, r = correlation coefficient, T = value of the t-test of Students, ns = not significant; * p<0.05; **p<0.01; ***=p<0.001; Total Length (TL); Fork Length (FL); Standard Length (SL); Pre-orbital Length (POL); Head Length (HL); Eye Diameter (ED); Max. Body Depth (BD); Pre-dorsal Length (PDL); Pre-pelvic Length (PPL); Pre-anal Length (PAL); Pre-pectoral Length (PPEL). MMASI adapted from https://www.fishbase.se/identification/MorphometricsAdvanced/centimeters/index.php .
DISCUSSION
Non-significant index (PDL/TL; p>0.05) and Bonferroni-significant indexes (meaning two increase (POL/TL, PAL/TL; p<0.001) and seven decrease (FL/TL, SL/TL, HL/TL, ED/TL, BD/TL, PPL/TL, PPEL/TL; p < 0.001) (Table 1) have no comparison with those reported in the literature, but nonetheless, provides evidence that process of clearing and staining affects the index and, thus, identification of the species of clearing specimens when using morphometrics indexes. Interestingly, the coefficients of variation (CV) are always less than 20%, a condition considered to be typical of the morphological variation of vertebrates by several authors (Yablokov; 1974; Lander, 1977; Polly, 1998). Thus, while there are changes in the morphometric indices, the morphological variation remains within the expected values.
Respect to morphometric measurements, one showed no significant deformations (FL, p > 0.05), those of three increased significantly (TL, p < 0.05; PAL, p < 0.01; POL, p <0.001) and seven decreased significantly too SL, PPL, p < 0.05; BD, p < 0.01; HL, ED, PDL, PPEL, p < 0.001) (Table 2); these results coincide with those reports from many authors (Parker, 1963; Cutts, 1988; Sotola et al., 2019; Beger, et al., 2020) on the decrease in measurements from 2.46% to 19.5%, the increases are not previously reported, but increase in TL of 2.53% is similar to the decrease reported during fixation. However, it is observed that the clearing and staining process affects the morphometric measurements, producing a significant reduction.
The general allometry analysis aims for a general isometric growth (Log TL vs Log SL, Log TL vs Log HL, Log TL vs Log BD, Log Tl vs Log PDL, Log TL vs Log PPL, Log TL vs Log PAL, Log TL vs Log PPEL, all growths are the same between clearing specimens and fixed specimens (Table 3), an expected fact when establishing length-length relationships without shape change as reported by several authors (Moutopoulos & Stergiou, 2002; Froese, 2006; Simon & Mazlan, 2008; Shin, et al., 2022).
In the clearing specimens, one relation without correlation was presented (Log TL vs. Log POL). However, in the fixed samples an isometric growth for POL and a negative allometric growth for ED are shown. This observation where the eyes get smaller as they get larger is a phenomenon known for centuries as Haller’s rule of eye allometry. This rule states that smaller animals have larger eyes than larger ones (McMahon & Bonner, 1983). Based on the results obtained here, the clearing and staining procedure affects the allometric analysis to a lesser degree.
In conclusion, the procedure of clearing and staining with alizarin red produce a body fish morphology deformation, as revealed by the morphometric measurements analyzed. However, it affects the allometric analysis to a lesser degree. Hence, when performing morphometric analysis of long-fixed specimens cleared and stained with alizarin red “S”, care must be taken. Nonetheless, the allometric analysis provides more reliable results.

