


 nova página do texto(beta)
 Inglês (pdf)
 Artigo em XML
 Referências do artigo
 Enviar este artigo por email
 Citado por SciELO
  Similares em
SciELO
Similares em
SciELO 
 Permalink
INTRODUCTION
Swimming crabs of the Callinectes genus are known in Mexico as “jaibas,” they are widely distributed in the Gulf of Mexico and the United States coastal zone of the Atlantic Ocean. They have been documented from the states of Maine and Massachusetts in the United States to the coast of Uruguay, including the archipelagos of Bermuda and the Antilles (Williams, 1974).
Six species of swimming crabs of the Callinectes genus are reliably identified in the Gulf of Mexico: blue crab (Callinectes sapidus), Bocourt swimming crab (C. bocourti), Dana crab (C. danae), sharp tooth crab (C. rathbunae) and lesser blue crab (C. similis) and swimcrab (C. ornatus). Blue crab can be considered the main species and inhabits the entire coastal strip of the Gulf of Mexico and is the one that support the fishery (SAGARPA-CONAPESCA, 2018).
Small-scale fishing is a very important activity from the social perspective, since it provides excellent food in the coastal areas, reaching major cities, as well as rural areas adjacent to the coast. This makes the blue crab an important element for the food production reasons for the inhabitants of these regions.
Fisheries management generally involves decision making regarding fishing effort based on the evaluation of the population size and population dynamics, in order to maintain the desired levels of exploitable biomass over time (Anderson & Seijo, 2010). Among the disadvantages of this approach, especially in small scale fisheries, is that the information necessary to make these estimates is very difficult to obtain or there are no adequate population assessments (Martell & Froese, 2012), and implemented management strategies frequently ignore the responses from fishers to changes in abundance and self-management over time (Hilborn & Walters, 1992).
The official document that defines the status of fisheries in Mexico is the National Fisheries Chart (NFC), (DOF, 2018). In this context, it should be noted that the scientific information that supports the diagnosis of the status of fishery resources and also supports the NFC in Mexico, is very detailed and synthesized (Arreguín-Sánchez et al., 2006).
A biological reference point (BRP), in its most generic form, is a standard or benchmark against which to measure of the state of the stock from a biological perspective. A BRP often reflects the combination of several components of stock dynamics (growth, recruitment, and mortality, generally including fishing mortality) into a single number. This number is generally expressed as an associated fishing mortality rate or a biomass level (Gabriel & Mace, 1999). In general, BRPs are often derived from models that are difficult for non-modelers to understand, with the models often requiring a large amount of input data. To estimate the optimal levels of allowable catches it is necessary to have as much information as possible; to be able to establish an adequate management of the target resources, it is necessary to know the behavior of the fishers, their catch statistics, and the fishing effort applied. It is also essential to know the fundamental biological aspects of the most commercially important species along the coast, which should also consider associated species (Caddy & Mahon, 1995).
In Mexico, the vast majority of fisheries and the resources on which they depend are data poor due to a lack of funds for research and a lack of support for monitoring and analyses. Many of these fisheries are important for socio-economic and for food reasons and/or because they affect vulnerable ecosystems or vulnerable populations. However, it is important to assess and manage the fisheries, even when little data are available. Fortunately, there are methods for assessing the stock status and identifying management reference points for fisheries that have scarce information. Methods exist that can be used to prioritize fisheries for research and management, as well as to estimate overfishing thresholds, biomass levels, stock status, catch or effort (Honey et al., 2010). In this sense, the reference points can be direct estimates, or proxies for direct estimates, depending on the sufficiency of the available data. There are also approaches used that set default, precautionary, management reference points in the absence of specific stock or species information (MFNZ, 2008; DAWE, 2018).
Background. Díaz de Leon et al. (2004) analyzed the health status of 28 fishery management units in the Gulf of Mexico determining that 79 % were overexploited and that 25 % required urgent attention, including the blue crab fishery in Campeche. Guerra-Jimenez et al., (2018), applied the Martell & Froese (2012) method to the Campeche blue crab fishery and estimated an MSY of 3,350 t. They concluded that the fishery is exploited at the maximum sustainable level with some indication of overexploitation. Rodríguez-Castro et al., (2017), applied different adjustments to linear and nonlinear mathematical functions to the captures reported in Laguna Madre, Tamaulipas during the period 1998-2012, and concluded that the fishery experienced six capture periods and two lifecycles and resulted in a fishery that had been severely overfished. Palacios-Fest et al. (2000) determined that the species of the Callinectes genus in the Alvarado lagoon in Veracruz, Mexico are overexploited with exploitation rates values (E) above 0.60. Villegas-Hernandez et al. (2017), through a short-term Jolly-Seber mark-recapture model experiment estimated the catch-per-unit-effort (CPUE) and the catchability coefficient (q) of the blue crab (C. sapidus) in the fishing port of Sisal, Yucatan, Mexico.
Based on genetic and phylogenetic analyses, it is considered that there are two stocks of blue crab in the US Gulf of Mexico (GDAR, 2013). The NE Gulf of Mexico stock along Florida state coast up to the Apalachee Bay, and a NW Gulf of Mexico stock occurring from Apalachicola Bay, Florida, to the west of the gulf. However, the connection between the western US Gulf of Mexico stock and the southern distribution in Mexican waters is uncertain (GDAR, 2013).
The Catch-MSY (C-MSY) method described by Froese et al. (2017) has gained importance since it allows estimating the main exploitation parameters (reference points) of fisheries with limited data. Rosenberg et al. (2014), for the single-stock status work, developed a fully factorial simulation testing framework to assess four potential data-limited models. The results suggest that Catch-MSY, a catch-based method, was the best performer, although the different models performed similarly in many cases. ICES (2014), applied the C-MSY method to 17 stocks including fully evaluated populations, populations with limited data and simulated populations. The results indicated that the C-MSY method produces reasonable predictions for the relative biomass and the relative exploitation rate compared to the fully evaluated populations, the simulated populations and the populations with limited data for which CPUE data were available.
Considering the above, and given that crab populations are very dynamic and can change size rapidly, as well as the improvement of population assessment methodologies over time, the present study aims to determine the health status of crab population in this area and estimate candidate reference points for these fisheries. The objectives of this study were; to assess the health status of the blue crab (C. sapidus) stock in the Mexican Gulf of Mexico and to estimate appropriate candidate reference points for the Mexican blue crab fishery.
MATERIALS AND METHODS
Methods. One part of the methodology consisted of the analysis of the historical official landings records (t/year) and another of the application of the C-MSY method described by Froese et al., (2017). The live weight information was taken from official crab landings records from the Statistical Fishing Yearbooks during the period of time from 1980 to 2018 (https://www.gob.mx/conapesca/documentos/anuario-estadistico-de-acuacultura-y-pesca). In this data base, all of the species of the Callinectes genus that share the common name crab were grouped and later they were disaggregated by species, according to the answers provided, blue crab landings represent 95 % of the total. The remaining 5 % is comprised of the other crab species in the region, which are largely sold as bait while blue crab is entirely oriented for direct human consumption (Pesca Responsable y Comercio Justo, pers. comm. 2020). In order to understand how the fishing effort has changed in the last decade, the fishing effort data published in the NFC, together with CONAPESCA fishing license databases and the fishing license database published in the https://www.pescandodatos.org platform were analyzed.
Stock Assessment, Limit Reference Points (LRP), Target Reference Points (TRP) and Fishing Mortality (F)-Based Reference Points. For the evaluation of the blue crab stock and the estimation of the different reference points, the species was considered as a single stock for the Mexican Gulf of Mexico (BC-GM). The C-MSY method described by Froese et al. (2017) was applied. This, through the Monte-Carlo method, estimates the reference points of the fishery (MSY, FMSY, BMSY), as well as the relative size of the population (B/k) and the exploitation rate (Ft/FMSY). Another important feature of the C-MSY is that it differs from an earlier version of the Catch-MSY method (Martell & Froese, 2012) by searching for the most probable not in the center but rather in the tip of the triangle. This is based on the underlying principle that defines r as the maximum rate of increase for the examined population, which should be founded among the highest viable r-values, i.e. r is defined as maximum net productivity. The initial biomass was calculated as:
and the biomass of the following years as:
σv = process error standard deviation. If the process error is equal to 0, it is considered a deterministic model and if it is equal to 1, it is considered an observation error (uncertainty). To account for reduced recruitment at severely depleted stock sizes, such as predicted by all common stock-recruitment functions (Beverton & Holt, 1957; Ricker, 1975; Barrowman & Myers, 2000), this method incorporates a linear decline of surplus production, which is a function of recruitment, somatic growth and natural mortality (Schnute & Richards, 2002), when biomass falls below ¼ k (Equation 3).
It was assumed that, at the beginning of the time-series, the biomass of the blue crab stock varied between 50 and 90 % (B/k = λi1, λi2) of its carrying capacity (k), and in last year between 30 and 70 % (B/k = λf1, λf2). The biological plausible range for for species with high resilience (0.6 < r <1.5 Froese et al., 2017) was considered appropriate for BC-GM stock. To note a key uncertainty, there are many catches that are not correctly recorded, mainly when it comes to small-scale fisheries. The lack and low precision of information is usually considerably greater for the small-scale fleet than for the industrial fleets (Arreguín-Sánchez & Arcos-Huitrón, 2011), as some crab is not sold and therefore goes unrecorded in the official capture statistics. To address this, the input values of CV and process error used in the method were 0.2 (20 %) and 0.1, respectively. In all cases, 30,000 MCMC iterations were performed.
The parameter estimated by C-MSY and BSM relate to standard fisheries reference points, such that
If the reduction in recruitment at very slow stock sizes (B/k < 0.25), instead
The version of the R script of the C-MSY method used here was CMSY-2019-5.R (https://oceanrep.geomar.de/33076/)
Crab Production Rates. According to the Schaefer model, the net surplus production in a period of time t of a population subject to fishing is defined as (Seijo et al., 1998; Anderson & Seijo, 2010):
Where r is the intrinsic rate of population growth, B is the biomass at time t and k is the carrying capacity of the stock.
In the case of exploited stocks, the annual biomass (Bt) can be estimated by relating it to the instantaneous rate of population growth (ρt) (Jacobson et al., 2001):
Where Ft is the instantaneous fishing mortality rate defined as the ratio between the accumulated catch in a fishing period and the average biomass in the same period, or Ft = Ct/Bt (Jul-Larsen et al., 2003). So,
Furthermore, ρt is related to the annualized surplus production of the stock (SP) as follows (Jacobson et al., 2001):
A Kobe plot was constructed (Aires-da-Silva & Maunder, 2011; Schirripa, 2016), which allows a plot of assessment from the perspective of the exploitation rate (Ft/FMSY) and the relative biomass (Bt/BMSY), and summarizes stock status by plotting points by colored quadrant: green quadrant (not overfished, no overfishing), yellow and orange quadrant (overfished or overfishing), and the red quadrant (overfished and overfishing). It can also be used to guide the choice of reference points for use as part of a standard management strategy (Laurence et al., 2014).
Candidate Reference Points. These population biomasses should be managed to fluctuate around a target reference point (TRP) compatible with MSY (MFNZ, 2008), but not generally be allowed fall below the limit reference point (LRP). As is traditional, we suggest that the biomass TRP is established as equal to the BMSY. A threshold around 0.5 BMSY has been widely adopted as a biomass LRP to prevent recruitment overfishing (Haddon et al., 2012; Carruthers et al., 2014; Froese et al., 2015; Froese et al., 2017). Additionally, we recommend a fishing mortality limit reference point at the value of FMSY produced by the model, such that any value above this is considered overfishing. In summary, the advised candidate reference points are:
Kobe plots were constructed to show the evolution of the stocks relative to the candidate target and limit reference points and provide information on the stock status and exploitation rate. To test the effect of the establishment of possible standard management strategies of limiting catch or fishing mortality, and evaluate their effect on the trend of the stock biomass, the Schaeffer model (constant captures) was used. For catch limits, the values tested were the TRPMSY and the LRPMSY as well as several values in between. For fishing mortality limits the values tested were FMSY as well as 0.9, 0.8 and 0.7 FMSY. Additionally, the exploitation rate and relative biomass were calculated and plotted in a Kobe plot to show their evolution projected to the year 2025.
Management Options Outcome Analysis. An analysis was carried out to evaluate stock and fisheries outcomes using a range of different constant catch limits as the key management measure, projecting biomass to the 2025 season. From this analysis we can evaluate the probability that the biomass of the stock will be above the candidate TRPBMSY, between the candidate TRPBMSY and LRPBMSY, or below the candidate LRPBMSY in 2025. A similar analysis was also completed where the key management measure was one of a range of constant fishing mortality limits.
RESULTS AND DISCUSSIONS
Fishery Indicators. With the data from the base of the statistical fishing yearbooks (1980-2018), Fig. 1 was elaborated. This shows the time-series of annual landings of swim crabs from the Mexican waters of the Gulf of Mexico. During this period of time annual landings have averaged 10,054 t, with a decrease in catch early in the time series, reaching the lowest value (5,188 t) in 1986, followed by a generally increasing trend reaching a maximum value of 17,903 t in 2016. The annual average of the landings of the last 5 years (2014 to 2018) was 15,953 t, one and a half times more than the overall time series average.
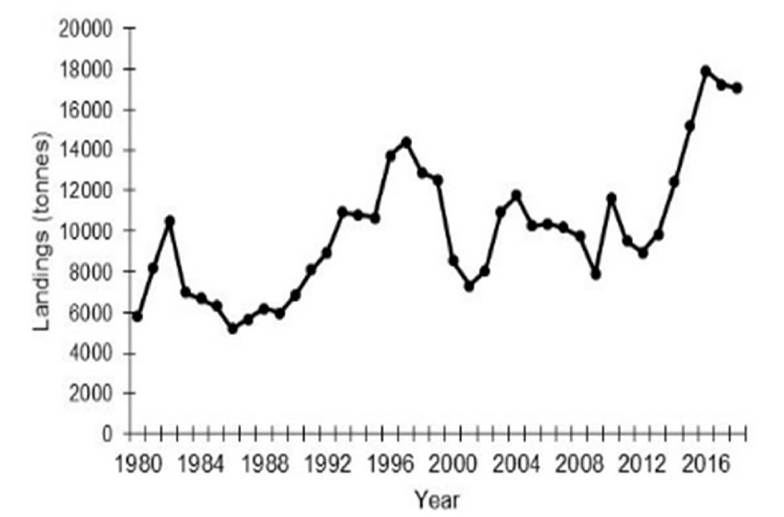
Figure 1 Annual crab landings in Mexican waters of the Gulf of Mexico from 1980 to 2018. Source: CONAPESCA Statistical Fisheries Yearbooks.
Effort. According National Fisheries Chart (DOF, 2018), in 2017 there were 452 authorized crab fishing licenses along the Mexican Gulf of Mexico covering 3,369 small-scale vessels and 324,978 fishing gear (number of traps, rings and scoops). However, there is no available number of small-scale vessels in the Tabasco State and the number of fishing gear in the Campeche State. Recently, the www.pescandodatos.org platform published, based upon CONAPESCA databases, the updated (Nov. 2020) number of licenses, small-scale vessels and authorized fishing gear per small-scale vessel for all the states and fisheries in Mexico. The platform indicates that, in November 2020, 175 fishing licenses existed for the Mexican crab fishery in the coastal Gulf of Mexico, which include 2120 small-scale vessels and 191,419 fishing gear. Analyzing the information on landings and authorized fishing effort, it is clear that there are major issues with non-authorized participants in the fishery. The State of Campeche situation is notable. While there are only 3 fishing licenses for 4 vessels and 450 fishing gear (ring nets), annual landings average 4,000 t for the last 10 years (Pescandodatos, 2021).
Stock Assessment and Status. The results of the application of the C-MSY method for estimation of r and k, through the Monte Carlo method, with the information of the catches and the previous input assumptions, Fig. 2A shows the most viable r-k pair values. The model yielded 90,154 trajectories of possible combinations of r-k; 11,147 were viable. Through the underlying principle that defines r as the maximum rate of increase for the examined population, among the highest viable r values, the model yielded a value of maximum net productivity of r equal to 1.19 with confidence intervals of 0.95 to 1.48. Fig. 2B shows the stock status, the biomass relative to the carrying capacity (k) of the population in the time analyzed. The relative biomass in the last year was 0.59 k, with confidence intervals between 0.32 and 0.69. Fig. 2C shows the exploitation rate of the stock. In the last year the exploitation rate was 0.87 with confidence intervals of 0.74 to 1.58.
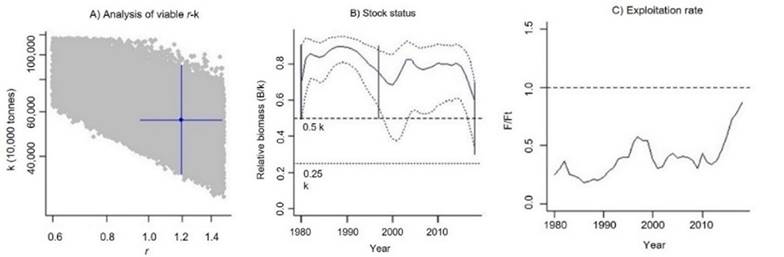
Figure 2 Results of the C-MSY method for the Mexican blue crab fishery in the Gulf of Mexico. A) Analysis of the most probable combinations of r and k. The viable r-k pairs that fulfilled conditions are show in grey. The blue cross, with approximate 95% confidence limits, marks the most probable r-k pair. B) Stock status, biomass relative to the carrying capacity of the population in the time analyzed with 2.5 and 97.5 percentiles. C) Exploitation rate of the stock.
Fig. 3 shows the equilibrium curve (Equation 3) of the Schaefer model of C-MSY, relative to B/k and indented at B/k < 0.25, to explain the reduced recruitment at low stock sizes (right side of the parabola). Values of catch relative to MSY and biomass relative to k show a stock with high resilience and with a pattern of decreasing biomass, including the phases of decrease, increase and equilibrium, as shown by the location of the points below, above and near the equilibrium curve. It is observed that during the entire period, these were around the equilibrium curve with relative biomass values higher than 0.5 B/k indicating catches that will maintain the corresponding biomass. In recent years, the last three-point values can be observed above and away from the equilibrium curve, suggesting a biomass decrease with relative values of catch/MSY > 0.9.
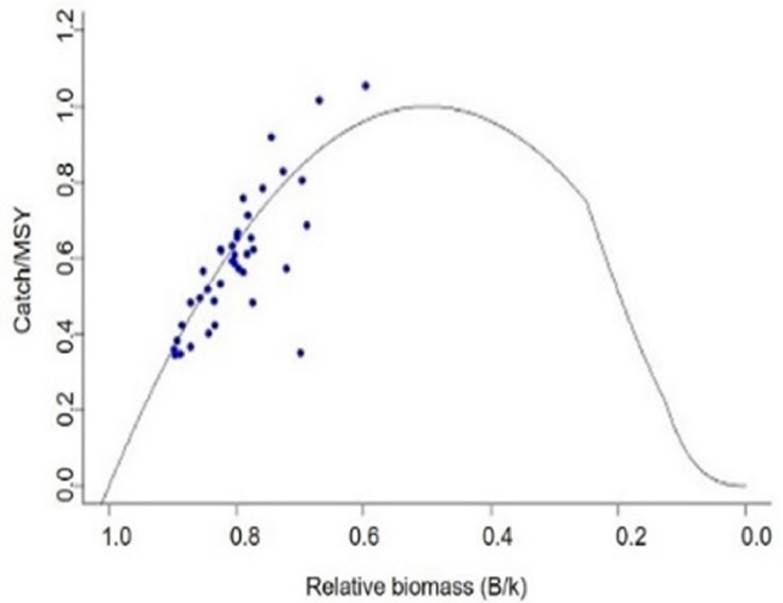
Figure 3 Equilibrium curve of the Schaefer model to explain reduced recruitment at low stock sizes for the Mexican blue crab fishery in the Gulf of Mexico. The dots indicate values of catch relative to MSY and biomass relative to k.
Surplus Production and Instantaneous Rate of Population Growth. Fig. 4 shows the surplus production (SP) (Equation 8) of Mexican blue crab stock of Gulf of Mexico, which varied between 6,088 t and 15,897 t. For the BC-GM stock an increase in the values of SP is observed at the end of the period, at which point the catch values are above the SP and the biomass shows a decrease.
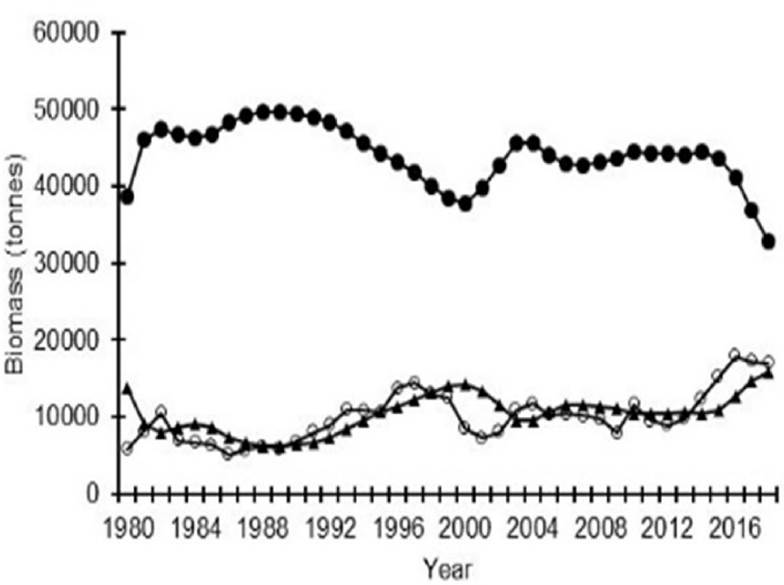
Figure 4 Annual surplus production (solid triangles), catch (open circles) and biomass (solid circles), for the Mexican blue crab stock in the Gulf of Mexico.
Fig. 5A shows the SP and its corresponding biomass for consecutive years from 1980 to 2018. The lowest value of SP is located with the maximum biomass value at the beginning of the time period and, as time progresses, the annual SP values tend to approach values close to the BMSY. Fig. 5B shows the instantaneous rate of population growth (Equation 11) from 1980 to 2018, which varied between 0.11 year-1 and 0.39 year-1. There was an initial decline in the instantaneous rate of population growth at the beginning of the period, reaching its lowest value in 1989. This was followed by a positive trend, observing two periods with a rapid growth (1988-2000 and 2014-2018) and an intermediate period of stabilization with values between 0.20 and 0.23 year-1. The maximum value for the instantaneous rate of population growth was in 2018, the last year of the period.
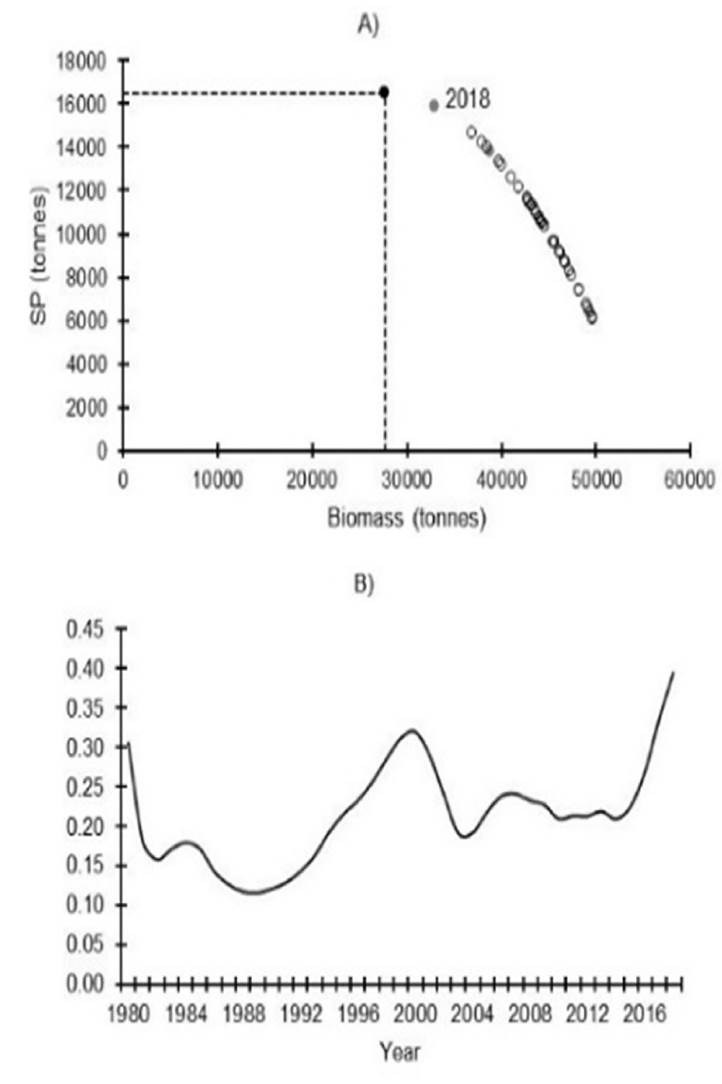
Figure 5 A) Annual surplus production of the Mexican blue crab fishery in the Gulf of Mexico (the black dot shows the estimated BMSY value). B) Annual instantaneous rate of population growth (ρtB).
Estimation of Candidate Target and Limit Reference Points for Management. The reference points (RPs) estimated by the C-MSY method (MSY, BMSY and FMSY) through the Equations 3, 4, and 5 for the BC-GM fishery and the candidate reference points (Equations 12, 13 and 14) associated with these and proposed for management purposes are presented in Table 1.
Table 1 Reference points estimated by the C-MSY method and candidate reference points for management purposes for the blue crab fishery in the Gulf of Mexico.
| Reference Points Estimated by C-MSY Method | Candidate Reference Points for Management | ||||
| Median (IC = 95%) | Target | Limit | |||
| MSY | BMSY | FMSY | BMSY | 0.5 BMSY | FMSY |
| Tonnes | Tonnes | ||||
| 16,491 | 27,687 | 0.596 | 27,687 | 13,843 | 0.596 |
| (9,641 - 28,209) | (16,921 - 45,302) | (0.479 - 0.741) | |||
The catch at the maximum sustainable yield (MSY) estimated by the model was 16,491 t in the GM. Even though Guerra-Jimenez et al., (2018), estimated an MSY of 3,350 t for the this specie, but it was done only in the Campeche state, value lower than estimated in this study, possibly since it considers a fraction of the total catches for GM and a shorter period. If the C-MSY mode were applied to each particular state, the sum of the MSY values obtained for each state should be around the MSY value obtained in this study.
During most of the period the catches remained below this level with an increasing trend towards MSY until 2016, from which time catches have been above MSY, with a decreasing trend at the end of the period (Fig. 6A). The biomass associated with the maximum sustainable yield, or TRPBMSY, was estimated to be 27,687 t. Throughout the period analyzed, the biomass trajectory remained above the TRPBMSY, though with a decreasing trend, and in the last three years this value showed a drastic decrease (Fig. 6B). Fig. 6C shows the fishing mortality (F) throughout the time-series compared to the LRPFMSY of 0.59. The annual fishing mortality throughout most the time series is less than half of the LRPFMSY value until 2014, after which it increased markedly, reaching its maximum value in the last year (2018) at 0.51. The exploitation rate for 2018 was 0.74.
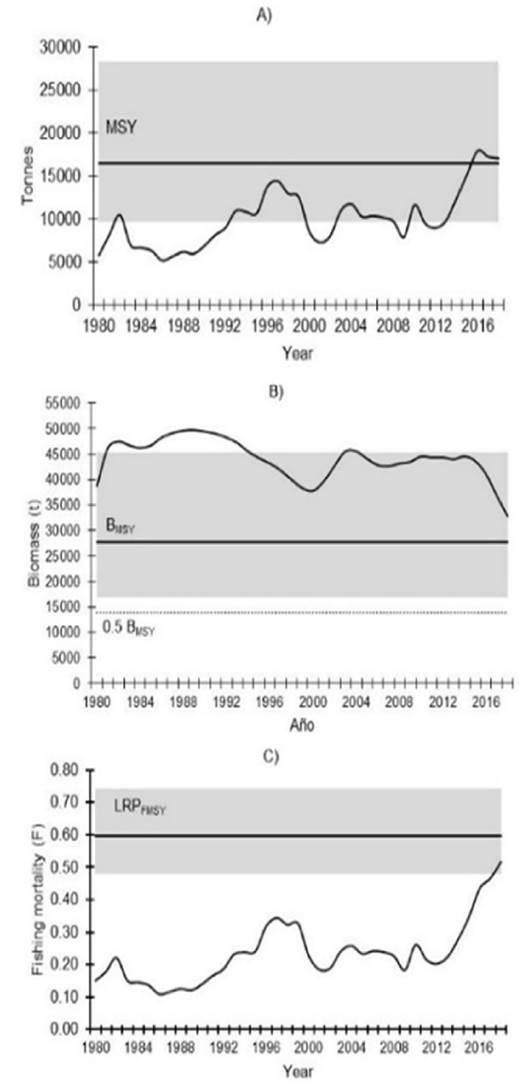
Figure 6 Results of the C-MSY method for management purposes based on Monte Carlo evaluation for the Mexican blue crab fishery in the Gulf of Mexico (BC-GM). A) Catch, MSY with 95 % confidence interval (gray area). B) Biomass trajectory, TRPBMSY with 95 % confidence interval (gray area) and LRPBMSY (dotted line). C) Fishing mortality and LRPFMSY with 95 % confidence intervals (gray area).
The Kobe plot illustrates the evolution of the fishery over this period of time (Fig. 7) and shows at the end of the period a healthy population with sustainable level of exploitation. Other studies carried out in other specific areas of the GM, (Palacios-Fest et al., 2000; Díaz de León et al., 2004; Rodríguez-Castro et al., 2017; Guerra-Jiménez et al., 2018) report levels of overexploitation, different to those which were obtained in this study.
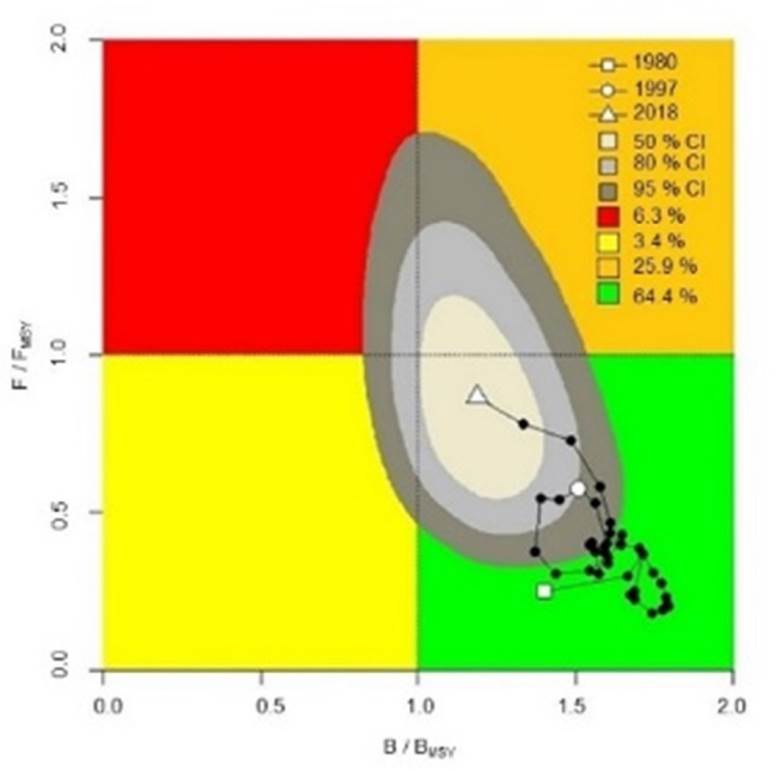
Figure 7 Kobe plot using the method of Maximum Sustainable Yield (C-MSY), for the blue crab fishery in the Gulf of Mexico. Gray areas indicate iso-probabilities.
The trajectory of the different points shows us how the population has evolved in the analyzed period, remaining in the course of time at healthy levels of exploitation (green quadrant), with a pathway towards levels close to the candidate reference points determined in this research. This low information methodology tends to generate large overall uncertainty, as can be seen in the iso-probabilities covering all quadrants of the diagram. There is a 64.4 % probability that the current status of the Mexican blue crab fishery is in the green quadrant (not overfished and not experiencing overfishing), and a 25.9 % probability that the current status is in the orange quadrant, which denotes a population that is not overfished, but is experiencing overfishing. The probabilities that the stock is overfished but not experiencing overfishing (yellow = 3.4 %) and overfished and experiencing overfishing (red = 6.3 %) are relatively low.
Management Strategies. Fig. 8 shows the projected biomass stock trajectory to 2025 for the Mexican blue crab fishery with the application of the Schaefer model (constant catch and constant fishing mortality) to evaluate the effect of implementing different reference values (Table 1) expressed as a percentage of the MSY and FMSY. With a catch limit equal to the MSY, 16,491 t as a harvest strategy, the biomass tends to decrease (Fig. 8A) but remains above TRPBMSY. With harvests equal to lower percentages of MSY the biomass stabilizes at higher values, and with a harvest value equal to the lower confidence interval of MSY, 9,641 t the biomass reaches a value equal to the upper limit of the confidence interval of BMSY. Considering the limitation of fishing mortality as a second strategy, it can be seen that establishing the fishing mortality limit at FMSY allows the biomass to decrease to a level equal to TRPBMSY by 2025 (Fig. 8B). With fishing mortality limited to lower percentages of FMSY, the biomass stabilizes at slightly higher levels (Table 2). The values of relative biomass and exploitation rate resulting from the application of the different management strategies (catch and fishing mortality) were plotted in a Kobe plot to show the predicted status of the fishery in 2025 (Fig. 9).
Table 2 Results of projections from the Schaefer model (constant catches and constant fishing mortalities) for the evaluation of possible standard management strategies, considering the catch and fishing mortality as management parameters the Callinectes sapidus (Rathbun, 1896) in the Gulf of Mexico. Outputs are long-term averages.
| 2018 | 2025 | ||||||||||
| Harvest strategy (catch) | Harvest strategy (Fishing mortality) | ||||||||||
| MSY | 0.9 MSY | 0.8 MSY | 0.7 MSY | Lower CI MSY | FMSY | 0.9 F | 0.8 F | 0.7 F | |||
| Catch (t) | 16,491 | 14,842 | 13,193 | 11,544 | 9,641 | 16,481 | 16,315 | 15,823 | 15,002 | ||
| F | 0.518 | 0.546 | 0.413 | 0.331 | 0.270 | 0.212 | 0.596 | 0.536 | 0.476 | 0.417 | |
| B/BMSY | 1.190 | 1.091 | 1.299 | 1.439 | 1.545 | 1.644 | 1.000 | 1.099 | 1.199 | 1.299 | |
| F/FMSY | 0.870 | 0.916 | 0.692 | 0.556 | 0.453 | 0.355 | 1.000 | 0.900 | 0.800 | 0.700 | |
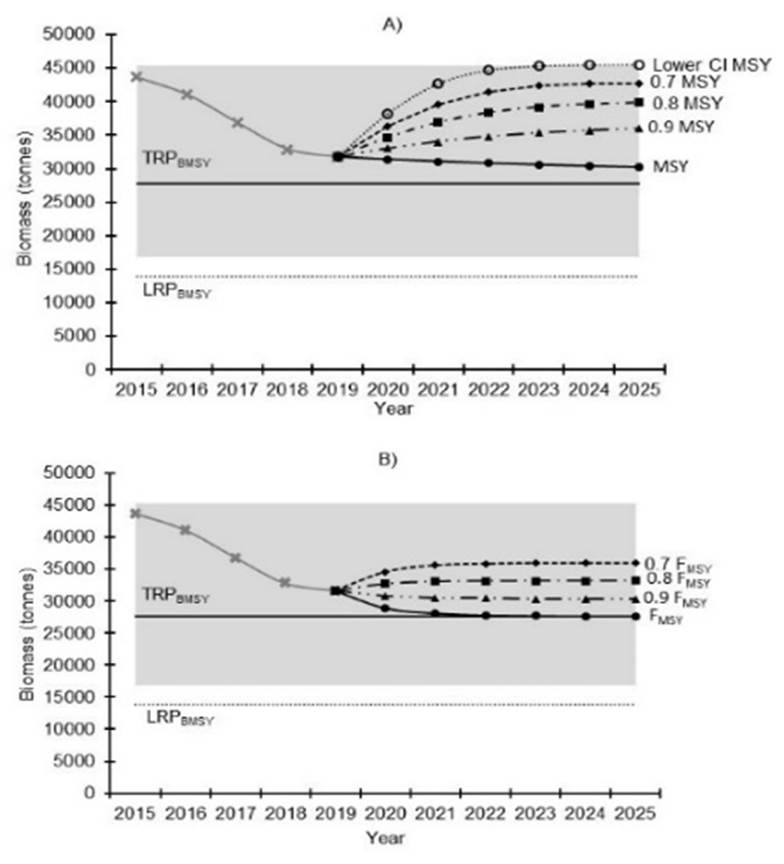
Figure 8 Standard management scenarios projected to 2025 for the Mexican blue crab fishery in the Gulf of Mexico using different values of (A) constant catch relative to MSY, and (B) constant fishing mortality relative to FMSY, as harvest strategies. The solid lines show TRPBMSY. The dotted lines show LRPBMSY. The gray area shows 95 % confidence intervals of BMSY. Refer to Fig. 7B to view the historic biomass trajectory (gray line).
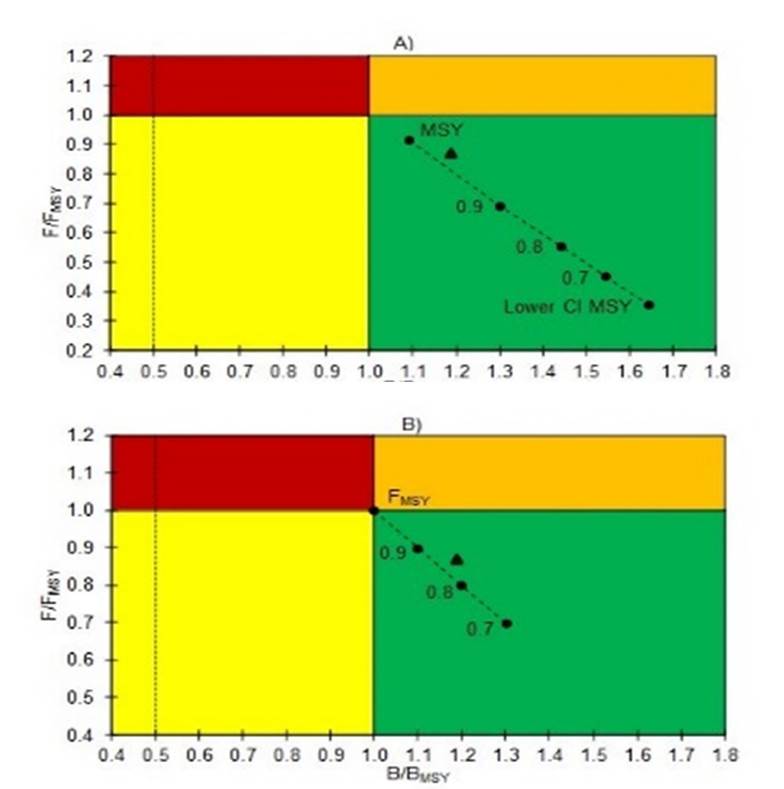
Figure 9 Evolution of the Mexican blue crab fishery in the Gulf of Mexico, projected to 2025, as a result of applying constant catch (panel A) or constant fishing mortality (F) (panel B) management strategies. The dashed line shows the LRPBMSY. The open triangle show fishery status in 2018.
Management Options Outcome Analysis. The result of this analysis shows that the application of a range of constant catch limits as the key management measure does influence the outcome of fishery performance and stock status. With a constant annual catch equal to the estimated value of MSY (16,491 t), the probability that the stock biomass in 2025 falls below the LRPBMSY is 0.39, noting that a probability of being below the LRPBMSY of 0.39 represents a relatively high LRP-breaching risk. For constant catch equal to MSY, the probability of the stock being between the LRPBMSY and TRPBMSY is 0.10, and of being equal to or greater that the TRPBMSY is 0.51 (Table 3). The outcome status of the stock projected to 2025 for a range of different levels of constant catch and constant effort in relation to MSY, are also shown in Table 3.
Table 3 The outcome status of the stock in 2025 given implementation of different constant catch or effort management options.
| Constant management option | Probability of being ≤ LRPBMSY | Probability > LRPBMSY and < TRPBMSY | Probability of being ≥ TRPBMSY |
| Catch = MSY = 16,491 t | 0.39 | 0.10 | 0.51 |
| Catch = 0.9 MSY = 14,842 t | 0.30 | 0.10 | 0.60 |
| Catch = 0.8 MSY = 13,193 t | 0.22 | 0.09 | 0.69 |
| Catch = 0.7 MSY = 11,544 t | 0.15 | 0.08 | 0.77 |
| Catch = Lower CI MSY = 9,641 t | 0.09 | 0.06 | 0.85 |
| Effort = FMSY | 0.39 | 0.10 | 0.51 |
| Effort = 0.9 FMSY | 0.38 | 0.10 | 0.52 |
| Effort = 0.8 FMSY | 0.35 | 0.10 | 0.55 |
| Effort = 0.7 FMSY | 0.31 | 0.10 | 0.59 |
Fig. 10 can be used to help select reference points and an LRP breach risk that will enable managers to keep the stock in a healthy state. For example, the level of sustainable catch that can be taken for a range of LRP breach risk from, say 5 % to 20 % can be determined, noting that these are lower than the MSY estimated in this study. Managers will need to consider the uncertainties inherent in this low information assessment methodology against the risk of overexploiting the stock by setting reference points and thus catches too high.
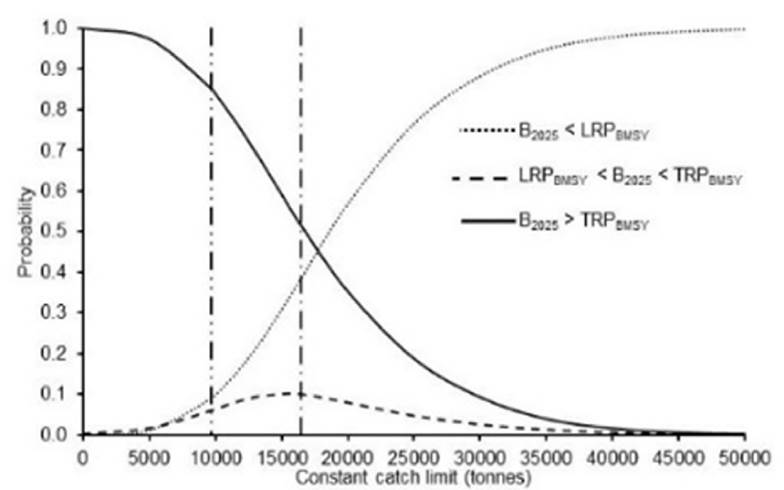
Figure 10 Analysis assuming different values of a constant catch limit as the key management measure and the resulting probability on population biomass in the year 2025 falls below the LRPBMSY (dotted line), remains between the LRPBMSY and the TRPBMSY (dashed line) and above TRPBMSY (solid line) compared to candidate reference points. The vertical lines show the value of MSY (dash dot line) and the lower CI MSY (dash dot line).
The C-MSY method determines the most viable pair of r-k that corresponds to the estimated biomass trajectory that is compatible with the observed catches and, from there, estimates the relative biomass ranges for the beginning and end of the respective time series and the respective reference points. In general, the confidence intervals indicate that the possible true value is within that range, and in the blue crab fishery of the Gulf of México the confidence intervals were wide for all the estimated parameters. With more robust fishery and fishery-independent data, different models could be applied, which could reduce these uncertainties. For a data limited fishery, such as this one, the C-MSY method provides a basis for the provision of scientific advice on which to base interim fishery management decisions such as a the harvest strategy and harvest control rules, to be refined when more robust data become available.
The C-MSY model yielded a value of r, which indicates the maximum net productivity is equal to 1.190 with confidence intervals of 0.957 to 1.480, that could be explained by a wide range of large stock sizes and low productivity (high resilience), or by a narrow range of small stock sizes and high productivity. The estimated value of r is within the high resilience range proposed by Froese et al., (2017), indicating a high recovery capacity of these species in the event of a possible diminution of the stock due to fishing pressure. The equilibrium curve shows us a stock with high resilience (typical of these species) and with a decreasing biomass pattern with increasing effort, including the phases of decrease, increase and equilibrium, as shown by the position of the points below, above and near the equilibrium curve, respectively.
The C-MSY model yielded an estimate of MSY of 16,491 t, a BMSY of 27,687 (the candidate TRPBMSY), and an estimate of FMSY of 0.596 (candidate LRPFMSY). During the last five years of the analyzed period the Mexican crab fishery in the Gulf of Mexico has shown an increase in its catch volumes, the average catches in that period was one and a half times higher than the general average, with catches exceeding MSY in the last three years. This may have played a large role in the commensurate decrease in the population biomass, which has declined to a level approaching the candidate TRPBMSY. The exploitation rates from 2012 showed a constant increase, reaching levels very close to the candidate LRPFMSY in the last year, which represents a precautionary situation. The fact that the catches have exceeded MSY in recent years indicates that the applied fishing effort was using more than the available surplus biomass, causing it to decrease. Fortunately, this stock has not yet decreased below the candidate limit reference point for biomass (LRPBMSY) or 0.5BMSY.
The Kobe plot shows that the trajectory of the size and evolution of the blue crab stock over the time series remained in good condition (green quadrant), with a healthy population that is not experiencing overfishing. The management indicators in the Kobe plot show the uncertainty of the results, and indicate that there is 0.64 probability that the status is in the green quadrant, and a 0.25 probability that the status is in the orange quadrant (healthy population but overfishing occurring), a 0.034 probability that the status is in the yellow quadrant (overfished population, but not experiencing overfishing), and a 0.063 probability that the status is in the red quadrant (overfished population with overfishing occurring).
Projecting stock status forward for five years to 2025, allowed evaluation of different constant catch limits and different constant fishing mortality limits as alternative management strategies. Assuming the starting point biomass estimate in 2015 is robust, these results show that, for the blue crab stock to retain good status in 2025 (i.e. B2025 ≥ BMSY) with no overexploitation, a maximum catch level less than MSY or fishing mortality no greater than FMSY would be required (Fig. 8 and Table 2). This also can be seen from the management outcome projections to 2025 (Fig. 8 and Table 3) which show that if a constant catch limit equal to MSY is applied, there is a 0.51 probability that the biomass will remain above the TRPBMSY, and there is a 0.39 probability that the biomass will be below the LRPBMSY. A constant catch limit equal to or less than 0.9 MSY increases the probability that the biomass will be above the TRPBMSY in 2025 to 0.60, and decreases the probability that the biomass will be below LRPBMSY to 0.30.
Based on the foregoing, it is considered that the crab fishery in the Mexican Gulf of Mexico is not overfished, with the current biomass above the candidate TRPBMSY, and is not experiencing overfishing, with fishing mortality values below the candidate limit reference point associated with F (FMSY). However, due to the uncertainties inherent in a data-poor fishery, and a need to implement a precautionary approach, we recommend that catches be limited to no more than 0.9 MSY (or fishing mortality to 0.9 FMSY).

