


 nova página do texto(beta)
 Inglês (pdf)
 Artigo em XML
 Referências do artigo
 Enviar este artigo por email
 Citado por SciELO
  Similares em
SciELO
Similares em
SciELO 
 Permalink
INTRODUCTION
Hydraulic conductivity and transmissivity of an aquifer constitutes essential data for groundwater exploitation management and planning (Kazakis et al., 2016). Measurements of aquifer hydraulic parameters can be measured by laboratory experiments or in situ tests; however, the former are inaccurate, and the latter is expensive and difficult (Bateni et al., 2015).
Hydraulic transmissivity (T) determines the flow of groundwater that is transmitted through a vertical strip of aquifer unit width under a hydraulic gradient unit (Palafox-Avila, 2006). This parameter is required in numerical flow modeling processes (Painter et al., 2007; Asfahani, 2016); horizontal recharge of fresh water (Cruz-Falcón et al., 2013); in the determination of the radius of influence of the descent cone of the well (Vargas, 2016) in order to determine the perimeters for the protection from contamination of the well water, and water management, among others. It is useful to estimate the groundwater resource and its integral management (Tizro et al., 2012). Its determination can be from the specific well capacities (Qe), which is obtained from the pumping flow Q, static and dynamic level in a pump well once it is stabilized.
Through the Thiem’s formula, assuming a fixed influence radius and that there are no load losses in the wells, using a relation between transmissivity values obtained from pumping tests and their corresponding specific capacity, dependency relations are obtained between both parameters, which can be linear or exponential (Al Farrah et al., 2013).
Determinations of T in the manner indicated above have been made successfully in different geological environments (Chandra et al., 2008; Perdomo et al., 2014; Malík et al., 2015; Sanz et al., 2005; Sánchez et al., 2013). WRI Report 87-4034 (2008) states that estimates of transmissivity from specific capabilities provide values that are used to characterize transmissivity in certain local areas and may reveal trends or patterns. However, there are cases where this relation is not met due to the heterogeneity present in the aquifer, and erroneous transmissivities that do not correspond to the aquifer are obtained.
The groundwater of the coastal aquifer of the lower right and left bank of the Sinaloa River constitutes an important element of support for the development of agricultural activity in the region, since the water from local dams is insufficient to irrigate the Guasave valley, that is why the extraction of groundwater is required through wells and bored wells. Of the total water used in agriculture, groundwater accounts for 15% and surface water 85% (Peinado-Guevara et al., 2017).
The bed of the Sinaloa River is regulated by the Gustavo Díaz Ordaz Dam. In 2005, with the water from the dam, the left and right banks of the Sinaloa River were irrigated, 54,134 ha and 45,105 ha, respectively, corresponding to the Irrigation District No.63. Guillermo Blake Aguilar is another dam in the region, with this, 21,820 ha are cultivated. CONAGUA (2000), using the piezometric fluctuations method, determined an overexploitation of 97.3 million m³ for October 1997 and October 1998 periods.
The National Water Commission has registered more than 680 pumping wells distributed on both banks of the Sinaloa River, of the which, 79 pumping tests are analyzed with their respective information of specific capacity Qe and hydraulic transitivity T. The Kalman filter is applied to the Qe-T relation which is widely used to estimate the state of dynamic systems, as an optimization method, as an optimizer that eliminates or reduces the normal random component that is the use that will be given in this work to remove the Gaussian noise component produced naturally by assuming that the radius of influence of the wells is constant as well as by the influence of the heterogeneities of the aquifer, which deviate from the theoretical considerations of the Thiem formula which assumes that the aquifer is confined, homogeneous, isotropic, horizontal, among other considerations.
MATERIALS AND METHODS
Description of the study area. The study area lies between the coordinates 25°25´8.36” and 25°48’30.04” north latitude and 108°13’32.64” to 108 °35’38.65” west longitude (Fig. 1). The climate is very hot and warm dry with rain in summer. The average annual precipitation for the period 1986-2013 fluctuated from 300 to 400 mm (INEGI, 2014). The average annual temperature is of 22 to 24° for the serie1986-2013 (INEGI, 2014). The soils are of alluvial origin, Cenozoic era, Quaternary period, Vertisol soils predominate (62.55% of the surface of the municipality) (INEGI, 2009).
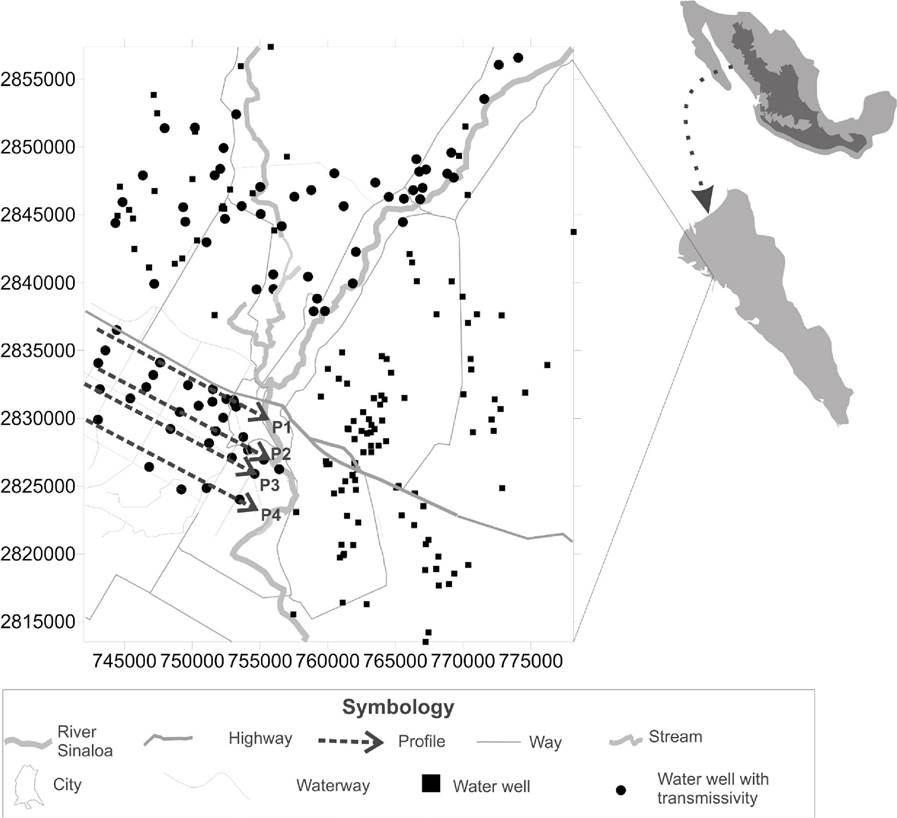
Figure 1 Location of the study area. With black circles are indicated wells with information of pumping tests and with black squares the wells with specific capacity information.
Wells information. 205 pumping wells for agricultural or domestic use that have specific capacity information were analyzed. Of these, 79 wells have pumping tests carried out by the National Water Commission using different techniques.
Of the wells with pumping test it was obtained that 11.4% of the T values are between medium to high (100 < T < 500 m2/day), 8.9% in high (500 <T <1000 m2/day) and 79.7% in very high (T > 1000 m2/day) according to the classification of Villanueva & Iglesias (1984). Those values indicate that this is a coastal aquifer with high capacity to transmit water that, in the face of a scenario of overexploitation due to its high potential to be contaminated by saline intrusion or contamination by dissolution due to the presence of evaporite bodies in the study zone.
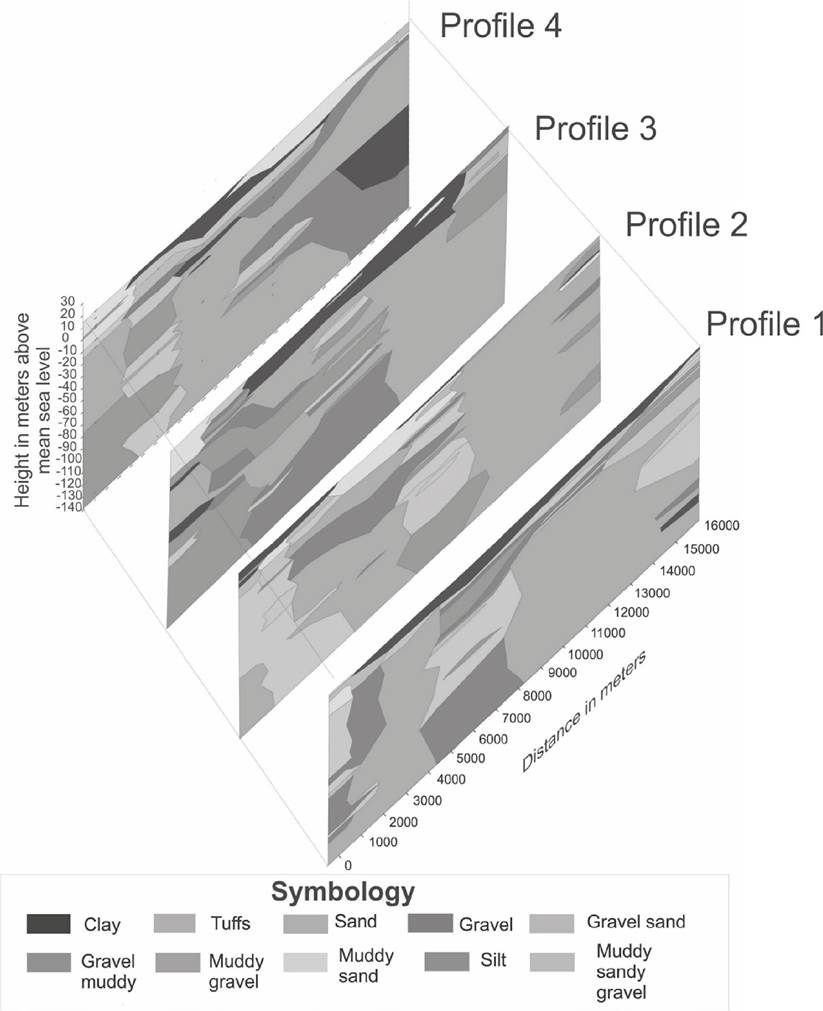
There is information of 30 lithological columns with depths ranging between 100 and 150 meters, with four lithological sections being constructed that show the heterogeneous distribution (horizontal and vertical variations) of the aquifer materials. The wells were geolocated with a portable GPS Magallanes brand.
Qe-T relation. Al Farrah et al. 2013 uses the Thiem equation which, by setting a value of R and substituting that of rw according to the radius of the well in question, Thiem’s formula can be written as
Where: T is hydraulic transmissibility (m2/day), R is the radius of influence of the pumping well (m) and rw (m) is the radius of the well, s (m) is the depression in the well. For a given R value and the corresponding radius of the well rw, the term
Hamm et al. (2005) and Galvão et al. (2016) have established relations of the form:
The range of the exponential coefficient is in a range of 0.6 to 1.4 and is related to the lithology and the aquifer (Al Farrah et al., 2013).
With 79 pairs of Qe values, T obtained from the National Water Commission, the Qe -T ratio was found without using the Kalman filter and using the filter. From the filtered T-Qe ratio, a map of equal hydraulic transmissibility was obtained, which is a guide for future drilling.
Uncertainties of Qe and T. The values of Qe and T present uncertainties due to the following: un aquifer tends to present heterogeneities and anisotropy, the well does not always cross the entire aquifer formation, part of the water pumped from the well reaches reincorporated into the aquifer, the pumping flow Q tends to present variations due to fluctuations in the electric current of the pumping system, the diameter of the well is finite and there is usually a head drop in the well due to the screen pipe or well face, the radius of influence is often unknown, among others factors. All these variables add uncertainties to the relationship between Qe and T expressed by Thiem equation, which establishes that it is that of a straight line that passes through the origin and that, due to the aforementioned uncertainties, it undergoes variations, so that the Kalman filter eliminates additive contributions whose behavior has a normal distribution (white noise uncertainty), thus achieving a better relationship between Qe and T given by the correlation coefficient.
Kalman Filter. The Kalman Filter (KF) is an optimal estimator (Kim, 2011). Faragher, 2012, indicates that it has extensive use as a noisy data smoother. Following Grewal-Mohinder & Andrews, 1995, the discrete-time model is established for a linear stochastical system which takes the form:
The zero mean uncorrelated Gaussian random processes {uk-1 } and {vk } have matrices of variances Qk-1 and R k , respectively, at time tk ; x k describe the unknown signal; yk is the measurement with white gaussian noise and the matrices Ak-1 and C k are constants. The KF as a data softener has the form:
Where
RESULTS
Geometry of the aquifer. With the information available from 30 lithological columns, the aquifer’s geometry was determined, as well as the distribution of the aquifer materials, which, as can be seen, has significant lateral and vertical heterogeneities. Figure 2 shows four profiles with the sequence of materials showing the abundance of gravel with clay-silt matrix, highlighting the presence of a gravel body, which are indicators of the ability of materials to yield water. The wells of 100 to 150 m partially penetrate the aquifer, since it cannot touch the geological or hydrological basement.
Relation between specific capacity and hydraulic transmissivity. The empirical approach is based on determining the empirical relations between T and Qe, which are regarded as aquifer and area-specific (El-Naqa, 1994; Al Farrah et al., 2013). Table 1 shows the values of hydraulic transmissivity, and specific capacity Qe. Figure 5 shows the relation between transmissivity and specific flow rate with an adjustment of 0.989, so it is possible to estimate the transmissivity in function of its specific capacity. T is directly proportional to the specific flow, such as those obtained by Bosch, 2014, Chandra et al., 2008, Ebong et al., 2014 and Perdomo et al., 2014.
Table 1 Wells data from pumping tests and specific well capacities.
| Coordinates | Hydraulic transmissivity | Specific well capacities (Qe) | Coordinates | Hydraulic transmissivity | Specific well capacities (Qe) | ||
|---|---|---|---|---|---|---|---|
| X | Y | m/day | lps/m | X | Y | m/day | lps/m |
| 749489 | 2844495 | 173 | 7.5 | 767015 | 2846992 | 3629 | 30.6 |
| 750195 | 2851435 | 207 | 3.2 | 767267 | 2848352 | 3646 | 29.4 |
| 758551 | 2840450 | 242 | 3.5 | 766837 | 2846157 | 4441 | 47 |
| 749330 | 2845569 | 251 | 2.9 | 752315 | 2849936 | 4454 | 37 |
| 744860 | 2845948 | 276 | 3.9 | 758790 | 2846828 | 4687 | 34.5 |
| 759225 | 2838831 | 302 | 3.8 | 756001 | 2839538 | 4700 | 34.6 |
| 747965 | 2851393 | 354 | 4.8 | 766321 | 2846824 | 5435 | 37.2 |
| 766554 | 2849107 | 492 | 4.2 | 768835 | 2848045 | 6834 | 75.9 |
| 763521 | 2847384 | 570 | 5 | 755058 | 2845062 | 8208 | 57.5 |
| 761184 | 2845644 | 829 | 6.9 | 751056 | 2824860 | 3410 | 27.506 |
| 751656 | 2847922 | 864 | 10.2 | 753500 | 2824020 | 2925 | 26.051 |
| 752414 | 2844704 | 924 | 20.8 | 754605 | 2825918 | 1588 | 13.136 |
| 769138 | 2849591 | 924 | 8 | 753768 | 2828632 | 1909 | 16.313 |
| 764518 | 2846326 | 1020 | 8.7 | 753040 | 2831360 | 2888 | 27.334 |
| 761854 | 2839960 | 1054 | 11.6 | 752519 | 2831428 | 3158 | 27.425 |
| 759801 | 2837919 | 1210 | 14.5 | 751240 | 2828174 | 3116 | 25.799 |
| 755019 | 2847063 | 1253 | 11.2 | 749198 | 2824766 | 4078 | 35.123 |
| 744330 | 2844398 | 1305 | 11.1 | 746824 | 2826422 | 4569 | 40.408 |
| 765560 | 2844468 | 1339 | 12.9 | 748387 | 2829222 | 4295 | 37.584 |
| 762087 | 2842274 | 1382 | 12 | 749063 | 2830475 | 2354 | 17.067 |
| 758964 | 2837902 | 1469 | 15.7 | 750466 | 2830934 | 2039 | 16.423 |
| 760495 | 2848063 | 1529 | 14.2 | 751524 | 2832152 | 1695 | 14.293 |
| 746357 | 2847915 | 1555 | 20.3 | 747628 | 2834115 | 1369 | 11.574 |
| 755981 | 2840616 | 1555 | 17.2 | 746611 | 2832315 | 1050 | 10.214 |
| 751052 | 2842985 | 1564 | 16.3 | 745434 | 2831474 | 2401 | 21.481 |
| 754746 | 2839514 | 1620 | 14.2 | 756419 | 2826252 | 1721 | 14.786 |
| 753243 | 2852417 | 1728 | 16.8 | 743042 | 2829906 | 2117 | 19.524 |
| 756610 | 2844169 | 1771 | 18 | 743186 | 2832156 | 452 | 3.908 |
| 753091 | 2831170 | 1901 | 21.5 | 743064 | 2834081 | 1676 | 14.466 |
| 753236 | 2830864 | 1901 | 21.6 | 744423 | 2836516 | 987 | 10.424 |
| 757544 | 2846342 | 2125 | 19 | 743590 | 2835017 | 715 | 5.937 |
| 774069 | 2856590 | 2195 | 21 | 755282 | 2826961 | 1725 | 16.063 |
| 772631 | 2856067 | 2316 | 22.4 | 747126 | 2833203 | 2319 | 19.399 |
| 769315 | 2847747 | 2411 | 25.9 | 749683 | 2832454 | 2325 | 21.208 |
| 765637 | 2846194 | 2635 | 28.1 | 751488 | 2831230 | 1254 | 11.335 |
| 747203 | 2839926 | 2730 | 23.2 | 752286 | 2830051 | 2685 | 25.924 |
| 766768 | 2848188 | 2981 | 29.4 | 751737 | 2829058 | 3139 | 29.707 |
| 753652 | 2845651 | 3041 | 27.3 | 752929 | 2827102 | 2063 | 17.914 |
| 752065 | 2848392 | 3283 | 37.4 | 754113 | 2827671 | 2207 | 18.492 |
| 771567 | 2853551 | 3473 | 37.3 | ||||
Relation is given by:
Bosch (2014) states that the factor that relates to T with Q e oscillates from a range between 100 to 500, so the relation obtained is consistent with that obtained in other aquifers by other authors.
Figure 3 shows that it is possible to estimate the hydraulic transmissivity in function of specific capacity. The application of the Kalman filter to the T-Q e relation improved the correlation coefficient going from 0.95 to 0.97. Figure 3c shows how applying the Kalman filter reduces the dispersion of the data and therefore increases r, as is the case.
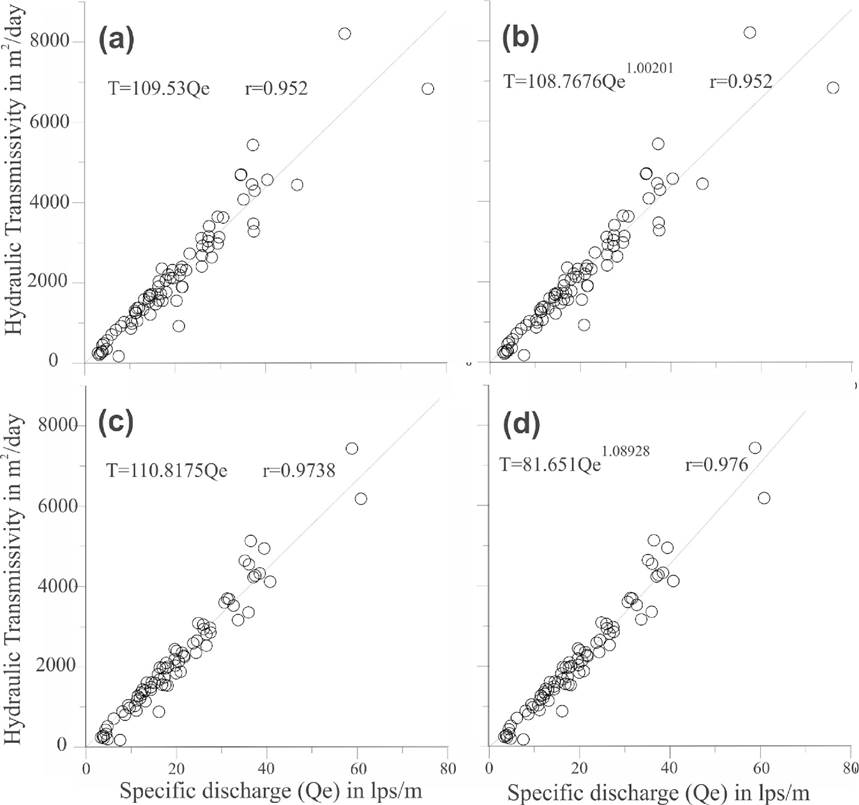
Figures 3a-d Regression line fitting specific discharge (Qe) and transmissivity (T) data from pumping tests in 79 wells: a) linear regression; b) exponential relation; c) linear regression with Kalman filter; d) exponential relation with Kalman filter.
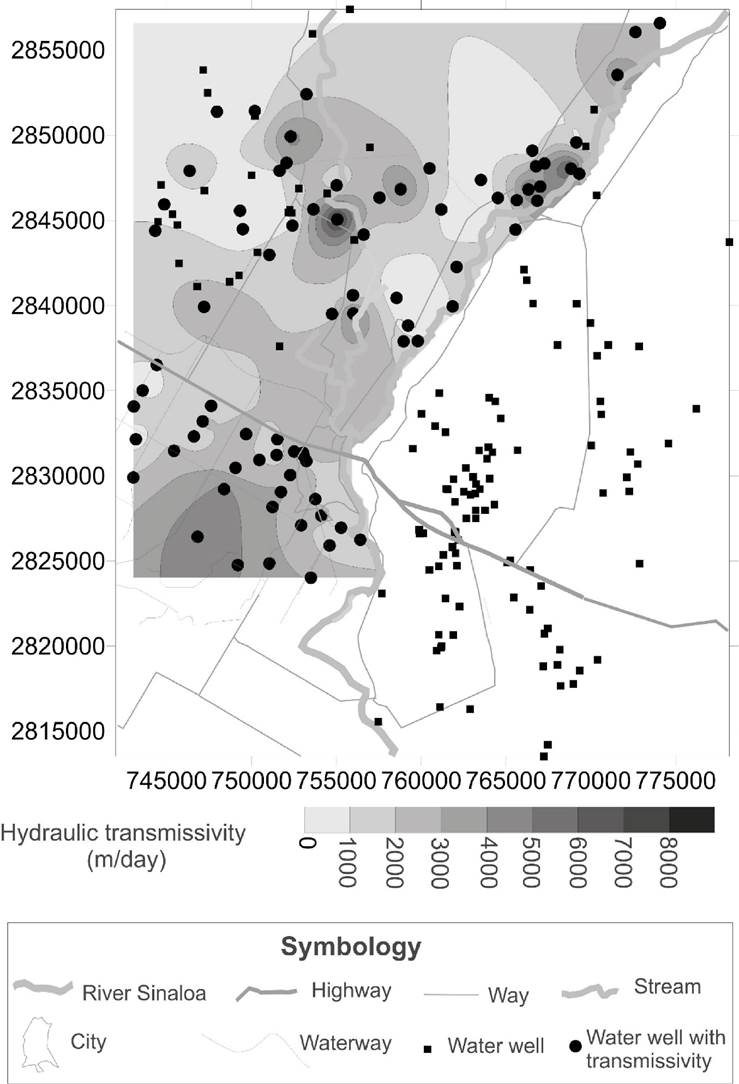
Practical application. In 126 pumping wells Q e was calculated by knowing the expense, static and dynamic level of the water in each well, estimating T from a relation T =109.533Q e . The map of equal values of hydraulic transmissivity shows that it is lower on the left bank of the Sinaloa River, which is consistent with that established by Norzagaray-Campos (2003), who built four profiles parallel to the river, indicating that the lithological changes are explained by the migration of the Sinaloa River from East to West.

DISCUSSION
Specific capacity is directly proportional to T, such as those obtained by [Ebong et al., 2014; Perdomo et al., 2014, Bosch, 2014, Zeferino et al., 2016, Hamm et al., 2005 y Galvão et al., 2016]. The relation T/Qe = 109.533 is in the range proposed by Bosch (2014) who established that the factor that relates T with Qe oscillates in a range between 100 and 500, reason why the relation obtained is consistent with that obtained in other aquifers, as reported by Perdomo et al. (2014) T = 135.36Qe - 50 and Zeferino et al. (2016) of T = 100.23 Qe - 7.126 in different geological environments. In other studies, this relation has been of the exponential form as reported by Hamm et al. (2005) T=0.99 Qe 0.89 where T and Qe are in m2/day. Galvão et al. (2016) also proposes an empirical relationship in karst systems in Sete Lagoas, MG, Brazil. T=330 Qe 0.21 where T and Qe are in m2/day, the coefficient of determination R2 was 0.55.
It has been found that the Kalman filter is a useful tool in the determination of the relation T-Qe, since it improved the relation between both parameters by increasing the correlation coefficient. The Thiem formula has a practical application that, although it is a relation for a homogeneous and isotropic medium, works in areas that present heterogeneities as is the present case.
Heterogeneities that are considered to have an effect with normal behavior in the T-Qe relation, which can be reduced by the Kalman filter, as indicated, the correlation increased from 0.95 to 0.97.
The T-Qe relation has practical application since it allows to characterize the aquifer environment concerning T.

