


 nova página do texto(beta)
 Inglês (pdf)
 Artigo em XML
 Referências do artigo
 Enviar este artigo por email
 Citado por SciELO
  Similares em
SciELO
Similares em
SciELO 
 Permalink
INTRODUCTION
Water is an essential component of life; many of our vital processes are closely related to water, we need it for digestion, for the transportion and evacuation of exogenous substances and thermoregulation of our bodies (Riveros-Perez & Riveros, 2018). Similarly, many of the foods we eat are directly or indirectly depend on water, some of them for growth, such as fruits and vegetables, while for others it is necessary for its manufacture. In addition to domestic use of water, it is also used in a wide variety of industrial processes, which take water directly from rivers, lakes or the sea, initially affecting their flow or volume. This situation takes place in many countries, whether they are industrialized or not, for example: The River Nile in Africa (Melesse et al., 2014), some rivers in Spain as Ebro (Barceló & Petrovic, 2011) and the Segura (Pellicer-Martínez & Martínez-Paz, 2018), San Francisco river in Brazil (Dai et al., 2016), the basin of the rivers Murray and Darling in Australia (Bishop-Taylor et al., 2015), Mississippi river in the United States (Gwinnup & Schnoor, 2014) or the ecological disaster of the Aral Sea in the center of Asia (White, 2013). Once these processes are finished, the water is returned to its source, in many cases without going through a purification process (Filtration + Separation, 2018; An et al., 2014) and dragging large amounts of sediments (Bussi et al., 2016; Shrestha & Wang, 2018; Ferronato et al., 2015). This has many of the major tributaries to become severely contaminated, thus producing the consumption of contaminated water, which in turn results in a decrease in the quality of life and health of people living in the watersheds of these rivers, lakes or seas.
In China, for instance, rivers have been an important part of their cultural and historical development. However, governments have put their economy above their environmental heritage. This has caused many of the river basins in this country to be at risk. Aspects such as mining (Egidarev & Simonov, 2015), pollution and the abusive use of land (Ding et al., 2016; Cheng et al., 2018), have caused deterioration of water quality for human and animal consumption. This situation has forced them to look for new alternatives for the use of water and to create models and methods for a better quality of it (Wang et al., 2013).
Therefore, the study of watersheds, especially those of rivers, is a matter of great importance to both local and state governments. For some authors such as Musy & Higy (2004), all living beings including humans, are part of one or more watersheds, implying that we are closely related to their well-being. River basins transport water from water births in the mountains to the cities; and that is where its importance lies, because the welfare of the watersheds is closely related to water quality, and consequently with the health and quality of life of the inhabitants of the basin.
There are many factors that affect the water quality of a river: the topography of the basin, composition of the soil, present flora and fauna, and even plate tectonics (Li & Wang, 2017; Lollino et al., 2015) can seriously influence this aspect. Similarly, human presence is one of the key elements in the pollution of watersheds; the growing population has caused the gap between city boundaries and water sources to become even shorter. Another factor of great human impact on aquatic media is the wastewater that comes from cities, industry, and others (Liu et al., 2017).
Currently, the use of the theory of complex networks for the modeling of watersheds is presented as an effective alternative, especially for the modeling of its topography. Some authors like Webb & Padgham (2013) and Fang et al., (2017) have identified the relationship between river basin networks and complex networks, and have used this theory to model aspects such as the dynamics of the population around them. Other authors like Wu et al., (2013), have shown how to model the topography of a watershed using the theory of complex networks to represent the network of rivers of a watershed. Similarly, Halverson & Fleming (2014) use network theory to guide the management of water resources and decision-making regarding the location of river flow meters in British Columbia (BC) coastal mountains and Yukon in Canada. In this research, the nodes of the network are the location of the stations of the river flow meters. Authors were able to identify communities of nodes with network theory; each of them determined the seasonal flow regime and geographic proximity with other communities. In the same way, the application of this theory determines a group of key stations in the interconnection with other communities of nodes that are difficult to see to the naked eye.
This work aims to represent a drainage network of a watershed by means of a graph and study its most representative measures to relate them to the specific characteristics of the hydrographic network. For this, the river basins of the department of Quindío in Colombia, South America, will be taken as a case study. In order to develop this work, the second section will present the methodology for the construction of a graph (network), taking into account the hydrographic concepts related to river basins and the theory of networks. In the third section, the methodology for the construction of the graph that represents the hydrographic network of the basins of the Department of Quindío is applied. In the fourth section, an analysis of the structure of the network was carried out and some topological measurements were calculated. Finally, the conclusions of the work will be presented.
MATERIALS AND METHOS
This study will take into account important aspects of river basins of rivers, for this reason, in the first part will be a review of some concepts that were considered to make the process of modeling; subsequently, the process necessary for the implementation of the network of a watershed will be presented.
The topography of river basins is determined by many factors: plate tectonics, the amount of rainfall, the number of tributary rivers, the erosion processes, the composition of the terrain, among others (National Geographic Society, 2012). In addition, the technological and industrial development of man has led to the intervention and modification of river basins, for instance: hydroelectric, dams, water canalization, wastewater dumping and artificial canal construction, among others. All of these factors have affected water quality and therefore, the entire ecosystem around the watershed.
The terrain where the river basins are located has many characteristics that can eventually be modeled by means of nets. Authors like Chow et al., (2010), suggests that a watershed is a system composed by many parts connected to each other, which would be consistent with the definition of network exposed by authors such as Newman (2003), Newman et al., (2006), Estrada (2012), and Boccaletti et al., (2006). Other authors such as Schumm (2007) show characteristics of rivers as the degree of sinuosity and length, which can be added as a characteristic of the edges to the network, as shown below.
All the watersheds have a main river that collects the waters of the tributary rivers. In turn, these have other rivers that are tributary of them. As it can be seen, modeling watersheds presents many challenges (Hodges, 2013). However, the theory of networks can showcase a general picture of the hydrological network and can also show other aspects that cannot be appreciated through the use of traditional tools.
Networks. In the eighteenth century, Leonhard Euler gave rise to the graph theory by solving the following problem: in the city of Königsberg (currently called Kaliningrad), in the Pregel River, there were two islands connected by means of seven bridges that joined four terrestrial areas as seen in Figure 1. The problem was to answer the following question: is it possible to traverse each bridge exactly once, returning to the starting point of the route? Euler created a theory that allowed to prove that it was not possible (Harary, 2018).

Euler was the birth of what we know as the intuitive idea of graph (network), which tells us: a graph is the representation of a system, which consists of nodes (vertices), which represent the inputs of the system. These are connected through edges, which represent a particular class of connections between two inputs (Estrada, 2012; Boccaletti et al., 2006; Sivakumar & Woldemeskel, 2014; Brandes, 2005). For example, in the problem of Figure 1, the nodes are two banks of the river and two islands (zones A, B, C and D), while the edges are the bridges that connect the islands and the banks of the river. In short, a network or graph is a gut G=(V,E,f) where V={v1,v2,…,vn} is a finite set of vertices or nodes, E={e1 ,e2 ,…,em }. A set of edges, and is a function, which associates some elements of E with a couple of elements of V, such that if vi , vj ∈ Then f:eq → [vi, vj] and f:eq → [vj ,vi] .
There are many areas of application for the network theory, including the study of social networks such as Facebook and Instagram, where nodes are users and edges are friendship relations (Chan, 2018; da Costa, et al., 2017). In the trading networks, the nodes are the countries and the edges represent the commercial exchange between these (unilateral or bilateral) (Du et al., 2016; An et al., 2014) in bibliographic networks, the nodes are books or articles and the connections between these are the citations that are made between these (Caschili et al., 2014). In biology we can find several examples, like the study of the interactions between proteins (Olyaee et al., 2016), the behavior of species (Riveros-Perez & Riveros, 2018) and in the transmission of diseases (Chow et al., 2010). Some authors like Fang et al., (2017) and Wu et al., (2013) create networks from the same hydrological network of a watershed, in those the nodes can be specific places in the network, for example the intersections and the water births, the edges are the flows of the rivers that connect these.
Hydrological networks. For the construction of the network it is necessary to identify the nodes, the edges and the weight associated to these. All this was carried out according to the theory of networks, in particular the modelling of fluvial networks proposed by Wu et al., (2013). Similarly, most river basins, whether natural or modified by humans, present a network structure known as dendritic networks; this type of networks are ideal to model many natural phenomena, among which are counted the cause of the rivers (Brown & Swan, 2010; Labonne et al., 2008; Seymour et al., 2015; Swan & Brown, 2014). We must also bear in mind that the basins of the Department of Quindío are mountain basins, implying that the rivers that compose it have a low degree of sinuosity (degree of sinousity), almost always composed by half-braided fluxes (degree of braiding) and lscarcely branched (degree of anabranching), as shown (Schumm, 2007).
Nodes. The nodes can be classified according to their origin.
Natural nodes: They can be sources of rivers, bifurcations, confluence of rivers or exits.
Non-natural or engineering nodes: Within this classification are hydroelectric plants, water tanks, pumping stations, water transfer projects, in general, waste water dumping or any artificial element that is considered external to the natural cause of the rivers.
For this work, the concept of node will be extended to take into account the classification of the nodes according to natural or engineering:
The whole of all nodes is represented by as:
where, if k = 1 then vi1 is a natural node, in the same way, if k = 2 then vi2 is an artificial or engineering node. According to Wu’s proposal (Wu et al., 2013), nodes can be: the births of rivers, the points where two or more rivers are connected and the river mouths in addition to the places that represent dumping or monitoring areas in the river.
Edges: As it has been shown already, the edges represent some kind of relationship between two entities. In our case, the edges represent the natural causes of the natural or artificial rivers and channels. Because the waters of the rivers flow in the same direction, then the net is directed (Digraph). The edges will be responsible for connecting births, bifurcations, confluences (natural nodes) and river monitoring sites (engineering nodes).
There will be four basic forms of connection between edges: Serial connections, parallel and mixed connections which in turn are divided into bifurcations and confluences as seen in the Figure 2.

The set of edges is given by the set of tuples of nodes in the following form (Estrada, 2012):
Where V is the set of nodes, vi k dnd vjl with k=1,2 and l=1,2 are the initial and final components of the edge ei , which, will be represented with the tuple (vi k ,vj k ,); ss the graph we refer to is a directed graph, then (vi k ,vj k ,) ≠ (vj k ,vi k ,).
Based on the information provided by the nodes and edges, the R adjacency matrix is created, which determines how nodes are connected. If the network has Nodes, then the adjacency matrix will be in n×n size.
If r ij indicates that the node vi k is connected to the node vj l with k=1,2, and l=1,2. likewise, if r ij , then the nodes vi k , and v j l are not connected. However, and as in the methodology showed in (Wu et al., 2013), rij ≠ rji , since it is a directed graph.
Weight. Is defined as follows (Boccaletti et al., 2006; Estrada, 2012): See a W={w1 ,w2 ,…,wm }, such as wi∈R, then a weight net is the gut G=(V,E,W) where is V the set of nodes or vertices, E is the set of edges and W the set of weights.
Weights can represent specific properties on the edges, for example, in social networks (McDonald & Hobson, 2018) the weight can represent the degree of friendship between two people, the traffic networks (An et al., 2014) can represent the level of automobiles that transit by determined way. In hydrologic networks, the weight represents the length of a river, as Wu et al., (2013) shows. However, the weight could determine physical chemical variables of water such as flow, pH, temperature, biochemical oxygen demand, dissolved oxygen, among others.
Application: Department of QuindíoThe Department of Quindío is located in thecenter-west of Colombia in South America, in the Andean region, in what is known as the coffee axis. Quindío has five watershed management units (WMU), which are:
In Figure 3 can be observed that these rivers are tributaries of the La Vieja River, which is born at the intersection between the Barragán River and the Quindío River.
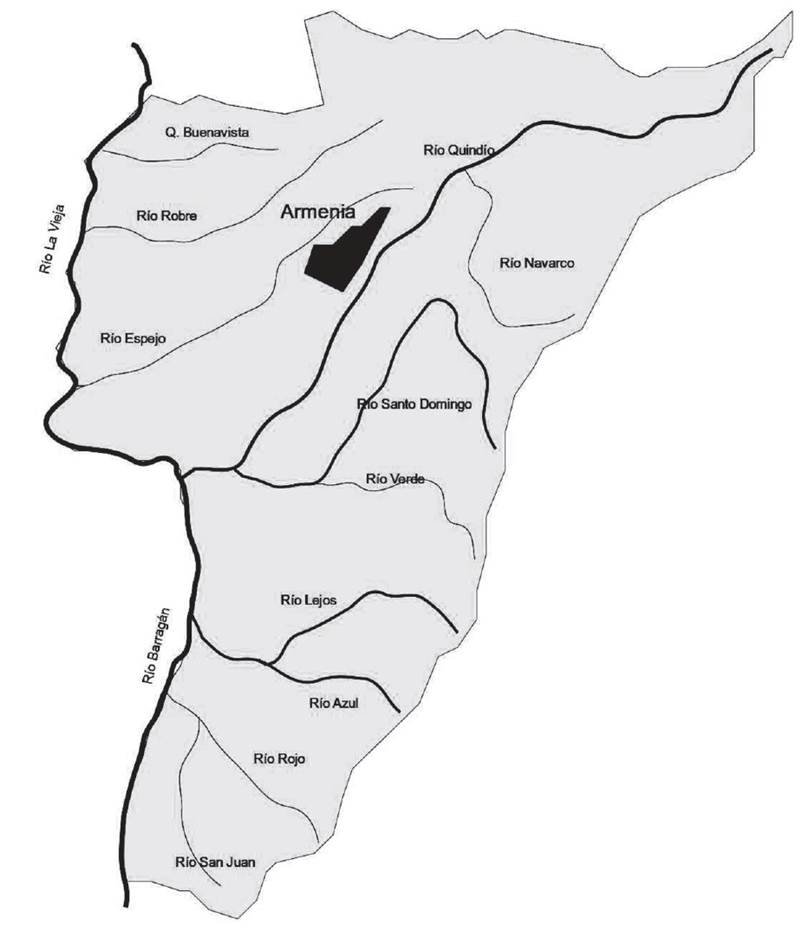
The main WMU and the most extensive is the Quindío River, with a total area of 688.84 km2 And a perimeter of 230.25 km. In this area of influence are included the municipalities of Salento, Calarcá, Armenia, Cordoba and Buenavista, with about 300,000 inhabitants representing the of the population 55% of the Department of Quindío (Contraloría General de la República de Colombia, 2016; Barrios & M. Rodriguez, 2011). In particular, the Quindío River basin has its origin in the Natural Park of Los Nevados, in the Laguna de la Virgen, at an approximate height of 4,200 M.A.S.L. runs through the department of Quindío in the direction east to south-west, and has more than 16 tributary streams.
It is important to emphasize that the basin of Quindío River, in its middle part, receives direct dumping of Boquía, and indirect of the municipalities of Salento, Armenia, Calarcá and Córdoba through the Quebradas El Mute, La Florida, San Nicolás, El pescador and the rivers Santo Domingo and Verde. Other watersheds also receive dumping from other cities, but they are not as large compared to the main WMU.
The water in the Department of Quindío, for the most part, is used in agricultural and livestock activities, as it is the case of the Oak WBU, Buenavista, Rojo and Lejos. The water in the Quindío River basin is used for human consumption and energy generation, and to a lesser extent at the industrial and agricultural level. The industrial activity is concentrated in Armenia, the capital of the department, located in the central part of the Hydrographic network (Fig. 3). The main industrial activities are the processing of leather and the slaughter plants of cattle for meat (Gallego et al., 2015).
Diagram of the Hydrographic network of the Department of Quindío. The Figure 4 represents the hydrographic network of the five basins in the Department of Quindío. In this one observe three colors: the red ones represents the artificial nodes (21 nodes), the green ones the natural nodes that are births of rivers or ravines (194 births), the light blue ones indicates the natural nodes that are intersections between rivers and/or ravines (191 intersections of rivers). In some cases, intersection nodes can be engineering nodes or natural nodes. In general, the network has 409 edges and 408 nodes. This network is a digraph or directed graph (Estrada, 2012), because the direction flows according to the cause of the rivers or ravines.

RESULTS
Degree distribution. Every network has an adjacency matrix similar to that found in the eq. 3. This matrix indicates how nodes are connected, so for example, if in the component r3,2=1, this shows that the nodes v3k and v2l with k=1,2 and l=1,2 are connected, ie there is an edge that has the nodes v 3 k and v2l. as ends.
However, the degree of a node denoted as d(vik), is defined as the amount of edges that affect it. This value is calculated in terms of the adjacency matrix R (Estrada, 2012):
In a directed graph it should be taken into account that a node or vertex has edges that affect it and edges that depart from it; then there is entry and exit.
With the eq. 5 and eq. 6 Fig. 5 part (a) is built. Where the horizontal axis shows the degree of input and output of the nodes. The vertical axis represents the number of nodes. In addition, the blue line represents the degree of entry and the orange line the degree of output. For example, the blue dot (2, 191) indicates that 191 nodes have input grade 2; in other words, the graph has a mixed connection as shown by Fig. 2 (d), which in the hydrological network is the confluence of two rivers.

In the Fig. 5 (a) orange line, you can see that all nodes in the network except the end node, have grade one; that is, they all follow the same trajectory of the river and there are no branches or deltas (see Fig. 2 (c)) in any of its sections.The average degree of input and output of a network can be calculated with the following formula:
Where E is the set of edges (see Set 2) and V is the set of nodes (see Set 1). In addition |E| and |V| is the number of edges and nodes respectively. Using eq. 7, the average degree of input and output for the network (Fig. 5) It 1.0025.
Another way to study the degree of a node is by means of the distribution of probability of degree. Where P(k) represents the probability that a randomly selected node has a degree. In Figure 5 (b) network grade distribution of Figure 4 is shown:
In Figure 5, the horizontal axis shows the degree of input and output of the nodes. The vertical axis represents the probability of the node, denoted as P(k).
In the Figure 5 (b) it is observed that 47.54% of the network nodes have grade zero. In other words, there are 192 natural nodes that are river or ravine births. In addition, in Figure 5 (a), it is appreciated that 20 of them have grade one input, these are just the 5.1% of the nodes, but they are the ones that most impact the network, since they are monitoring points of the Regional Autonomous Corporation of Quindío CRQ. Similarly, 46.81% have grade two input, these nodes represent the intersections of the rivers.
To better visualize the input and output level distribution of the network, Aksakalli (Aksakalli, 2017; Aksakalli, 2018) algorithms will be used; in Figure 6 (a) we see that the nodes of the intersections of the rivers are the ones that have the highest degree of entry, this because of the way in which the mountain basins are connected. In the case of Figure 6 (b) i.e. the degree of output, we see that the entire network, except for the last node, have the same value, which in this case is one. The distribution of the grade of drainage network of the basins of the Department of Quindío is composed specifically by serial and mixed connections as seen in Figure 2 (a) and (d), where two rivers are joined in one.

Figure 6 Distribution of grade displayed on the network, using the algorithms posed by Aksakalli (Aksakalli C., 2017; Aksakalli C., 2018)
Network density. Given a network G =
(V,E,f ) not directed with
|V|=n number of nodes,
For example, the density of the graph of Figure 7
(a), using the eq. 8's D=1 In this case the net is
perfectly dense, since it has three edges out of the three possible ones. For the
Figure 7 (b), the density is

For a directed network, the density is
The assortativity of the network. The assortativity of a network is a measure of degree correlation that is used largely in social networks. Estrada (2012) shows how to calculate this value for a network:
Where -1 ≤ r ≤ 1. The assortativity describes how nodes are connected. Thus, a network is r>0, i.e. low-grade nodes connect with low-grade nodes or high-grade nodes connect to high-grade nodes. In a similar way, a network is disasortative if r<0, which indicates that high-grade nodes, connect with low-grade nodes or low-grade nodes connect to high-grade nodes. If r=0 or its value is very close to zero, we say that the net is neutral (Newman, 2010; Foster et al., 2010). In the case of the network of Figure 4, its assortativity is 0.014, this makes it a neutral network, that is to say, in the network there is no connection pattern between the nodes.
Network eccentricity. In Figure 8, the distribution of the eccentricity of the network of the basins of the Department of Quindío is shown. In the horizontal axis there is the degree of eccentricity of the nodes and in the vertical axis, their quality. The concept of eccentricity e(v) is defined as the maximum distance of a node v with respect to all possible paths passing through that node (Estrada, 2012), i.e.:

Figure 8 Distribution of the degree eccentricity of the Hydrographic Network of the Department of Quindío.
The maximum eccentricity between the nodes is known as the diameter of the network, while the minimum is known as radius. Figure 8 shows that the net has a radius of 32 and a diameter of 64; That is, the shortest path will have a distance of 32 (in terms of edges), while the longer path will have a length of 64. Remember that these measures are in terms of the distance between nodes, the do not represent a physical distance. The periphery of the network are these nodes that are farther away, in this case the nodes 0, 1, 214 and 215 are the ends of the network, while the node 426 is its center.
The center of this network (node 426 Cuenca River Quindío), represents a critical point within the drainage network of the Department of Quindío, because it is an artificial node where industrial waste is dumped from a meat processor. Being the central node of the network, it has great influence downstream in the river (Digraph), this station presents high degrees of contamination, as one can see in the reports of the CRQ (CRQ (Corporación Autónoma Regional del Quindío), 2017). In contrast, the periphery of the network is determined by nodes 0 (Quebrada Cárdenas), 1 (Quebrada Amargura), 214 (Quebrada la Sierra) and 215 (Quebrada Costa Rica), which represent river births that according to the same source are relatively clean nodes within the network.
Having a network with a radius of 32 (yellow dot), diameter of 64 (red dot), and node 426 as the only central node; the panorama for the watershed is critical, due to the fact that the centre of the downstream network is the area with the greater presence of human industries and waste, therefore, the most polluted area, consequently the panorama for the middle of the route is shown with a high degree of pollution; while from the center to the back, at the same nodal distance (and almost physical) the births of the two most important rivers in the basin are located. All of this shows that the Quindío River basin is contaminated by 50%, while the other part is in danger of contamination.
The Quindío River basin is the most worrying, because the main nodes are in it, and in addition, these nodes are artificial, as seen in Figure 4, and describe or realize human and industrial waste. The other watersheds also pose a danger of contamination, only to a lesser extent because the surrounding cities are sparsely populated and have little industrial presence. However, the region has experienced an increase in tourism which can eventually influence the health of the watershed.
PageRank. An important application in the measures of centrality is the measure of centrality of PageRank, which was developed by Larry Page and Sergey Brin, founders of Google (Page et al., 1998), which is currently the base of the algorithm used by the search engine of Google. In this algorithm, the nodes of the network are the websitesand the links are the hyperlinks between them. PagRank determines the importance of web pages and sorts them (or gives them a ranking) under two criteria: the number of web pages that affect the website and if the sites that link it also have a high PageRank.The following procedure is used to calculate the PageRank: initially a new matrix H must be built, whose entries are defined as follows:
Where k i out is the extent of the node’s output i. The vector of centrality PageRank ⟨π(k+1)| can be obtained through the k+1 iteration:
To solve the problem of the end node, a new matrix is built in terms of the matrix H:
Where the entries of the vector are gicen by:
And 1=|V|u where |V| is the number of elements in the node set and u it’s a vector of some. However, in order to ncorpórate the effect of teleportation between sites (abandonment from one page for another), a parameter 0 ≤ α ≤ 1 to get the following matrix:
Finally, the PageRank is obtained by the following vector:
The value of controls the random time proportion that a internet user follows the hyperlinks to move from page to page; this means, if if α=0.6, , 60% of the random time the surfer navigates on the same page or uses the hyperlinks to switch to another, which implies that 40% of the time the user migrates or changes to another page by entering a new URL in the browser (Langville & Meyer, 2011).
Under these two criteria, when applying this measure to the drainage network of the basins in the Department of Quindío, the PageRank determines which places in the drainage network are most important given their number of links (sub-basins) that point to it. If we take relatively low values to α, as seen in Figure 9 (a) and (b), it is found that the graph is very similar to that of the values of degree centrality (Fig. 6a), which imply that the points of the river are qualified according to the nearest neighbours. If you take high values of α as in the cases of Figure 9 (c) and (d), these show that the nodes that are at the end of the network over the river La Vieja are the ones that have the better PageRank, because these take into account the furthest sub-basins that flow over the river.

Figure 9 PageRank of the drainage network of the basins of the Department of Quindío using different values of . For the visualization of the PageRank Used The algorithms posed by Aksakalli (Aksakalli, 2017; Aksakalli, 2018).
According to the theory and the way in which this measure of centrality is interpreted, we can indicate that to implement the PageRank in drainage networks of watersheds, one must use a value of α very close to one, since the rivers do not have the possibility to change or move to another place in the basin.
Finally, Table 1 summarizes the values found when applying these measures in the hydrological network of the basins of the department of Quindio.
Table 1 Main properties of the hydrological network of the basins of the department of Quindío.
| Network properties | Value | Summary |
| Total number of nodes | 408 | Points on the hydrological network |
| Total number of edges | 409 | Represent the rivers and the direction of these |
| Artificial nodes | 23 | Nodes represent a monitoring point on a river in the basin |
| Births (natural nodes) | 194 | Nodes with zero input degree |
| Intersections (natural nodes) | 191 | Rivers confluence nodes |
| Degree of input | ||
| Zero degree nodes | 47.54% | Nodes that do not have edges that affect them, Like the sources of rivers. |
| Grade one nodes | 5.1% | Only receive an input edge nodes |
| Grade two nodes | 46.81% | Receive two input edges nodes |
| Grade three nodes | 0.24% | Receive three input edges nodes |
| Degree of Output | ||
| Zero degree nodes | 0.24% | Not have edges coming out of them nodes |
| Grade one nodes | 99.7549% | Nodes from which only one edge emerges. |
| Network density | 0.0049 | This value indicates that the network in Fig. 4 is poorly connected |
| The assortativity | 0.014 | The network does not have a correlation in the way the nodes are connected |
| Network eccentricity | ||
| Radius | 32 | The minimun eccentricity between the nodes is the radius of the network |
| Diameter | 64 | The maximum eccentricity between the nodes is the diameter of the network |
| The center of this network | Node 426 on the “La Maria” sector | in terms of the distance between nodes, the center is the set of nodes with eccentricity equal to radius. |
| The periphery of the network | List of nodes (0, 1, 214, 215) | The periphery of the network are these nodes that are farther away |
| PageRank | The rivers Quindio, Santo Domingo, Lejos, Rojo, Espejo and La Vieja. | The nodes located on these rivers have high PageRank values, which makes them the most significant nodes according to the way they are connected. |
DISCUSSION
The use of graph theory to represent the drainage network of a watershed allowed the obtaining of information that made it possible to improve the understanding of the structure of the network. The following results were obtained from the basins of the department of Quindío as shown in Table 1 and Figures 4, 5, 6, 8 and 9:
The distribution of grade for the network of Figure 4 is not very diverse, since this only has vertices of grade 0, 1, 2 and 3; basically the rivers of the basin are connected in a very natural way, typical of a mountain basin. The drainage network of the basins of the Department of Quindío does not present bifurcations, nor channels of interconnection between rivers or connections between parts of the same river, as it is appreciated in the work of Wu et al., (2013).
The values of density and assortativity indicate that the drainage network of the Department of Quindío is a network escarcely connected, i.e all rivers follow their natural cause, without artificial bifurcations, which makes this aspect a positive point for the well-being of the inhabitants of the basin, since the waters are not channeled. However, this same condition makes it very vulnerable to any environmental catastrophe, because before any unwanted shedding, these do not have the possibility of being evacuated by any channel, making any kind of plan recovery of the same very complex.
The eccentricity, the radius and the diameter of the network, allow to identify the center or the centers of the network. In this case, the network of Figure 4 has a single center that is an artificial node since it is a monitoring station for the Regional Autonomous Corporation of Quindío CRQ. This one is located on the River Quindío, in an industrial zone of high pollution in the sector of “La María” in the city of Armenia Quindío, which affects the basin downstream.
The centrality of PageRank that was obtained in the drainage network of the Department of Quindío shows the importance of the tributaries, in the particular case of the sub-basin of the river La Vieja, this one is the most important as seen in Figure 9 (a) and (b). This river collects all the waters of the five sub-basins of the department and deposits them in the Cauca River, but in its route it is used to supply the aqueducts of several cities of the north of the Department of Valle del Cauca, like Cartago (Emcartago (Empresas Municipales de Cartago ESP), 2017), which has a population of approximately 130,000 inhabitants (DANE (Departamento Administrativo Nacional de Estadística), 2018). What the PageRank shows us is that any type of pollutant that is poured over the old river, directly affects the population of the Department of Quindío and its neighbors from the north of Valle del Cauca.
On the other hand, by representing the hydrographic network through a graph, one can have a global panorama of the state of the drainage network. In addition, this structure allows analyzing the dynamics of a particular flow, for example, a contaminant, water quality parameters, populations, etc. In the same way, it allows to carry out a punctual study in a particular place of the basin, as is the case with the monitoring stations of the government entities responsible for protecting natural releathers.

