


 nova página do texto(beta)
 Inglês (pdf)
 Artigo em XML
 Referências do artigo
 Enviar este artigo por email
 Citado por SciELO
  Similares em
SciELO
Similares em
SciELO 
 Permalink
Introduction
Yellowtail Snapper (Ocyurus chrysurus (Bloch, 1791) is found in tropical and subtropical waters from the western Atlantic Ocean, from Massachusetts USA to Brazil, including Bermuda, Gulf of Mexico, Antilles, Bahamas, South Florida and the Caribbean (Allen, 1985). Larvae are pelagic with broad dispersion (Riley et al., 1995); juveniles are mainly associated to Turtle Grass Thalassia testudinium Banks ex König (Borton & Williams 1986), while adults form schools around coral reefs (Manooch & Drennon, 1987). Commercial and recreational fisheries developed around the coral reefs in South Florida (SEDAR, 2003; McClellan & Cummings, 1998). According to Allen (1985) and Heemstra and Randall (1993), in the southeast Gulf of Mexico, Yellowtail Snapper is caught together with fourteen species of grouper (Epinephelus sp.) and fourteen species of snapper (Lutjanus sp.). In particular, in Veracruz, Mexico, the artisanal fleet from Antón Lizardo catches Yellowtail Snapper all year around. The main fishing ground is located within the protected area “Parque Nacional Sistema Arrecifal Veracruzano” (PNSAV) (Fig. 1). The most common fishing gear used in the fishery is the hook; however, long line, troll, gillnet, harpoon, and creek are also used (Jiménez-Badillo et al., 2006). Similar to Florida, this is a multispecies fishery and Yellowtail Snapper landings represent 5% of the total catch from thirty-three species caught. Yellowtail Snapper catch ranks sixth in abundance in the zone (Jiménez-Badillo & Castro-Gaspar, 2008). This fishery is regulated through fishing permits issued by the Comisión Nacional de la Pesca (CONAPESCA), with scientific advice from the Instituto Nacional de la Pesca (INAPESCA). Recently, fishery managers recommended reducing fishing and increasing research in order to increase the available information aimed at establishing adequate reference points and improving regulations to manage this multispecies fishery (INAPESCA, 2012). In terms of research, there is a considerable amount of information on Yellowtail Snapper growth, which has been determined by studying hard structures such as otoliths, scales, etc. (Johnson, 1983; Manooch & Drennon, 1987; Carrillo de Albornoz & Ramiro, 1988; Carrillo de Albornoz, C. 1999. García et al., 2003; Leite Jr. et al., 2005; Gutiérrez-Benítez, 2012), by length distributions (Aguirre-García et al., 2004; Mattos & Maynou, 2009), and by a mix of these two methods (Mexicano-Cíntora, 1999; Dennis, 1991). A review of the literature suggests that most researchers assume that the von Bertalanffy equation describes growth by defaut, and they rarely provide estimation of growth-parameter uncertainty (Torres & Chavez, 1987;) We note that an adequate estimation of growth parameters provides important information for the analysis of how fisheries are affecting species (Ehrhardt, 1981), and for establishing fishery regulations and reference points to assure the sustainable exploitation of marine resources. In this paper, we explore model uncertainty for Yellowtail Snapper growth by comparing and fitting three growth models (von Bertalanffy, Logistic, and Gompertz) to length-at-age data using a maximum likelihood estimation (MLE) approach. We also estimate growth parameters and their uncertainty by MLE (using three assumptions on error variance) and Bayesian approaches. We believe this methodology provides both a robust analysis for assessing the growth of Yellowtail Snapper and complementary information for the management of this resource.
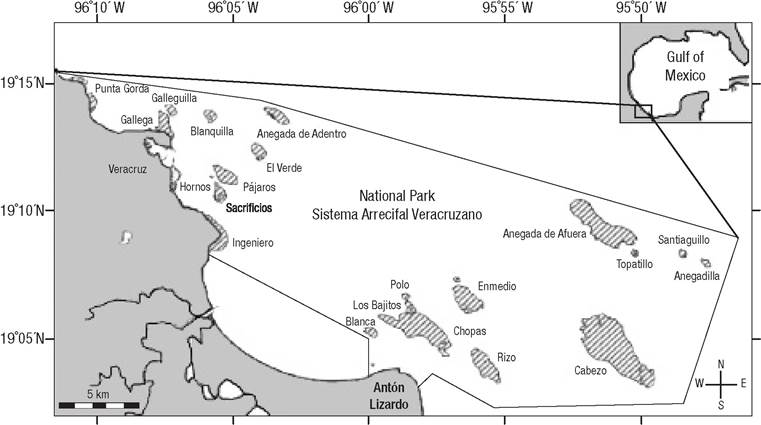
Figure 1 Antón Lizardo area (shaded areas represent reef structures); modified from Okolodkov (2008).
Material and methods
Length-at-age data determination for Yellowtail Snapper in Veracruz is described in detail in Gutiérrez-Benítez (2012). A total of 188 individuals were collected at the Antón Lizardo landing site. Average length-at-age, sample size by age class (Table 1), and raw data (Figure 2a) are shown below. In this article, we fit length-at-age data to three growth models, the first was the von Bertalanffy model (von Bertalanffy, 1938):
Table 1 Average length-at-age and sample size for each age class of organisms of Yellowtail Snapper Ocyurus chrysurus (Bloch 1791), collected at the Antón Lizardo landing site, Veracruz, Mexico.
| Age | Length | Sample size |
|---|---|---|
| 1 | 15.31 | 7 |
| 2 | 25.8 | 6 |
| 3 | 27.16 | 51 |
| 4 | 38.26 | 76 |
| 5 | 45.92 | 37 |
| 6 | 52.23 | 8 |
| 7 | 54.93 | 3 |
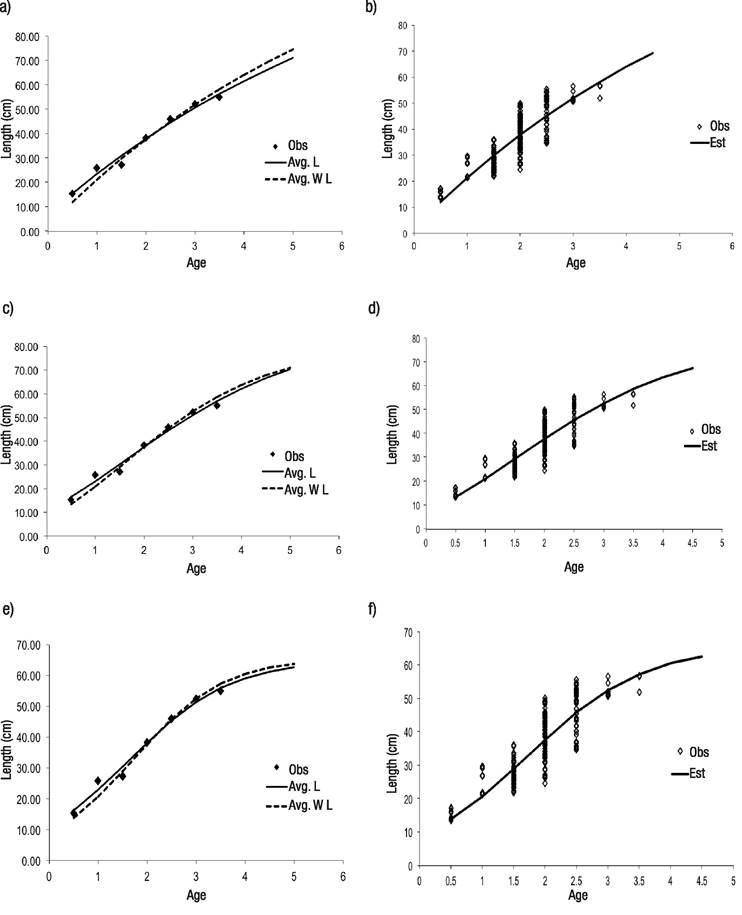
Figures 2a-f Maximum likelihood estimation (MLE) model fits to observed length-at-age data for Yellowtail Snapper Ocyurus chrysurus (Bloch, 1791). a-b) Von Bertalanffy; c-d) Gompertz; e-f) Logistic; Obs = observed length-at-age data, Avg. L = equation 5 for variance assumption, Avg. W L = equation 6 the variance option.
where L∞ is the asymptotic length, K is the growth rate, t0 is the age for length equals zero, and εi is an independent normal randomly distributed error (N(0,σ2)). We also used the logistic model (Ricker, 1975) given by the following equation:
where I is the age corresponding to the inflection point in the growth curve. The third model was the Gompertz model (Gompertz, 1825) defined by:
We estimated model parameters from equations (1- 3) and their uncertainties using the maximum likelihood estimation method (Kimura, 1980); in particular, we used the negative logarithm of the likelihood as the objective function, assuming a normally distributed observation error. According to Kimura (1980), under different assumptions on error variance, four different methods of estimation are appropriate. When these assumptions are met, each method provides maximum likelihood estimations under the likelihood model. In the first option, all individual measurements have constant variance:
where N is the number of age classes, n is the total number of data, i is the age class, ni is the sample size of age class i, j represents an individual’s length in age class i, l represents length-at-age, and σ is the standard error. The second option assumes all average length-at-age values have a constant error variance:
The third option is a variation of the first option (Equation 4), where it is assumed that all average length-at-age values have a constant variance and sample size ni is used as a weighting factor:
There is a fourth option assuming the length-at-age error variance varies with age, but we did not observe this pattern in our data, so we excluded it. In summary, we explored nine options (three models and three assumptions on error variance) for growth parameter estimation. Parameter estimation and uncertainty were carried out using the subroutine “optim” from the statistical package R (R Core Team, 2015).
Model selection for the best fit to observed data was conducted using the Akaike information criterion (1973):
where Lmax is maximum likelihood and P is the number of parameters included in the model.
After selecting the best model, a Bayesian estimation (Hilborn & Mangel, 1997) for the parameters from the logistic growth equation was carried out; this approach allows the incorporation of additional information obtained from previous work into the building of the parameters’ prior distributions used in the estimation of their posterior distributions. In this statistical approach, the probability of the hypothesis given the data or posterior distribution Pr{Hi│data} was estimated as:
where L represents the likelihood of the data -given the hypothesis (parameter value) -and Prior is the prior distribution of each hypothesis that assumes previous knowledge. We should point out that prior distributions were built based on estimates taken from the literature (Table 2) on Yellowtail Snapper growth. In particular, most of the time, analyses of Yellowtail Snapper growth took the von Bertalanffy model as the default model. Therefore, there was no information on the K and I parameters used in the logistic model, so we could only build a prior distribution for the asymptotic length that was assumed to be normally distributed with mean μ= 52.86 cm and σ = 9.17 cm. Due to the lack of prior information, the remaining parameters from the logistic model were assumed to have a uniform distribution.
Table 2 Estimates of asymptotic length for Yellowtail Snapper (Ocyurus chrysurus Bloch, 1791) from previous studies in different regions; L∞ = asymptotic length, Uncertainty = uncertainty estimated.
| Author | Region | L∞(cm) |
|---|---|---|
| Cantarell (1982) | Yucatan | 53.0 |
| Johnson (1983) | Florida | 45.0 |
| López & Garduño (1985) | Yucatan | 55.5 |
| Mexicano-Cíntora (1986) | Yucatan | 48.1 |
| Manooch & Drennon (1987) | Vírgen Islands and Puerto Rico | 50.3 |
| Carrillo de Albornoz & Ramiro (1988) | SE Cuba | 69.6 |
| Dennis (1991) | Puerto Rico | 53.4 |
| Carrillo de Albornoz (1999) | SO Cuba’s Shelf | 62.0 |
| Mexicano-Cíntora (1999) | Yucatan’s north coast (1985) | 50.7 |
| 44.9 | ||
| 49.5 | ||
| Yucatan’s north coast (1986) | 44.0 | |
| 43.0 | ||
| 42.1 | ||
| Yucatan’s north coast (1987) | 51.1 | |
| 47.5 | ||
| 48.7 | ||
| Araujo et al. (2002) | Brasil’s central coast | 56.7 |
| García et al. (2003) | Florida | 60.7 |
| Aguirre-García et al. (2004) | Quintana Roo | 50.0 |
| Allman et al. (2005) | Florida | 41.0 |
| Leite Jr. et al. (2005) | Brasil’s east coast | 56.7 |
| Mattos & Maynou (2009) | NE Brasil | 76.6 |
| Gutiérrez-Benítez (2012) | Veracruz | 68.6 |
| Average Linf | 52.86 ± 9.17 |
The posterior distribution of the following parameters was estimated: asymptotic length L∞, growth rate (K), and age corresponding to the inflection point of the growth curve (I). Posterior distributions for the parameters were estimated with Markov Chains Monte Carlo (MCMC). A total of 1,600,000 simulations were made using Excel-Visual Basic, with a burning period of 5000 parameter vectors. We saved the parameters vector every 25 simulations. The recorded information included the posterior probability value (Equation 8), the asymptotic length, the growth rate, and the age for the inflection point. We classified results within the Visual Basic code in thirty bins and built the marginal posterior distributions using the pivot table function in Excel.
Results
Model fitting results are shown below (Table 3, Fig. 2). As mentioned, we fit three models (Equations 1-3) with three options for variance error (Equations 4-6) for a total of nine scenarios. All models fit the observed data well; however, within each error variance assumption, the logistic model had the lowest Akaike information criterion. In contrast, the von Bertalanffy model consistently had the worst performance (Table 3). The overall lowest AIC (31.41) corresponded to the logistic model using the average length with constant error variance (Equation 5). Therefore, this scenario (Equations 2, 5) was selected as the best fit for the Yellowtail Snapper observed length-at-age. For this scenario, four parameters and their uncertainties were estimated, the asymptotic length (L∞ ) was estimated as 64.9 ± 5.43 cm, the growth rate was 0.49 ± 0.07, and the age associated to the curve inflection point (I) was 3.28 ± 0.42 years. Their corresponding 95% confidence intervals were (54.24, 75.54), (0.35, 0.63), and (2.45, 4.1), respectively. The standard error was 1.77 ± 0.47. The highest coefficient of variation corresponded to σ (0.27), for a growth rate of 0.14, for an age associated to the inflexion point of 0.13, and for an asymptotic length of 0.08.
Table 3 Estimated parameters for Yellowtail Snapper Ocyurus chrysurus (Bloch, 1791) and their uncertainty (standard error) for the von Bertalanffy, Logistic and Gompertz models (three error variance assumptions were used: a = equation 4, b = equation 5, c = equation 6); L∞ = asymptotic length; K = intrinsic rate of growth; t0/I = time where individual length is cero or the age corresponding to the inflection point in the growth curve (logistic model); σ = standard error.
| Model | Variance option | L∞ | K | t0 /I | σ | Akaike |
|---|---|---|---|---|---|---|
| Von Bertalanffy | a | 166.02 ± 60.67 | 0.06 ± 0.03 | -0.28 ± 0.26 | 5.72 ± 0.29 | 1198.75 |
| b | 135.63 ± 77.93 | 0.07 ± 0.05 | -0.75 ± 0.49 | 1.95 ± 0.52 | 80.42 | |
| c | 154.77 ± 84.48 | 0.07 ± 0.05 | -0.25 ± 0.42 | 9.41 ± 2.55 | 96.29 | |
| Logistic | a | 66.1 ± 5.85 | 0.54 ± 0.07 | 3.48 ± 0.35 | 5.62 ± 0.29 | 1190.34 |
| b | 64.9 ± 5.43 | 0.49 ± 0.07 | 3.28 ± 0.42 | 1.77 ± 0.47 | 31.41 | |
| c | 65.55 ± 7.2 | 0.54 ± 0.09 | 3.45 ± 0.43 | 7.25 ± 1.94 | 33.63 | |
| Gompertz | a | 68.77 ± 5.81 | 0.38 ± 0.05 | 0.01 ± 0.54 | 5.7 ± 0.29 | 1193.32 |
| b | 84.71 ± 25.76 | 0.24 ± 0.09 | -3.04 ± 2.78 | 1.91 ± 0.57 | 36.0 | |
| c | 82.17 ± 17.88 | 0.28 ± 0.08 | -1.40 ± 1.57 | 8.11 ± 2,17 | 34.31 |
We should point out that for the logistic model, confidence intervals overlap for the L∞ estimates obtained from the three options of error variance assumption (Fig. 3); therefore, at the 95% confidence level, we did not find significant evidence that the estimates are different. Similar results were obtained for the growth rate (K) and the age at the point of inflection (I); however, for the sigma parameter, some confidence intervals did not overlap. The correlation coefficient between the observed and the estimated length at age was 0.99 (p-value ~ 0).
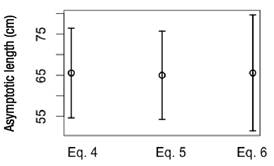
Figure 3 Confidence intervals of the asymptotic length for the logistic model for different error variance assumptions (Eqs. 4-6)
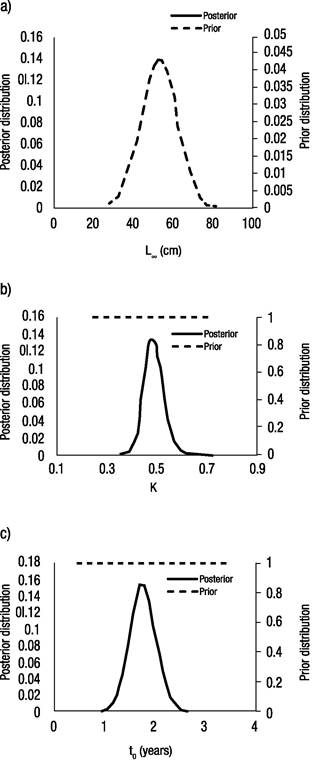
Regarding the Bayesian analysis, results from the MCMC simulations suggest that the logistic model fits the observed data well (Fig. 4a). The most probable value for the asymptotic length was 64.3 cm (mode of the marginal posterior distribution), with a 95% probability interval of (58.7, 70.1). The most probable growth rate was 0.48 with a 95% probability interval of (0.42, 0.55); the most probable value for the age of the inflection point was 1.4 years with a 95% probability interval of (1.31, 2.16). The parameter’s marginal posterior distributions are shown below (Fig. 5). Regarding the parameter correlations (Figs 4b-d), these were high: The correlation between L∞ and K was -0.74, the correlation between K and I was -0.79, and for L∞ and I, the correlation was 0.87
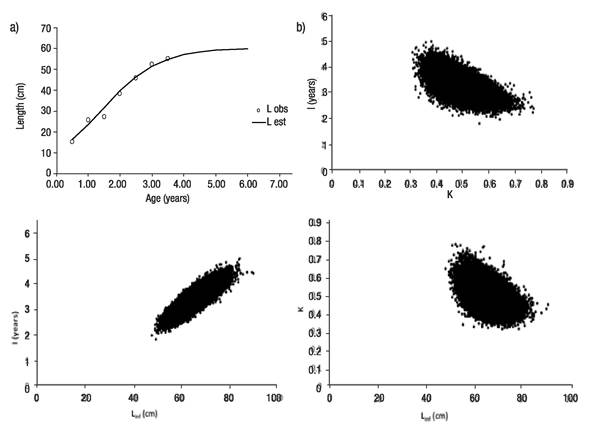
Figures 4a-d a) Logistic growth model Markov Chain Monte Carlo (MCMC) fitting to observed length data for Yellowtail Snapper (Ocyurus chrysurus Bloch, 1791) in Veracruz; b) Dispersion graph of estimates of K vs l; c) Dispersion graph of estimates of L∞ vs l; d) Dispersion graph of estimates of L∞ vs K.
Discussion
In order to achieve sustainable exploitation of the multispecies fisheries in the Gulf of Mexico, the Carta Nacional Pesquera (National Fishing Chart) (SAGARPA, 2012) suggests that more information on biological and population aspects is needed to accurately determine the exploitable biomass and optimum effort that must be applied in each of the fisheries under criteria of sustainability. In particular, the economy of the Antón Lizardo Community is mostly based on the multi-specific fishery, where Yellowtail Snapper is caught. Therefore, it is important to ensure its sustainable exploitation; more effort is needed to improve the management of this fishery resource. Nearby towns adapted their economy and cultural traits due to the loss of mangrove forest and over-exploitation of fishing resources (Aldeco et al., 2015).
A first step towards a sustainable exploitation is to provide important basic information such as species growth. Although several studies have been published on Yellowtail Snapper growth using different methods (Dennis, 1991; Mexicano-Cíntora 1999; Allman et al., 2005; Araújo et al., 2002), they rarely provide a measure of parameter uncertainty. Note that the value of a model-based analysis lies not simply in its ability to generate a precise point estimate for a specific outcome, but also in the systematic examination and responsible reporting of uncertainty surrounding this outcome (Briggs et al., 2012). Similarly, consideration of uncertainty is essential when management decisions are made, and it is particularly important when applying the precautionary approach to fisheries management (Maunder et al., 2006). Previous studies (Dennis, 1991; Mexicano-Cíntora, 1999; Allman et al., 2005; Araújo et al., 2002; Torres & Chávez, 1987) assumed by default that the von Bertalanffy model describes Yellowtail Snapper growth adequately; model uncertainty is rarely taken in account; therefore they could be making a modeling error (Punt & Hilborn, 2001) neglecting the understanding of the dynamic studied. In this paper, we try to improve the methodology used previously by providing two methods: maximum likelihood estimates and Bayesian methods for parameter and uncertainty estimation. We also addressed model uncertainty using three models, three assumptions on error variance, and the Akaike information criterion for model selection.
Our results suggest that the logistic model (Ricker, 1975) shows the best fit for the observed length-at-age data. We should point out that the von Bertalanffy model had the worst performance when fitting the observed length-at-age data, surpassed even by the Gompertz model (Gompertz, 1825), so it is important to test several models and apply the AIC when exploring the growth of any species. The Akaike criterion (1973) suggests that von Bertalanffy model was not ideal for describing the growth dynamics of the Yellowtail Snapper in the PNSAV. We recommended using these methodologies for other Yellowtail Snapper distribution areas. We did not include the general Schnute growth model in this analysis because preliminary results suggest that, depending on the initial values for parameters used in the optimization, their estimates converged on all of the three models used.
Not only did the AIC suggest that the von Bertalanffy model does not perform adequately, in particular, asymptotic length estimates from the von Bertalanffy model (Table 3) are high. Based on our experience and conversations with fishermen, there have never been organisms registered of this magnitude. This overestimation may be due to a lack of data from older ages.
The overlap of parameter confidence intervals suggests that all variance error assumptions used in the estimation process produced the same parameter estimates for the logistic model; therefore, it is sufficient to assume that the mean length at age has constant error variance (Equation 5).
Bayesian methods are ideal for including prior knowledge in the estimation of the model parameters, taking advantage of available information. Unfortunately, the lack of studies that integrate model selection methods did not allow building a prior distribution for parameters I and K; parameters not included in the von Bertalanffy model taken by default in previous studies. We only built a prior distribution for the asymptotic length. The posterior distributions suggest that it does not depend exclusively on the prior distribution; this means that the collected data have enough information to perform the estimation of the asymptotic length parameter. For the asymptotic length, the estimated L∞ (64.3 cm) obtained with Bayesian analysis is smaller than the one obtained with the maximum likelihood estimation (64.9 cm). This might be due to the influence that the prior distribution (μ = 52.86 cm, σ = 9.17 cm) has in the estimation process.
Regarding the strong correlation between parameters, there is much statistical confusion among the three parameters of the logistic model, L∞, I, and K. Their estimates were based on data from a single season, so there is probably not much contrast in the data. Future sampling will increase the amount of data available for the estimation, would allow better estimates for parameters and uncertainties, and will probably ratify the logistic model as the best for describing Yellowtail-Snapper growth dynamics.
In this study, we present some statistical techniques that should be considered basic because they provide a robust analysis in assessing the growth of species of commercial interest and are an appropriate solution for estimating the parameters and uncertainty of individual growth. The Bayesian framework presents an opportunity to incorporate historical species information in the management of fishing resources to ensure their sustainable exploitation.

