


 nueva página del texto (beta)
 Inglés (pdf)
 Artículo en XML
 Referencias del artículo
 Enviar artículo por email
 Citado por SciELO
  Similares en
SciELO
Similares en
SciELO 
 Permalink
Introduction
Aquatic resources are natural environments in which various groups of organisms (including bacteria) can inhabit and develop. All aquatic ecosystems differ from each other in biological components, physical and chemical features, and quantitative or qualitative patterns. One of the biological components of aquatic environments is bacterial communities that are affected by environmental conditions from autochthonous and allochthonous origins. Bacterial populations play very important roles in some major tasks in aquatic ecosystems, i.e. they decompose organic material to support food webs and add nutrients to the water (Logue et al., 2016). Inland waters may be contaminated by human activities, sewage discharges or overflows (Doreen et al., 2015). Bacterial contamination may cause potential human health risks and adverse effects to ecosystems (Ehrhardt et al., 2017).
The composition of bacterial communities can be influenced by many factors including temperature, rainfall patterns, dissolved oxygen, pH, turbidity, salinity, ions or heavy metal concentrations, toxic materials, and other environmental features in the basin. The water itself affects the distribution of bacterial populations within it through its physicochemical features and the environments from anthropogenic or geologic resources. Although some environments have specific vital requirements for bacteria, others can limit their existence. All types of surface waters, from freshwaters to salt waters, include bacterial communities in every zone of water bodies from the surface layer to the bottom deposits (Malecka & Donderski, 2006). Bacteria from different sources enter the aquatic environments such as in soil, air or the digestive tract of organisms. The bacteria group has autotrophic, heterotrophic, and parasitic live forms that also exist in aquatic environments. Their distribution is affected by environmental conditions. Wastewaters from settlements and natural fertilizers from agricultural areas can lead to microbiological pollution in aquatic ecosystems. In addition to know about pathogenic microorganisms, it is important to recognize microorganisms that indicate contamination in water bodies, and E. coli is the main indicator of water contamination by wastewater (Kenar & Altındis, 2001).
In this study, the sampled lagoon-lakes are located along the coast of the Aegean Sea in Saros Bay. The area was declared a wetland conservation zone of Meric-Ergene River Basin. The sampled freshwater lakes in this study are used as sources of tap and irrigation water of local settlements. It is reported that despite the ecological and socio-cultural importance of the region, transformation of ecological quality is becoming more noticeable (Tok et al., 2016).
In this paper, the seasonal variability of autochthonous and allochthonous bacterial communities (total heterotrophic bacteria, coliform bacteria, fecal coliform bacteria and Escherichia coli bacteria) and physicochemical conditions of two different aquatic environments (two lagoon-lakes and two freshwater lakes) in the Turkish Thrace region were examined. In addition, the effects of environmental features on their distribution were evaluated statistically.
Materials and methods
Study area and sampling. The Turkish Thrace is located in Turkey’s northwest and is known as European Turkey. The region is covered by settlements and agricultural areas where paddy, mustard, and other crops are cultivated. While the sampled lagoon-lakes that are semi-connected with sea water are located in the southwest part of the Sub Thrace Region and situated along the coast line of the Aegean Sea, the sampled freshwater lakes are located near the lagoon-lakes area and provide tap and irrigation water.
Water samples were taken between October 2014 and August 2015 from eight sites (Figure 1). Stations 1 (40° 35’ 51.6” N, 26° 15’ 19.9” E) and 2 (40° 36’ 28.2” N, 26° 15’ 56.7” E) were chosen in Tuzla lagoon-lake, which is a very shallow coastal lagoon, separated by a small littoral bar with Saros Bay. This lagoon-lake has brackish to salt water features, with a mean depth of less than one meter, and is about 2.2 km in length and 1.2 km in width. Stations 3 (40° 43’ 27.3” N, 26° 04’ 24.4” E) and 4 (40° 42’ 48.8” N, 26° 05’ 05.0” E) were chosen in a closed lagoon, i.e., Dalyan lagoon-lake, which has livestock farming wastes surrounding it. The Dalyan lagoon-lake, no deeper than 1.7 meters, also has brackish to salt water features. This lake has a surface area of 250 ha. Stations 5 (40°57’20.5”N, 27°00’32.7”E) and 6 (40°56’47.6”N, 26°59’40.8”E) were chosen in Karaidemir freshwater lake, which has many surrounding rural settlements and, thus, their sewage might be able to enter this system. This lake is used for irrigation and fisheries. The maximum lake capacity is 120.30 hm3 and lake area is 15.50 km2. Stations 7 (40° 47’ 37.4” N, 26° 46’ 20.5” E) and 8 (40° 48’ 53.4” N, 26° 47’ 58.5” E) were chosen in the Kadikoy freshwater lake reservoir, which is used for irrigation and tap water in the region. The maximum lake capacity is 65.68 hm3 and its area is 6.20 km2.
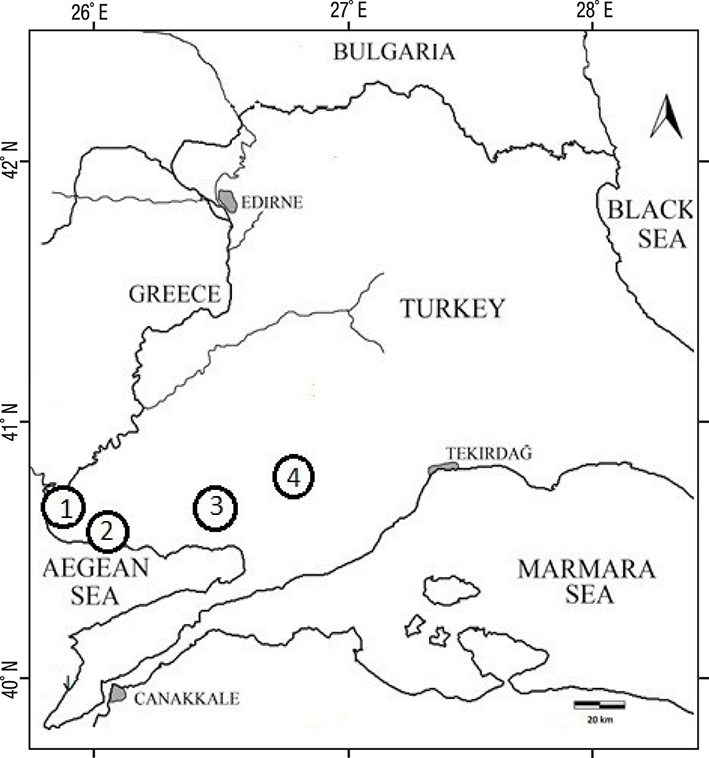
Figure 1 Locations of sampled water resources in Turkish Thrace. 1) Dalyan lagoon-lake. 2) Tuzla lagoon-lake. 3) Kadikoy freshwater lake. 4) Karaidemir freshwater lake.
Bacteriological surveys. We collected water samples from the sampling stations at a depth of about 20 cm, placed them into sterile bottles with a capacity of 100 mL, and immediately transported them to the laboratory in a container with ice; the temperature was about +5 °C.
While the number of total heterotrophic bacteria was determined by the spread-plates method using plate-count agar, the others (total coliform and fecal coliform bacteria, E. coli) were determined using the method of Most Probable Number (MPN) (APHA, 1998). All inoculations were conducted in three parallel repetitions. Inoculums from the tubes showing fermentation were streaked on EMB agar. Isolated colonies of E.coli from EMB agar (round colonies with green metallic sheen) were confirmed by biochemical tests with IMVIC, where ‘‘I’’ is indole production from Tryptone broth, ‘‘M’’ and ‘‘V’’ are methyl red and the Voges Proskauer test from MR-VP broth and ‘‘C’’ is the citrate test from Simmon’s Citrate agar (APHA, 1998). Isolates showing +, +, −, − reaction for IMVIC test were confirmed as E. coli, respectively (June et al., 2016). The culture media (for presumptive, confirmed, and completed tests), and incubation conditions were given in Table 1.
Table 1 Culture media and incubation conditions used for counting bacteria (APHA, 1998) obtained at lakes in Turkey.
| Bacteria | Method | Culture Media | Temperature (°C) | Time (hours) |
|---|---|---|---|---|
| Total Heterotrophic | Spread Plate | Plate Count Agar | 35 ± 0.5 | 48 |
| Total Coliform | Most Probable Number (MPN) | LST Broth | 35 ± 0.5 | 24 ± 2 |
| BGLBB Broth | 35 ± 0.5 | 24 ± 2 | ||
| Fecal Coliform | Most Probable Number (MPN) | LST Broth | 35 ± 0.5 | 24 ± 2 |
| BGLBB Broth | 35 ± 0.5 | 24 ± 2 | ||
| EC Broth | 44.5 ± 0.2 | 24 ± 2 | ||
| Most Probable Number (MPN) | LST Broth | 35 ± 0.5 | 24 ± 2 | |
| BGLBB Broth | 35 ± 0.5 | 24 ± 2 | ||
| EC Broth | 44.5 ± 0.2 | 24 ± 2 | ||
| EC Broth with MUG | 44.5 ± 0.2 | 24 ± 2 | ||
| E. coli | Confirmed and Completed Test | EMB Agar | 35 ± 0.5 | 18 - 24 |
| Tryptone Broth | 35 ± 0.5 | 24 ± 2 | ||
| MR-VP Broth | 35 ± 0.5 | 24 - 48 | ||
| Simmon’s Citrate Agar | 35 ± 0.5 | 24 - 48 |
Physicochemical surveys. In the field studies, while air and water temperatures, dissolved oxygen, pH, conductivity, salinity, and total dissolved solids were measured using the Consort model C 5010 multi-parameter device, the turbidity of the water at each station was measured by Secchi disk. Rainfall was also recorded during field studies.
The water samples held by the Nansen water sampler were transported to the laboratory in dark glass bottles with a capacity of 2 liters to evaluate the other parameters, while the nitrite nitrogen, nitrate nitrogen, phosphate, and sulphate were analyzed by the Metrohm Ion Chromatography System 881 Compact IC Pro, equipped with a Metrohm 896 Professional Detector-Conductivity & Amperomerty, and an automatic injector. This analytical technique was based on the USEPA method 300.1
(Hautman & Munch, 1997). The trace elements like sodium magnesium, aluminum, calcium, chromium, manganese, iron, cobalt, nickel, copper, zinc, arsenic, selenium, strontium, silver, cadmium, and lead, were analyzed by Agilent Technologies 7700 XX ICP-MS System in the TUTAGEM (Trakya University, Technology Research and Development Centre) laboratories. ICP-MS measurements and metal analysis were performed using the USEPA method 200.8 (Creed et al., 1994).
Statistical analysis. The relationships between the bacterial distributions and environmental features were explored by Spearman’s Correlation Index (SPSS for Windows). In addition, reference was made to the Bray-Curtis Cluster Analyses to determine similarity rations among the sampling sites. The results were statistically supported by Correspondence Analysis and Abundance Plot Analysis.
Results and discussion
Data concerning the total number of heterotrophic bacteria (THB) occurring in the water of the sampled lakes is presented in Figure 2. In this study, the greatest number of THB was found at the Kadikoy freshwater lake (4.2 x 10⁶ CFU 100 mL-1). The lowest average number of THB was found at Dalyan lagoon-lake (4.0 x 101 CFU 100 mL-1). The greatest total number of THB was found in during the spring at sampled freshwater lakes; the lowest occurred during the summer at lagoon-lakes (Figure 2). An average distribution of the number of THB was found at the Kadikoy freshwater lake > Karaidemir freshwater lake > Tuzla lagoon-lake > Dalyan lagoon-lake, respectively (Figure 3). As we can see, freshwater lakes have higher bacterial counts than lagoon-lakes. In addition, the results of the Bray-Curtis similarity index and Correspondence analysis supported these findings (Figures 4-5).
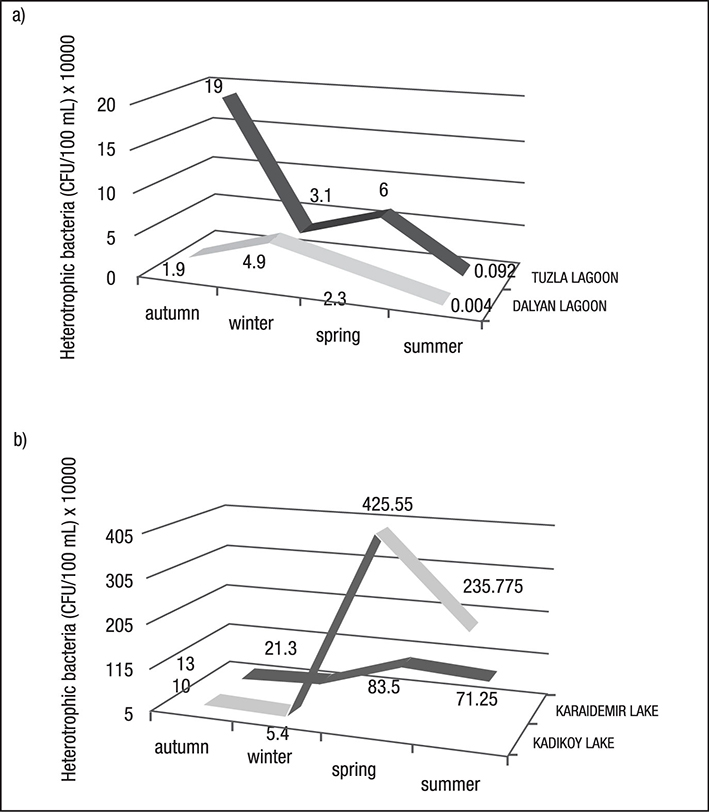
Figures 2a-b Distribution of heterotrophic bacteria in the sampled lakes in Turkey. a) Lagoon-lakes; b) Freshwater lakes.
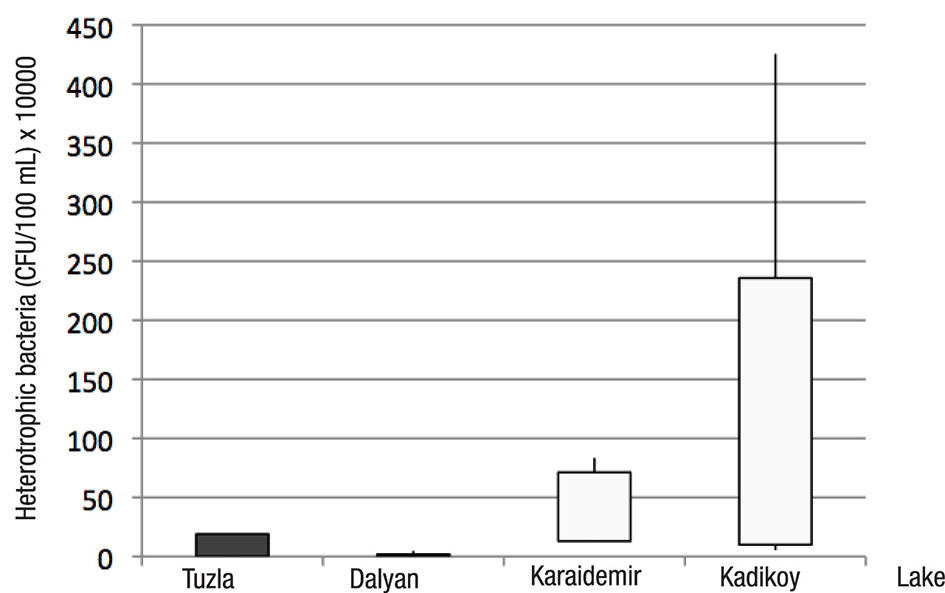
Figure 3 Average distribution of heterotrophic bacteria (CFU 100 mL-1) in the sampled lakes of Turkey at different seasons.
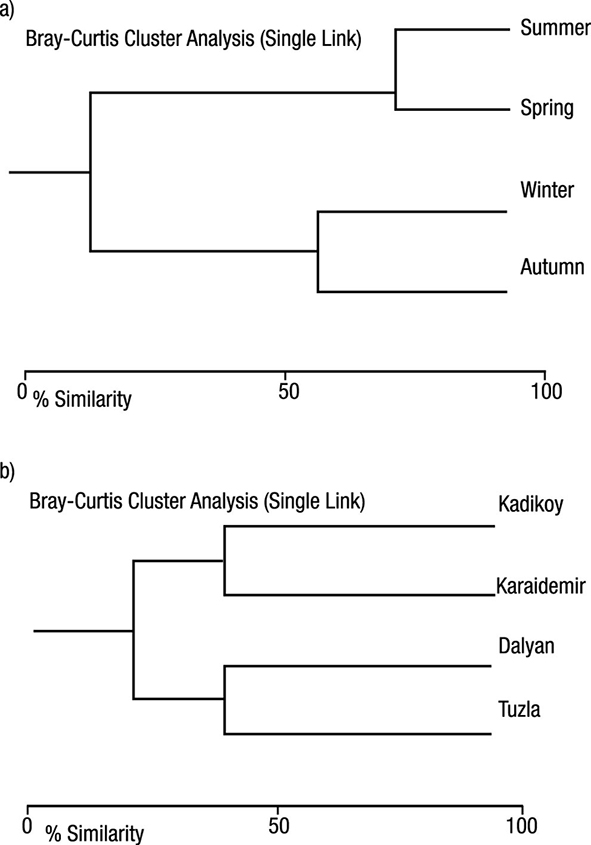
Figures 4a-b Bray Curtis similarity dendrograms by seasons and the sampled lakes of Turkey, based on bacteria. a) Seasons. b) Lakes.
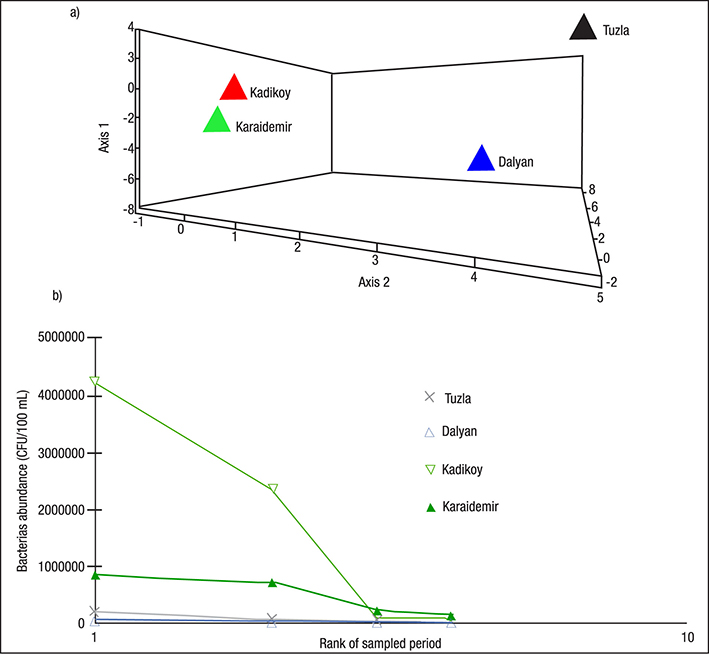
Figures 5a-b a) Correspondence analysis, and b) Abundance Plot diagrams of bacteria numbers in the sampled lakes in Turkey.
Existence of total coliform (TCB), fecal coliform (FCB), and E. coli was observed in all sampled water resources and during all sampling periods (Table 2).
Table 2 Total coliform (TCB), fecal coliform (FCB), and E.coli bacteria counts (MPN 100 mL-1) at lakes in Turkey sampled during different seasons.
| Dalyan lagoon-lake | Tuzla lagoon-lake | Kadikoy freshwater lake | Karaidemir freshwater lake | ||
|---|---|---|---|---|---|
| Autumn | TCB | 2 | < 2 | 900 | 70 |
| FCB | 2 | < 2 | 34 | 30 | |
| E. coli | 2 | < 2 | 33 | 23 | |
| Winter | TCB | 2 | < 2 | 16 | 190 |
| FCB | < 2 | < 2 | 16 | 28 | |
| E. coli | < 2 | < 2 | 7 | 28 | |
| Spring | TCB | 4 | < 2 | 815 | 151 |
| FCB | 2 | < 2 | 182 | 151 | |
| E. coli | 2 | < 2 | 146 | 141 | |
| Summer | TCB | < 20 | < 20 | 21 | 960 |
| FCB | < 20 | < 20 | 17 | 610 | |
| E. coli | < 20 | < 20 | 12 | 205 | |
The values of the physical and chemical parameters of the sampled lakes including air and water temperatures, dissolved oxygen, pH, conductivity, salinity, total dissolved solids, turbidity, nitrite nitrogen, nitrate nitrogen, phosphate, sulphate, sodium, magnesium, aluminium, calcium, chromium, manganese, iron, cobalt, nickel, copper, zinc, arsenic, selenium, strontium, silver, cadmium, and lead levels appear in Table 3. Basically, among these parameters, water temperature showed obvious seasonal change: The water temperature ranged from 7.9 °C to 28 °C during the sampling period. The water of sampled lakes was slightly alkaline with pH values that varied between 7.74 and 9.08; DO was recorded between 5.120 and 12.920 mg L-1, a congenial environment for biota. The conductivity records varied from 0.37 (Kadikoy freshwater lake, autumn) to 45.40 mS cm-1 (Dalyan lagoon-lake, summer). Salinity had a maximum of 0.3‰ in the freshwater lakes and 28.7‰ in the lagoon-lakes (Table 3). The climate was characterized by heavy rainfall during autumn and spring.
Table 3 Mean values of physical and chemical variables in the sampled lakes in Turkey.
| Dalyan Lagoon-Lake | Tuzla Lagoon-Lake | ||||||||
|---|---|---|---|---|---|---|---|---|---|
| Autumn | Winter | Spring | Summer | Autumn | Winter | Spring | Summer | ||
| A.T. (°C) | 14.0 | 11.0 | 18.5 | 30.0 | 16.0 | 13.0 | 18.0 | 30.0 | |
| W.T. (°C) | 15.2 | 9.1 | 21.4 | 26.0 | 15.9 | 10.0 | 23.5 | 28.0 | |
| D.O. (mg L-1) | 8.27 | 10.68 | 9.26 | 5.12 | 8.24 | 11.20 | 8.31 | 5.72 | |
| pH | 8.95 | 8.18 | 8.61 | 7.74 | 8.42 | 9.08 | 8.41 | 8.06 | |
| EC (mS cm-1) | 0.78 | 0.95 | 13.79 | 45.40 | 6.47 | 14.50 | 42.50 | 45.00 | |
| Salinity (‰) | 7.5 | 7.2 | 6.9 | 28.7 | 10.0 | 10.3 | 10.9 | 28.4 | |
| TDS (g L-1) | 1.64 | 0.16 | 2.08 | 26.40 | 1.89 | 0.16 | 2.05 | 25.80 | |
| Turbidity (cm) | 110.0 | 76.0 | 60.0 | 75.0 | 90.0 | 100.0 | 65.0 | 40.0 | |
| N-NO2- (mg L-1) | 0.16 | 0.07 | 0.12 | 0.06 | 0.001 | 0.001 | 0.001 | 0.00 | |
| N-NO3- (mg L-1) | 0.62 | 3.98 | 12.93 | 4.67 | 6.06 | 6.53 | 6.78 | 2.17 | |
| Phosphate (mg L-1) | 8.16 | 0.005 | 11.19 | 0.10 | 0.09 | 0.72 | 0.09 | 0.30 | |
| Sulphate (mg L-1) | 0.05 | 79.49 | 117.21 | 4039.69 | 0.06 | 0.03 | 2.14 | 2870.66 | |
| Sodium (mg L-1) | 20630.68 | 0.67 | 245.17 | 167613.92 | 38.66 | 3.33 | 923.22 | 164956.12 | |
| Magnesium (mg L-1) | 10.37 | 0.22 | 32.76 | 11636.98 | 37.36 | 0.49 | 119.83 | 12674.93 | |
| Aluminum (mg L-1) | 0.20 | 0.78 | 0.89 | 1.63 | 0.39 | 0.73 | 1.63 | 4.99 | |
| Calcium (mg L-1) | 0.03 | 0.47 | 8.70 | 680.22 | 5.74 | 0.42 | 11.20 | 678.96 | |
| Chromium (μg L-1) | 12.18 | 9.66 | 18.28 | 6174.98 | 15.33 | 9.61 | 22.88 | 6053.18 | |
| Manganese (μg L-1) | 21.78 | 12.37 | 31.50 | 2179.86 | 29.20 | 12.29 | 30.38 | 942.42 | |
| Iron (mg L-1) | 0.95 | 0.35 | 1.29 | 29.33 | 1.02 | 0.36 | 1.45 | 34.71 | |
| Cobalt (μg L-1) | 0.99 | 4.65 | 10.46 | 87.92 | 1.96 | 4.65 | 10.11 | 98.86 | |
| Nickel (μg L-1) | 46.02 | 11.07 | 16.86 | 219.47 | 70.39 | 11.08 | 31.17 | 251.56 | |
| Copper (μg L-1) | 54.47 | 33.08 | 32.90 | 118.81 | 33.11 | 33.27 | 75.82 | 122.73 | |
| Zinc (μg L-1) | 109.80 | 197.29 | 66.36 | 399.30 | 108.27 | 204.89 | 80.51 | 403.55 | |
| Arsenic (μg L-1) | 3.85 | 3.71 | 4.62 | 291.19 | 3.37 | 3.81 | 4.10 | 247.58 | |
| Selenium (μg L-1) | 0.03 | 0.02 | 0.14 | 2.89 | 25.05 | 17.59 | 155.03 | 2821.06 | |
| Strontium (mg L-1) | 0.17 | 0.02 | 0.19 | 107.32 | 0.39 | 0.02 | 0.60 | 99.33 | |
| Silver (μg L-1) | 17.62 | 6.33 | 16.51 | 73.75 | 17.28 | 3.04 | 17.02 | 32.41 | |
| Cadmium (μg L-1) | 1.94 | 5.03 | 3.29 | 15.05 | 2.17 | 5.42 | 3.38 | 10.002 | |
| Lead (μg L-1) | 49.42 | 58.76 | 57.34 | 79.95 | 49.06 | 62.53 | 55.29 | 45.12 | |
| Kadikoy Freshwater Lake | Karaidemir Freshwater Lake | ||||||||
| Autumn | Winter | Spring | Summer | Autumn | Winter | Spring | Summer | ||
| A.T. (°C) | 17.0 | 12.0 | 21.5 | 34.5 | 17.0 | 12.0 | 20.3 | 33.5 | |
| W.T. (°C) | 17.9 | 7.9 | 20.3 | 25.5 | 20.4 | 9.7 | 20.0 | 26.0 | |
| D.O. (mg L-1) | 7.79 | 12.92 | 9.37 | 8.21 | 7.35 | 11.94 | 8.95 | 6.91 | |
| pH | 8.32 | 8.64 | 8.56 | 8.43 | 8.45 | 8.23 | 8.46 | 8.54 | |
| EC (mS cm-1) | 0.37 | 0.44 | 0.62 | 0.70 | 0.38 | 0.52 | 0.77 | 0.74 | |
| Salinity (‰) | 0.1 | 0.1 | 0.2 | 0.3 | 0.1 | 0.1 | 0.2 | 0.3 | |
| TDS (g L-1) | 1.98 | 0.88 | 1.18 | 0.38 | 2.06 | 0.85 | 1.18 | 0.40 | |
| Light Perm. (cm) | 60.0 | 67.5 | 60.0 | 87.0 | 70.0 | 51.5 | 36.5 | 49.5 | |
| N-NO2- (mg L-1) | 0.13 | 0.05 | 0.12 | 0.17 | 0.11 | 0.05 | 0.15 | 0.10 | |
| N-NO3- (mg L-1) | 1.97 | 5.50 | 6.51 | 1.86 | 3.09 | 10.36 | 9.14 | 3.01 | |
| Phosphate (mg L-1) | 0.17 | 0.18 | 0.19 | 0.07 | 0.98 | 0.56 | 0.60 | 0.27 | |
| Sulphate (mg L-1) | 51.26 | 56.66 | 51.04 | 69.79 | 111.87 | 109.29 | 101.50 | 110.19 | |
| Sodium (mg L-1) | 16881.54 | 13.89 | 19.07 | 606.46 | 17.71 | 34.47 | 35.94 | 843.60 | |
| Magnesium (mg L-1) | 22.80 | 14.91 | 18.17 | 461.33 | 9.39 | 18.97 | 17.43 | 436.68 | |
| Aluminium (mg L-1) | 0.56 | 0.43 | 0.99 | 8.21 | 0.20 | 0.45 | 1.05 | 5.33 | |
| Calcium (mg L-1) | 3.53 | 3.86 | 16.72 | 159.58 | 2.78 | 5.20 | 14.58 | 166.34 | |
| Chromium (μg L-1) | 14.66 | 5.58 | 19.38 | 226.18 | 11.58 | 6.23 | 20.01 | 256.97 | |
| Manganese (μg L-1) | 13.20 | 8.62 | 31.98 | 436.09 | 17.22 | 8.77 | 59.29 | 390.69 | |
| Iron (mg L-1) | 1.01 | 0.18 | 2.11 | 20.07 | 0.96 | 0.19 | 2.13 | 19.30 | |
| Cobalt (μg L-1) | 1.03 | 42.48 | 6.38 | 23.86 | 0.82 | 39.66 | 6.67 | 21.08 | |
| Nickel (μg L-1) | 44.44 | 6.82 | 54.91 | 195.80 | 40.79 | 7.41 | 26.11 | 190.25 | |
| Copper (μg L-1) | 31.81 | 24.23 | 35.53 | 73.75 | 33.48 | 32.24 | 35.77 | 74.00 | |
| Zinc (μg L-1) | 96.79 | 95.11 | 87.72 | 262.52 | 103.87 | 108.88 | 65.69 | 330.64 | |
| Arsenic (μg L-1) | 9.48 | 5.24 | 5.73 | 31.44 | 3.75 | 6.45 | 6.16 | 50.55 | |
| Selenium (μg L-1) | 28.10 | 12.30 | 361.41 | 1582.43 | 25.57 | 11.58 | 359.47 | 1527.48 | |
| Strontium (mg L-1) | 11.67 | 0.04 | 0.22 | 4.36 | 0.17 | 0.05 | 0.25 | 4.65 | |
| Silver (μg L-1) | 21.88 | 140.76 | 18.44 | 22.11 | 15.68 | 227.10 | 17.94 | 14.46 | |
| Cadmium (μg L-1) | 2.09 | 3.67 | 3.89 | 5.81 | 2.27 | 3.53 | 3.87 | 6.04 | |
| Lead (μg L-1) | 49.06 | 40.77 | 58.38 | 56.87 | 50.09 | 40.94 | 58.65 | 45.82 | |
According to statistical analyses undertaken to determine the relationships between the bacteria counts and the environmental features of the sampled lakes, we found some results to be meaningful. Because of this evaluation, from the analysis at all sites, we determined that water and air temperature were positively related to THB counts (r= 0.40, p <0.01); salinity and pH were negatively correlated with THB counts (r= -0.80, p <0.01; r= -0.60, p <0.01). However, there was no correlation whatsoever between metal values and THB.
In the Kadikoy freshwater lake, water temperature was found to have a positive relation with conductivity and salinity (r= 0.82 and r= 0.95 respectively, p <0.01), but a negative relation with dissolved oxygen (r= -0.78, p <0.05). Also, the relationships between conductivity and salinity were found to have a positive correlation in the lake (r= 0.77, p <0.05). In the Karaidemir freshwater lake, water temperature was found to have a negative relation with dissolved oxygen and nitrate-nitrogen (r= -0.93, p <0.01 and r= -0.79, p <0.05, respectively). In addition, the relationship between dissolved oxygen and pH was found to have a negative correlation in the lake (r= -0.82, p <0.05). In Dalyan lagoon-lake, water temperature was found to have a positive relation with total dissolved solids, magnesium, and calcium (r= 1.00, p <0.01). While pH and nitrite-nitrogen have a positive correlation, light permeability and nitrate-nitrogen have negative correlation in the lagoon (r= ±1.00, p <0.01). In the Tuzla lagoon-lake, the water temperature was found to have a negative relation with pH, light permeability and total dissolved solids (r= -1.00, p <0.01), but a positive relation with sulphate (r= 1.00, p <0.01). While the relationships between conductivity and salinity, between light permeability and pH were found to be positively correlated; sulphate showed significant negative correlation with light permeability and total dissolved solids (r= ±1.00, p <0.01).
THB and its density have effects on the enrichment of water with organic substances that determine the trophic level of the body of water. Therefore, the number of bacteria in an aquatic ecosystem provides basic information for microbiological studies. Previous studies have shown that bacterial number depends on the autochthonic matter in clear water resources, made up of exometabolites of phyto- and zooplankton excretions as well as allochthonous matter, which enters the water through spring surface run-off and atmospheric precipitation (Jansson et al., 2000; Malecka & Donderski, 2006).
When the counts of heterotrophic bacteria in the sampled lagoon-lakes were evaluated by seasons, the highest count was observed in the autumn (1.9 x 10⁵, Tuzla Lagoon). The maximum number of bacteria was found at freshwater lakes in the spring (4.2 x 10⁶, Kadikoy Lake). This can be explained by an increase of organic material in the water during rainfall during these periods. Rainfall is an important factor in the bacterial contamination of water in urban areas due to runoff. Urban drainage systems and discharges during heavy rainfalls may have significant effects on the quality of receiving waters (Tryland et al., 2014).
Heterotrophic bacteria and some coliforms are found naturally in environmental samples, but fecal coliforms and E. coli contamination occur in surface runoff due to the spread of fertilizers on agricultural land, farms, other areas where animal wastes are deposited, inadequate septic systems, sewer overflows, and wildlife (Dombek et al., 2000).
THB counts were found to be higher than TCB, FCB, and E. coli bacteria at each biotope. When the FCB and the E. coli bacteria numbers were evaluated by sampling stations, the highest values were recorded at freshwater lakes. This may be explained by some settlement sewage entering these systems. Furthermore, the lagoon-lakes that are the farthest from city centres have the lowest bacteriological numbers.
In the Tuzla lagoon-lake, the bacterial counts by seasons were found to be equal. This situation can be explained by the counts of TCB, FCB, and E. coli that come from fecal matter. However, the high counts of total coliforms from other bacteria in the Kadikoy and Karaidemir freshwater lakes show that the total coliform group includes another bacterial presence, apart from the fecal bacteria.
Although total coliform bacteria in an aquatic environment can come from both allochthonous and autochthonous material, fecal and E.coli bacteria can reach the water from allochthonous resources. Thus, these bacterial findings point to pollution in the aquatic environment.
According to the Water Pollution Control Regulation (Anonymous, 2016) inland waters are divided in to four classes: high quality water, slightly polluted water, polluted water, and heavily polluted water. The numbers associated with total coliform for high quality, slightly polluted, polluted, and heavily polluted water are 100, 20000, 100000 and > 100000 MPN 100 mL-1; fecal coliform numbers are 10, 200, 2000 and > 2000 MPN 100 mL-1, respectively (Anonymous, 2016). According to the results, the water quality of the sampled sites was classified as high quality given the average number of coliform bacteria, while water at the Karaidemir freshwater lake was classified as slightly polluted, given the average number of fecal coliform bacteria. According to extracts from the WHO (2003) guideline, the number of total coliform bacteria in bathing waters should not be more than 10000 CFU 100 mL-1 of the water.
Swiatecki (1997) reported that seasonal changes in temperature are correlated with the dynamics of bacteria development in aquatic ecosystems. Furthermore, the processes governing the abundance in microbial community composition may greatly differ between habitats (Canfora et al., 2014; Herlemann et al., 2016). Much as low temperatures can lead to high ion concentrations, salt can affect, the distribution of bacteria (Swiatecki, 1997). In our study, water and air temperature values were directly proportional to THB counts. Salinity and the heterotrophic bacteria distribution were negatively related, according to the Spearman rank correlation test (r= -0.80, p <0.01).
Salinity is a very important environmental factor for aquatic organisms because it can limit their lifespan (Peeters et al., 2011). Salinity is thought to influence the composition of natural bacterial communities (Crump et al., 2004). It is likely that bacteria remain active in the lagoon-lakes, but at a lower rate, due to increased salinity (Hyun et al., 1999). In lagoon-lakes, the primary adverse conditions are hypersalinity and osmotic stress (Aanderud et al., 2016). Similar results were obtained in this study. The low counts of heterotrophic bacteria in the sampled lagoon-lakes can be particularly explained by their salinities. The highest values of salinity were observed during the summer, because the amount of water decreases via evaporation and the intensity of dissolved materials increases, leading to the lowest bacterial distribution. In addition, we observed that light permeability in sampled lagoon-lakes was higher than in sampled freshwater lakes. Nutrients were found to have low quality levels in sampled ecosystems. Sulphate values, in particular, were found to register at a fourth quality level at lagoon-lakes during the summer.
The sampled lagoon-lakes at Meric Basin, are migratory stops and are important in preserving wildlife. The sampled freshwater lakes, located in the southwest of the Sub Thrace Region in Turkey, provide tap and irrigation water. In this study, we found those lakes that act as natural reserves are threatened by all types of pollution from settlements, as well as industrial and agricultural activities. The bacteriological quality of inland water is a concern to consumers, public health authorities and regulators (Odonkor & Ampofo, 2013). Humans and livestock are sources of fecal contamination, and which gives rise to the highest risk of waterborne disease (Mokondoko et al., 2016). Therefore, to minimize the risk of pathogen microorganisms entering surface water, all farm-building drains need to be regularly maintained. Controlling the water flow from fields to surface water is one of the most important options to reduce nutrient pollution of inland water, because both nitrogen compounds and phosphorus contribute to eutrophication.
In conclusion, bacterial populations play significant roles in organic matter decomposition in aquatic environments. They can occur from allochthonous or autochthonous resources, and some environmental conditions can limit their distribution in aquatic environments.
This study may lead to further researches on monitoring of bacterial composition of different water resources in Turkish Thrace. Furthermore, we suggest that these studies continue periodically, and some quality parameters and bacteriological processes should be monitored in aquatic environments.

