


Servicios Personalizados
Revista
Articulo
 Inglés (pdf)
 Artículo en XML
 Referencias del artículo
 Enviar artículo por email
Indicadores
-
 Citado por SciELO
 -
 Accesos
Links relacionados
-
 Similares en
SciELO
Similares en
SciELO
Compartir

 Permalink
Hidrobiológica
versión impresa ISSN 0188-8897
Hidrobiológica vol.19 no.2 Ciudad de México may./ago. 2009
Artículos
Morphometric and genetic characterization of tilapia (Cichlidae: Tilapiini) stocks for effective fisheries management in two mexican reservoirs
Caracterización morfométrica y genética de stocks de tilapias (Cichlidae: Tilapiini) para un efectivo manejo de sus pesquerías en dos presas mexicanas
Verónica Espinosa–Lemus, José Luis Arredondo–Figueroa and Irene de los Angeles Barriga–Sosa*.
Planta Experimental de Producción Acuícola, Departamento de Hidrobiología. División de Ciencias Biológicas y de la Salud, Universidad Autónoma Metropolitana–Iztapalapa. México, Iztapalapa, D. F. 09340. México.* E–mail: ibs@xanum.uam.mx
Recibido: 29 de junio de 2007.
Aceptado: 11 de febrero de 2009.
RESUMEN
Varias especies de tilapias fueron introducidas a la presa El Infiernillo durante los años sesenta del siglo pasado. Posterior a dichas introducciones, la presa ha sido uno de los sitios importantes de producción nacional para peces. Sin embargo, bajas recientes en las capturas, sugieren que las estrategias de manejo y las prácticas de explotación requieren de ser revisadas. Hasta ahora, dichas prácticas de manejo están limitadas por la falta de métodos para evaluar el status de dichas especies introducidas. En éste trabajo se caracterizan morfométricamente dos géneros y tres especies de dos sitios en la presa El Infiernillo y de un sitio de la presa Zicuirán. Las muestras fueron caracterizadas con 14 loci aloenzimáticos y dos marcadores mitocondriales ADN–RFLP, rWS y citocromo b. Basados en estos marcadores morfológicos y genéticos, se identificó a Tilapia rendalli y Oreochromis aureus en la presa El Infiernillo y a Oreochromis mossambicus para Zicurán. Las especies se separaron en dos géneros en base a diferencias en el número de escamas predorsales y a la morfología del diente faríngeo. Para Oreochromis, las especies se separaron con seis variables morfométricas. Los resultados de aloenzimas y PCR–RFLP del mtADN concuerdan con estas diferencias morfológicas. Además, dos poblaciones de O. aureus en la presa El Infiernillo parecen morfológica y genéticamente diferentes. Los niveles de diversidad genética (He = 0.0567–0.2299 y h = 0.0000–0.4848) son bajos comparados con los reportados para poblaciones manejadas adecuadamente. Dados los niveles de variación de estas poblaciones, sugerimos estrategias de manejo adecuadas.
Palabras clave: Infiernillo, variación genética, tilapias, Zicuirán.
ABSTRACT
Several tilapia species were introduced to the Infiernillo Dam during the 1960's. Following this introduction of tilapia, the dam has been an important fish production site in Mexico. However, recent decreases in tilapia catches suggest that fish management strategies and tilapia exploitation practices need to be revised. To date, management practices are limited by the lack of methods to evaluate the status of these introduced species. Here we morphometrically characterized two genera and three species from two sites in the Infiernillo Dam and a site in the Zicuiran Dam. The samples were characterized for 14 allozyme loci and two mitochondrial DNA–RFLP markers, rWS and cytochrome b. Based on these morphological and genetic markers, we identified Tilapia rendalli and Oreochromis aureus in the Infiernillo Dam, and Oreochromis mossambicus at the Zicuiran reservoir. These species were separated into genera based on differences in the number of predorsal scales and the pharyngeal teeth morphology. For Oreochromis, they were further classified into species using six morphometric variables. The allozyme and mtDNA–RFLP results are concordant with the morphological differences. Furthermore, two populations of O. aureus in the Infiernillo Dam appear genetically and morphologically distinct. The levels of genetic variability (He = 0.0567–0.2299 and h = 0.0000–0.4848) are low compared to properly managed tilapia populations. Given the levels of variation in these populations, we suggest sustainable genetic management strategies.
Key words: Genetic variation, Infiernillo, Tilapias, Zicuiran.
INTRODUCTION
Tilapias were introduced into Mexico to facilitate the availability of inexpensive, high protein, and low–fat food staples. Oreochromis aureus Steindachner 1864, and Tilapia rendalli Boulenger 1897, were first introduced into the country in 1964 and 1974, respectively (www.fao.org/fishery/introsp/1866–2598), whereas O. mossambicus Peters 1852 was first introduced into the country in 1964 from Auburn University, Alabama (Morales, 1991). Following their introductions, these tilapia species have become widely distributed throughout natural and artificial water reservoirs in tropical and temperate regions of Mexico (Arredondo, 1983). Tilapias (3,385 fry) were first introduced into the Adolfo Lopez Mateos Infiernillo Dam in 1969. In 1987, the tilapias in the dam reached its maximum production of 18,953 metric tons, which made it the main source of tilapia in Latin America (Guzmán Urioestegui, 1994). However, during the late 1990's this tilapia–based fishery faced a drastic decrease in production due to overexploitation (Jiménez–Badillo, 1999) and inbreeding. In contrast, the Zicuiran Dam has been maintained as a lower profile fishery. Records show that in the late 1990's, these two dams were stocked with fry from the same tilapia fry production farm (TFPF). However, Mexican tilapia fisheries have few records to show which among the species and strains were introduced. To enhance the fish stocks and to aid in developing fisheries management legislation, monitoring genetic stock diversity is essential (Bentzen & Thodesen, 2005; Haughton et al., 2006). Genetic monitoring also reveals the past and present genetic variation within the managed fisheries. Because the two dams have similar genetic histories, we studied the fish populations from both dams.
The most recent genetic studies on tilapia species focused on reconstructing phylogenetic relationships between species (Pouyaud & Agnëse, 1995; Sodsuk et al., 1995; Feresu–Shonhiwa & Howard, 1998; Klett & Meyer, 2002; Salzburger et al., 2002) while few have focused on tilapia population genetics (Rognon & Guyomard, 1997; Wilson et al., 2000; De Silva, 2004). One relevant population genetics study found low genetic variation in farmed and wild tilapia populations, including a sample from Infiernillo, and suggested a monitoring program to improve management practices (Barriga–Sosa et al., 2004). To gain a better perspective on the genetic variation in two managed populations, Infiernillo and Zicuirán Dams, we characterized the morphometric and genetic variation of three putative species of tilapia. With these data, we can better understand the history and species composition of these populations. Based on the current genetic variation, we can help develop informed management strategies. We have three objectives for this study: 1) identify which species are present; 2) determine the morphometric and genetic variation within and between populations; and 3) determine the population genetic structure and evaluate if the populations interbreed.
MATERIALS AND METHODS
Study sites. The Infiernillo Dam (120 km in length and 34,600 hectares, surface area) was built in 1963 within the limits of Michoacán and Guerrero states (18° 52' 00" N, 18° 11' 00" N, 101° 03' 00" W and 102° 07' 00" W). The Infiernillo is part of the hydrological region "Cuenca del Río Balsas" and draws 74.64 % of the water in the system (Jiménez–Badillo, 1999). It receives water from the Tepalcatepec, Cupatitzio, Del Marquez, Paso de las Crucitas or Pinzandarán, Balsas, Cutzamala, Tacambaro and Huetamo rivers and from the Churumuco streams (Fig. 1). The Zicuiran Dam (490 hectares, 4.9 km maximum length, and 30 m maximum depth; 18° 56' 15'' N, 101° 55' 30'' W) gets its water from the Zicuiran river, the permanent tributaries El Huamito and El Conguripo and the temporal stream La Manga (Aguilera–Reyes, pers. comm.).
Tilapia sampling. A total of 248 fish were collected between 1999 and 2000 from three collecting sites. From two commercial catch sites at the Infiernillo Dam, 188 organisms were caught (El Platanito (P), N = 79 and La Quebradora (Q), N = 119). The remaining 50 organisms were obtained from culture cages at the Zicuiran Dam (Z, N = 50) (Fig. 1). The three locations are separated by 13–21 km.
Fish were caught with gill nets with a mesh size of 3¼". The fish were immediately frozen in dry ice (–80°C) and transported to the Laboratorio de Genética y Biología Molecular de la Planta Experimental de Producción Acuícola (PExPA), Universidad Autónoma Metropolitana Unidad Iztapalapa for processing.
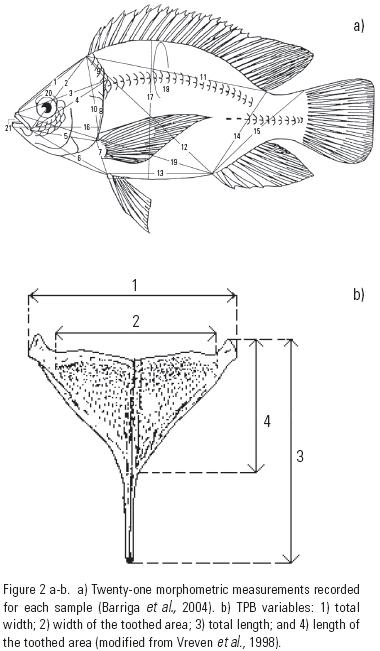
Morphological identification of tilapias and variation. Each collection site was considered a priori as a discrete group. Fish were first assessed as to whether it belongs to either the genus Tilapia or Oreochromis following established criteria (Trewavas, 1983) and analysis of the morphology of the pharyngeal teeth (Oreochromis – monocuspid and bicuspid and Tilapia – tricuspid). To identify fish samples at the species level, we assessed 21 morphometric variables (M) (Vreven et al ., 1998; Barriga–Sosa et al., 2004). All M characters were measured to the nearest 0.1 mm using digital calipers (Fig. 2a). The five meristic variables (m) recorded for each sample were: a) number of scales of the inferior lateral series and b) number of predorsal scales, c) number of gill rakers (first gill raker), d) number of spines and e) rays of dorsal fin (Barriga–Sosa et al., 2004). Once the species are identified, the following morphological variables of the toothed pharyngeal bone (TPB) were assessed to confirm the identity and record morphological variation: a) total width (ttw), b) width of the toothed area (wta), c) total length (tt), and d) length of the toothed area (Ita) (Fig. 2b) (Arredondo–Figueroa & Tejeda–Salinas, 1989). An American Optical Stereo Scope microscope model 569 (3.0x) was used to measure the morphological variables of the TPB and the meristic characters.
The M (continuous) and m (discrete) data were analyzed separately. To evaluate if the data have equal variances, a Bartlett test was done prior to further analyses. The parameters of the allometric ratios between total length (considered as the independent variable) and the remaining 20 morphometric measures as dependent variables were calculated as follows: Yij = aiTljbi, where Tlj is the total length of organism j ; Yij is variable i of organism j; and ai and bi are the parameters of the allometric ratio between Tl and variable i. To eliminate differences related to size, morphometric data were transformed according to three different criteria (Barriga–Sosa et al., 2004): i) proportion, representing each character relative to length; ii) logarithmic transformation of each character and iii) normalization of individuals of each group (Lombarte & Lleonart, 1993). Original data (Mo) were also analyzed. To account for unequal variances, the TPB data were logarithmically transformed. To compare the TPB data between species, a Tukey test on the transformed data was performed. To reduce the number of variables, the M & m data were submitted to multivariate analyses using two descriptive and exploratory methods: a) principal component (PC) and reciprocal averaging (RA) and b) discriminate analysis (DA). Statistical and multivariate analyses were carried out as follows: the RA analysis was done by using Co603c (Lleonart, 1991), and the PC and DA analyses were done in STATISTICA version 6.0 (1997).
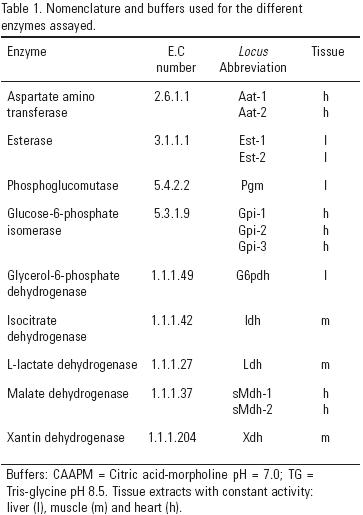
Allozyme Analysis. Allozyme markers and allele designations were taken from Barriga–Sosa et al., (2002; 2004). The staining protocol was based on Barriga–Sosa et al., (2002). A summary of electrophoretic buffers, enzyme names and numbers, abbreviations, and putative resolved loci in liver, muscle and heart tissues in Cellulose Acetate Gel Electrophoresis (CAGE) are presented in Table 1.
For each species and sample, allele frequencies per locus, proportion of polymorphic loci (P.95 criteria), mean number of alleles per locus, and expected (He) heterozygosity were calculated. Deviations from the expected Hardy–Weinberg equilibrium (HWE) were tested using the Monte Carlo method (10,000 permutations) in GENEPOP 3.1 (Raymond & Rousset, 1995). To test the significance of allele frequency differences between species and samples, Fisher's combined probability test (Sokal & Rohlf, 1995) was used in TFPGA 1.3 (Miller, 1998). F indices (Weir & Cockerham, 1984) were computed with GENEPOP 3.1. When sample size allowed, Weir & Cockerham F–statistics (1984) were estimated with F–STAT 2.9.3.2 (Goudet, 2001). Because natural hybridization can occur between congeners of the Tilapinii family (Trewavas, 1983), and because of the uncertainty of species distribution within these water reservoirs, the following parameters were calculated for each subpopulation or sample: f or the correlation of genes for individuals in the same subpopulations; and θS, the correlation of genes for individuals in different subpopulations. Variances of these parameters were estimated by jack–knifing across loci. The value of θS and its confidence intervals (95% and 99%) were also computed. F–statistics were estimated for significance with 2,000 allele permutations within subpopulations (f) and between subpopulations (F and θS) over all loci. Pairwise tests of population differentiation were calculated and Bonferroni corrections were used (Goudet, 2001).
PCR–RFLP analysis. Total DNA was extracted from frozen muscle following the DNeasy® (QIAGEN, Valencia, Ca) protocol with the modifications of Barriga–Sosa et al., (2005). Total DNA was quantified with gel electrophoresis, using the standard 123 bp DNA ladder (1 mg/mL, Sigma BioSciences, St. Louis, Mo) as reference marker, visualized under UV light, and photo documented with a Polaroid DS–34 Direct Screen Instant Camera (Polaroid, Co., Cambridge, Ma).
Two mitochondrial DNA or mtDNA genes namely, r16S and cytochrome b (cytb) were amplified according to conditions described in Barriga–Sosa et al., (2005). The cycling conditions for both genes were established by the results obtained after a series of gradient PCRs at annealing temperatures between 36 and 42°C. Both genes amplified the best with the following parameters: an initial cycle (94°C for 1:30 min), annealing (36°C for 0:30 min), and extension (72°C for 1:30 min), followed by 30 cycles at 94°C for 45 sec, 36°C for 30 sec, and a final extension at 72°C for 10 min.
The PCR amplicons were purified utilizing the QIAquick® columns (QIAGEN, Valencia, Ca) prior to the restriction digests with Alu I, Hae III, and Rsa I (Boehringer Mannheim, Germany).
These enzymes were selected based on the presence/absence of restriction sites in partial sequences of both genes (O. mossambicus mitochondrial cytb, GenBank X81565 and r16S genes, GenBank AY597335).
Restriction digests were carried out according to the manufacturer specifications in a final volume of 25 mL with 20 ng/mL of purified PCR product. Restriction fragments were sized on 2.0% agarose gels with 20 bp (500 ng, BIO–RAD, Hercules, Ca) and 100 bp molecular rulers (250 ng, BIO–RAD, Hercules, Ca) as standard markers. Gels were run for 1.75 to 2 hrs, depending on the sizes of the expected products.
A restriction site presence/absence matrix was created with the GENERATE program in the REAP package (McElroy et al., 1992). Haplotype frequencies were calculated in Arlequin 2.000 software (Schneider et al., 2000). Haplotype and nucleotide diversity indices (Nei, 1987), and divergence between species (Nei & Tajima, 1981) were computed with D and DA programs inside the REAP package.
RESULTS
Fish identity based on morphological characters and variation. The sample size, mean TL (mm), size intervals (Min–Max), collecting site and date for each species are presented in Table 2. Two genera are identified based on pharyngeal teeth characteristics: Oreochromis, with monocuspid and bicuspid teeth, and Tilapia, with tricuspid teeth. Oreochromis aureus (A) and T. rendalli (T) are both identified from two sites at the Infiernillo Dam [Platanito (AP and TP) and Quebradora (AQ and TQ)]. O. mossambicus is identified only from Zicuirán (MZ). The morphological data of the TPB confirmed the identity of the samples to the genus and species levels. Significant differences were observed between genera and species in all variables (p< 0.05), except wta between O. aureus vs. O. mossambicus and ttl between T. rendalli vs. O. mossambicus (Table 3).


For the meristic data (m) RA explains the 97.81% of the variance (Table 4). These data support the separation of fish in the two genera, Oreochromis and Tilapia. Similarly, DA also resolves the two genera. The single m variable accounting for the highest percentage of the variance is the number of predorsal scales (0.83 %).
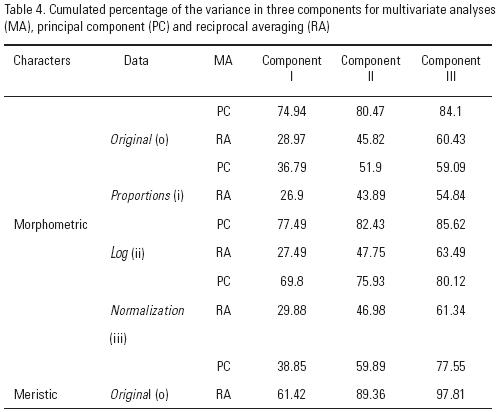
The M data resolved variation within species, but differ in whether the intraspecific variation is from shape or size. With the raw data (Mo) and the data transformed proportionally (i) or logarithmically (ii), the first two components of the PC and RA analyses show changes that relates to size. However, the PC and RA analyses with normalized data (iii) show a correlation matrix with different sign and magnitude, a pattern that suggests variation in shape (data available on request) (Corti et al., 1988; Cuadras, 1991). To reduce the number of variables, we use the PC because it suggests a clear separation between samples and explains the highest percentage of the variance (Table 4).
The three species are clearly differentiated through these analyses. Overall, six morphometric variables contribute to the species distinctions (with the highest variance percentages): the distance from the end of the mouth opening to the most anterior dorsal fin (variable 2, 0.95); the distance from the end of the mouth opening to the most superior origin of the opercule (3, 0.96); the distance of the origin of the dorsal fin to the origin of anal fin (11, 0.93); the distance of the origin of pelvic fin to the origin of anal fin (12, 0.93); the distance of the origin of the anal fin to the end of dorsal fin (14, 0.94); and the distance of the origin of the anal fin to the upper end of the caudal fin (15, 0.94) (Table 5).
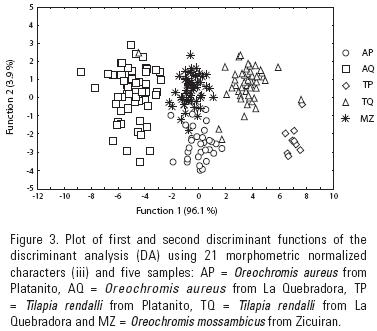
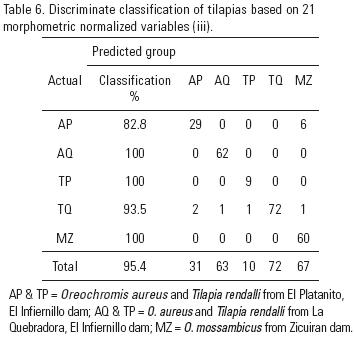
The first two discriminant functions resolved from the morphometric variables (M iii) show 96.1 and 3.9 relative percentage of classification and a canonical correlation of 0.90 (data not shown). In the plot of this analysis, AQ appears in the right section of the plot, whereas AP appears close to MZ in the lower middle and TQ and TP are on the left side (Fig. 3). With this analysis, AQ, TP and MZ are 100% correctly classified, TQ is 93.5% correctly classified and AP is 82.8% correctly classified (Table 6).
Allele Frequencies and Allozyme Variation. Only one locus was detected for Idh, G6pdh, Pgm and Xdh, while Aat, Mdh and Est have two loci and Gpi three loci. Eight loci are polymorphic (Table 7), while the remaining 5 loci (locus 1 for Idh, Mdh, Xdh and loci 1 and 2 for Aat) are monomorphic in all samples. With the P.95 criteria, T P, MZ and AQ have the highest number of polymorphic loci (50%), followed by TQ (37.5%), while AP (25%) had the fewest polymorphic loci. A similar pattern is observed for He (ranges from 0.0567 to 0.2299). Significant differences in the allele frequencies of seven polymorphic loci are found in most pairwise comparisons (Table 7). Pairwise comparisons of TP–TQ and TP–MZ allele frequencies are not significantly different. Therefore, all T. rendalli samples are regarded as a single sample (population TI) for further analyses. Most samples showed departure from HWE at one or more loci (Table 7). An overall deficiency of heterozygotes is observed in all populations (average jack–knifed F, 0.427, S.E. 0.105). Significant levels of intra–specific differentiation are found in O. aureus (AQ and A P, FST 0.4109, p< 0.5).
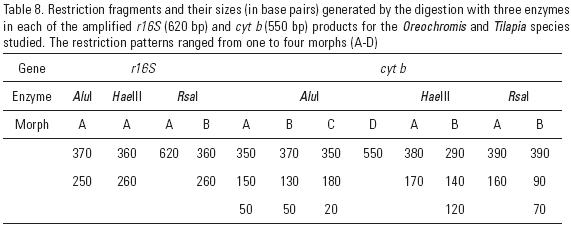
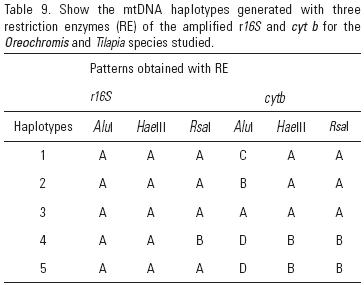
Variation in r16s and cytb. The r16S and cytb amplicons from 31 fish (AQ = 12, TI = 11, and MZ = 8) are 620 bp and 550 bp, respectively. Enzymes Alu I, Hae III and Rsa I all cut the amplified r16S and cytb products, generating 12 restriction fragments (Table 8), corresponding to five r16S/cytb haplotypes (Table 9). None of the five r16S/cytb haplotypes is shared between populations. Haplotypes AAACAA and AAABAA are unique to AQ. TI is monomorphic with all individuals showing the unique haplotype AAAAAA. In MZ, all individuals have haplotypes AABDBB or AAADBB. Haplotype diversity (h) ranges from 0.0000 ± 0.0000 in TI to 0.4848 ± 0.1059 in AQ, and nucleotide diversity (π) ranges from 0.0000 in TI and MZ to 0.0187 in AQ (Table 10).

DISCUSSION
Despite problems in one of its major reservoirs, tilapia production continues in Mexico. This production has generated social and economic benefits to local rural areas, and results to an estimated national income of 70 million USD. The Infiernillo Dam is one of the most important tilapia producers at the national level. Although the production in the Zicuiran Dam is not as important, it satisfies the demand of local populations.
Re–stocking Mexican lakes and reservoirs is a common practice. For example, 200,000 tilapia fry were re–stocked in the Infiernillo Dam between 1998 and 2000, and at the Zicuiran Dam, 635,000 tilapia fry were re–stocked from 1999–2002 (Gobierno del Estado de Michoacán, oficio HOO/CPATZ/334). In both cases, the re–stocked tilapias had no species identity or genetic information and were only recognized as "tilapias". Likewise, there are no reliable records to assist in adequate fisheries management. Here, we identify the tilapias from these reservoirs and report the level of their genetic diversity. These data can be used for improving the management practices of tilapia in the biggest reservoir of Mexico that will optimize productivity.
The tilapia genera and species were easily identified by tooth characteristics as previously reported (Liem, 1974; Trewavas, 1983; Arredondo–Figueroa & Tejeda–Salinas, 1989), and the number of predorsal scales (PDS). Among the six morphological variables that aid in the discrimination of species and populations, two variables are related to feeding habits and four to swimming capacity and maintenance of the animals in the water column. These differences could relate to known differences in tilapia species' habitat preferences. Oreochromis mossambicus avoids strong currents and prefers turbid planktonic waters. Although O. mossambicus can coexist with Tilapia rendalli, only O. mossambicus was found in the Zicuirán Dam. Oreochromis aureus also inhabits phyto– and zooplanktonic waters (Trewavas, 1983). Interestingly, both O. aureus & T. rendalli have two differentiated forms in different sites in the Infiernillo Dam. Such morphometric variation has been previously observed for tilapia species and strains, both wild and cultured (Eknath et al., 1991; Vreven et al., 1998; Barriga–Sosa et al., 2004; Narváez et al., 2005). In most cases, the environment has a direct influence in shape differentiation. For example, Barriga–Sosa et al., (2004) reported al least two forms of O. aureus in Mexico (from Infiernillo and from the TFPF "Los Amates" in the state of Veracruz). However, this report is the first to document intra–lacustrine or intra–reservoir variation in tilapias.
The O. aureus stock from the Infiernillo Dam is derived from 3, 685 tilapia fry introduced in 1966 (original brooders from Auburn University, Alabama, USA) (Guzmán Urioestegui, 1994) and from 200,000 "tilapia" fry re–stocked in the dam between 1998 and 2000, most probably from the TFPF "Los Amates", Veracruz (Gobierno del Estado de Michoacán, oficio HOO/CPATZ/334). These initial and re–stocking events could have introduced the intra–reservoir morphological differences observed in O. aureus and T. rendalli. However, it remains a possibility that environmental factors promote differentiation within the dam.
The allele distribution for the allozymes discriminates between the two tilapia genera. For example, allele b of loci Est–1 and Est–2 are unique to samples TI and MZ, respectively, suggesting that these can be used as diagnostic markers to discriminate between T. rendalli and O. mossambicus. Although each of these two loci were found in other tilapinii studies (McAndrew & Majumdar, 1983; Feresu–Shonhiwa & Howard, 1998; Appleyard & Mather, 2002; De Silva, 2004), only McAndrew & Majumdar (1983) report both loci and used them to discriminate between con–specifics (O. andersonii Castelnau 1861 and O. mossambicus).
The levels of genetic variability observed in this study (He, Table 7), are within the range of what has been previously been reported for both wild and cultured species and populations. However, they are relatively low compared to those recently reported for properly managed populations. Wild and cultured populations of O. niloticus had low levels of He (Macaranas et al., 1995), and wild Oreochromis spp. of Lake Malawi had intermediate levels of He (Sodsuk et al., 1995). In a comparison of natural and cultured populations of O. niloticus and T. zilli, both had high levels of variation, suggesting proper management strategies in these fisheries (Rognon et al., 1996). In a study about mitochondrial introgression between O. aureus and O. niloticus in natural and cultured populations, in which allozymes were also utilized, levels of variation ranged from 0.0 for a natural population to 0.71 for cultured organisms (Rognon & Guyomard, 2003). The low He observed in AP might result from high fishing rates. This site and Nuevo Centro account for 66.9 % of the Infiernillo dam total tilapia production (2,280 and 1,988 ton/year, respectively). Such high production may directly impact tilapia population sizes. Additionally, eviscerated fish products are dumped at these sites (Jiménez–Badillo, 1999), producing anoxic conditions, and causing the fish to move to other areas of the dam. Furthermore, seasonal droughts or water level fluctuations create bottleneck processes in fish populations that can lead to low He and rapid allele frequency change (Rognon & Guyomard, 1997; Sturmbauer et al., 2001) or maintain their genetic variation (Chakraborty & Nei, 1977; Sodsuk et al., 1995). El Platanito has drought periods between January and May, when the water level drops to 40 m. This event drives fish populations to deeper and more confined areas such as Pinzandarán (60 m), an area close to the dam curtain with pronounced hills (Jiménez–Badillo, 1999). In this region, seasonal pools with peculiar physicochemical conditions attract fishes with surprising morphological features, suggesting high phenotypic plasticity among tilapias (Falk et al., 2000). The cycles of flow into the dam allow for a variety of microclimates. These microclimates could contribute to population subdivision and differentiate semi–isolated genetic units (van Open et al., 1997). This mechanism of population subdivision might be the case of O. aureus at the Infiernillo, as AP and AQ show significant levels of intra–specific genetic differentiation (θST = 0.4343, p< 0.5), which is concordant with both differentiation at Gpi–3 and morphological differentiation (as mentioned earlier by AD analysis). The observed morphological and genetic differentiation could be the initial stages of allopatric speciation of O. aureus populations, separated by approximately 13 km within the Infiernillo Dam. To determine if the differentiation is intraspecific variation or the initial stages of speciation, further genetic studies with codominant DNA markers, a yearly sampling strategy and more extensive sampling are required.
Departure from HWE is evident in samples AQ and MZ, which have heterozygous deficiencies at three and four loci, respectively. Such deficiencies indicate an absence of random mating (FIS). AP and TI each have only one locus deficient for heterozygotes. Heterozygote deficit can result from the further population substructure, the Wahlund effect or inbreeding. For MZ, the deficit may be explained by inbreeding, because the tilapia in the Zicuirán Dam is isolated from the Infiernillo Dam by 19–21 km of seasonal streams. Furthermore, O. mossambicus is the only "tilapia" introduced in this dam. In contrast, the heterozygote deficit of O. aureas could result from the Wahlund effect with two possible scenarios. First, O. aureus comes from two different origins, each of which differs in allele frequencies. Second, significant allele frequency differences are accumulated as the two populations are isolated in the dam. The Fisher's P results indicate significant differences between AP and AQ in five out of eight polymorphic loci (Gpi 1–3, G6pdh a nd Ldh). Linkage disequilibrium (LD, based on 14000 permutations) was significant overall, and for the first scenario suggesting two distinct origins for AQ. Both characteristics, significant differences in allele frequencies and LD, are classic features of a Wahlund effect, but further studies are required for more conclusive evidence.
Based on five unique r16S/cytb haplotypes, genetic diversity indices were measured. Similar to the results from the allozyme data, the observed genetic variation based on mtDNA RFLP is low compared to that of other tilapia species, both wild and cultured. Despite the low variation in these markers, they provide sufficient resolution to define species and genera. Low levels of genetic variation were also found in three O. alcalicus populations in two lakes (Wilson et al., 2000). Despite a low number of haplotypes, high levels of genetic variation were found for O. niloticus and a red hybrid tilapia (Romana–Eguia et al., 2004).
The tilapias from the Infiernillo Dam are declining due to fishing pressure and drastic environmental cycles. The rainy and dry seasons promote the formation of microclimates that can create bottlenecks that might be playing important roles in micro–evolutionary processes and maintenance of genetic diversity. By implementing three new strategies, the management of tilapia stocks can be greatly improved. First, DNA–based molecular markers can be used as a non–invasive method to identify and characterize tilapias for re–stocking. Second, periodic assessments of the standing genetic diversity of populations can be used to evaluate the health of a population to define management strategies. Third, maintaining genetic heterogeneity in reproductive stocks can allow for constant and predictable tilapia production that satisfies the national demand. Federal management agencies would benefit from a national genetic database for stock management containing molecular marker information on the re–stocked tilapias. These genetic markers can improve assessment and characterization of diversity in stocks, which increases the chances that re–stocked tilapia fisheries are being managed effectively for long–term survival.
ACKNOWLEDGEMENTS
The first author was granted a CONACyT Doctoral scholarship No. 95880 and this research is part of a requirement of the Programa del Doctorado en Ciencias Biológicas de la UAM. The first author thanks Ana Laura Ibáñez for advice with the morphological analysis. Research was supported with University Funding (Project No. 147032665).
REFERENCES
Appleyard, S. A. & P. B. Mather. 2002. Genetic characterization of cultured tilapia in Fiji using allozymes and random amplified polymorphic DNA. Asian Fisheries Science 15: 249–264 [ Links ]
Arredondo–Figueroa, J. L. 1983. Especies animales acuáticas de importancia nutricional introducidas en Mexico. Biotica 8 (2): 175–199. [ Links ]
Arredondo–Figueroa, J. L. & M. Tejeda–Salinas. 1989. El hueso faríngeo, una estructura útil para la identificación de especies de la tribu Tilapinii (Tilapia; Cichlidae), introducidas en Mexico. Anales del Instituto de Ciencias del Mar y Limnología Universidad Nacional Autónoma de Mexico 16 (1): 59–68. [ Links ]
Barriga–Sosa, I. D. L. A., F. J. L. Arredondo–Figueroa & I. Mora–Souza. 2002. Manual técnico para la discriminación de tilapias introducidas a México por medio de la utilización de marcadores aloenzimáticos. Universidad Autónoma Metropolitana–Iztapalapa. Serie Desarrollos Tecnológicos en Acuicultura. 1ra. Ed. Editorial UAM. Mexico, Iztapalapa, D.F. 43 p. [ Links ]
Barriga–Sosa, I. D. L. A., M. L. Badillo–Jiménez, A. L. Ibáñez–Aguirre & J. L. Arredondo–Figueroa. 2004. Variability of tilapias introduced in Mexico: morphometric, meristic and genetic characters. Journal of Applied Ichthyology 20: 7–14. [ Links ]
Barriga–Sosa, I. D. L. A., M. Y. Pérez–Ramírez, F. Soto–Aguirre, M. Castillo–Rivera & J. L. Arredondo–Figueroa. 2005. Inter–specific variation of the mitochondrial r16S gene among silversides "Peces Blancos" (Atherinopsidae: Menidiinae) and its utilization for species identification. Aquaculture 250: 637–651. [ Links ]
Bentzen, H. B. & J. Thodesen. 2005. Genetic interactions between farmed and wild fish, with examples from the Atlantic Salmon case in Norway. In: Gjedrem, T. (Editor). Selection and Breeding Programs in Aquaculture. Springer, The Netherlands, pp. 319–359. [ Links ]
Boulenger, G. A. 1897. Descriptions of new fishes from the Upper Shiré River, British Central Africa, collected by Dr. Percy Rendall, and presented to the British Museum by Sir Harry H. Johnston, K. C. B. Proceedings of the Zoological Society of London: 915–920. [ Links ]
Castelnau, F. L. 1861. Mémoire sur les poissons de l'Afrique australe. Paris. Mémoire sur les poissons de l'Afrique australe: i–vii + 1–78. [ Links ]
Chakraborty, R. & M. Nei. 1977. Bottleneck effects on average heterozygosity and genetic distance with the stepwise mutation model. Evolution 31 (2): 347–356. [ Links ]
Corti, M., R. S. Torpe, l. Sola, V. Sbordoni & S. Cataudell. 1988. Multivariate morphometrics in aquaculture: A case study of six stocks of the common carp (Cyprinus carpio) from Italy. Canadian Journal of Fisheries and Aquatic Sciences 45: 1548–1554. [ Links ]
Cuadras, C. M. 1991. Métodos de Análisis Multivariante. Promociones y Publicaciones Universitarias, Barcelona, España. 664 p. [ Links ]
De Silva, C. D. 2004. Genetic variation in tilapia populations in man–made reservoirs in Sri Lanka. Aquaculture International 5: 339–349 [ Links ]
Eknath, A. E., J. M. Macaranas, L. Q. Agustin, R. R. Velasco, C. A. Ablan, J. R. Pante M. J & R. S. V. Pullin. 1991. Biochemical and morphometric approaches to characterize farmed tilapias. Naga, International Center for Living Aquatic Resources Management Contribution 722: 7–9. [ Links ]
Falk, T. M., G. G. Teugels., E. K. Abban., W. Villwock & L. Renwrantz. 2000. Morphometric and allozyme variation in the black–chinned tilapia Sarotherodon melanotheron (Perciformes, Cichlidae), with a revision of the subspecies complex. Journal of Natural History 34 (9): 1849–1863. [ Links ]
Feresu–Shonhiwa, F. & J. H. Howard. 1998. Electrophoretic identification and phylogenetic relationships of indigenous tilapiine species of Zimbabwe. Journal of Fish Biology 53: 1178–1206 [ Links ]
Gobierno del Estado de Michoacán, oficio HOO/CPATZ/334. [ Links ]
Goudet, J. 2001. FSTAT, a program to estimate and test gene diversities and fixation indices (version 2.9.3) http://www.unil.ch/izea/softwares/fstat.html. updated from Goudet (1995). 39 p. [ Links ]
Guzmán Uriostegui, A. 1994. Parámetros Biológicos de Tilapia (Oreochromis aureus Steindachner, 1864) de la presa Adolfo López Mateos "El Infiernillo" Michoacán–Guerrero, Mexico. Tesis de Licenciatura. Facultad de Ciencias UNAM. Mexico. 33 p. [ Links ]
Haughton, M., I. Carryl & N. Bissember. 2006. Fisheries policy and management in Canada and lessons for Caricom's common Fishery policy and regime. Report of Study Mission to Canada, CRFM. Belize, C.A. 29 p. [ Links ]
Jiménez–Badillo, M. L. 1999. Análisis de la pesquería de tilapia Oreochromis sp. (Pisces: Cichlidae) en la presa Adolfo López Mateos, Michoacán–Guerrero. Tesis de Doctorado, Instituto de Ciencias del Mar y Limnología, UNAM, México. 217 p. [ Links ]
Klett V. & A. Meyer. 2002. What, if anything, is a tilapia? – Mitochondrial ND2 phylogeny of tilapiines and the evolution of parental care systems in the African cichlid fishes. Molecular Biology and Evolution 19: 865–883. [ Links ]
Liem, K. F. 1974. Evolutionary strategies and morphological innovations: cichlids pharyngeal jaws. Systematic Zoology 22: 425–441. [ Links ]
Lleonart, J. 1991. Co603c (Programa para Análisis de Correspondencia). Barcelona, España. [ Links ]
Lombarte, A. & J. Lleonart. 1993. Otolith size changes related with body growth, habitat depth and temperature. Environmental Biology of Fishes 37: 297–306. [ Links ]
Macarsnas, M. J., L. Q. Agustin, M. C. A. AblAn, M. J. R. Pante, A. A. Eknath & R. S. V. Pullin 1995. Genetic improvement of farmed tilapias: biochemical characterization of strain differences in Nile tilapia. Aquaculture International 3: 43–54. [ Links ]
McAndrew, B. J. & K. C. Majumdar. 1983. Tilapia stock identification using electrophoretic markers. Aquaculture 30: 249–261. [ Links ]
McElroy, D., P. Moran, E. Bermingham & I. Kornfield. 1992. REAP The Restriction Enzyme Analysis Package 4.0. Department of Zoology. Migratory Fish Research Institute and Center for Marine Studies University of Maine. 38 p. [ Links ]
Miller, M. P. 1998. TFPGA (version 1.3): Tools for Population Genetic Analysis. Department of Biological Sciences, Northern Arizona University, Flagstaff, Arizona. 32 p. [ Links ]
Morales, D. A. 1991. La tilapia en México. Biología, cultivo y pesquerías. AGT Editor S.A. Mexico. 190 p. [ Links ]
Narváez, B. J. C., A. Acero P. & J. Blanco R. 2005. Variación morfométrica en poblaciones naturalizadas y domesticadas de la tilapia del Nilo Oreochromis niloticus (Teleostei: Cichlidae) en el norte de Colombia. Revista de la Academia Colombiana de Ciencias XXIX (112): 383–394. [ Links ]
Nei, M. 1987. Molecular Evolutionary Genetics. Columbia University Press, New York. 512 p. [ Links ]
Nei, M. & F. Tajima. 1981. DNA polymorphism detectable by restriction endonucleases. Genetics 97: 145–163. [ Links ]
Peters, W. C. H. 1852. Diagnosen von neuen Flussfischen aus Mossambique. Monatsbericht Akademie der Wissenschaften zu Berlin: 275–276, 681–685. [ Links ]
Pouyaud, L. & J. F. Agnëse. 1995. Phylogenetic relationships between 21 species of three tilapiine genera Tilapia, Sarotherodon and Oreochromis using allozyme data. Journal of Fish Biology 47: 26–38. [ Links ]
Raymond, M. & F. Rousset. 1995. GENEPOP (version 1.2): population genetics software for exact tests and ecumenicism. Heredity 86: 248–249. [ Links ]
Rognon, X. & R. Guyomard. 1997. Mitochondrial DNA differentiation among East and West African Nile tilapia populations. Journal of Fish Biology 51: 204–207 [ Links ]
Rognon, X. & R. Guyomard. 2003. Large extent of mitochondrial DNA transfer from Oreochromis aureus to O. niloticus in West Africa. Molecular Ecology 12: 435–445. [ Links ]
Rognon, X., M. Andriamanga, B. MCAndrew & R. Guyomard. 1996. Allozyme variation in natural and cultured populations in two species: Oreochromis niloticus and Tilapia zilli. Heredity 76: 640–650. [ Links ]
Romana–Eguia, M. R. R., M. Ikeda, Z. U. Basiao & N. Taniguchi. 2004. Genetic diversity in farmed Asian Nile and red hybrid tilapia stocks evaluated from microsatellites and mitochondrial DNA analysis. Aquaculture 236: 131–150. [ Links ]
Salzburger, W., A. Meyer, S. Baric, E. Verheyen & C. Stunbauer. 2002. Phylogeny of the Lake Tanganyika cichlid species flock and its relationship to the central and east African haplochromine cichlid fish faunas. Systematic Biology 51: 113–135. [ Links ]
Sodsuk, P. K., B. J. MCAndrew & G. F. Turner. 1995. Evolutionary relationships of the lake Malawi Oreochromis species: evidence from allozymes. Journal of Fish Biology 47: 321–333. [ Links ]
Sokal, R. R. & F. J. Rohlf. 1995. Biometry. 3rd edition. W.H. Freeman New York. 887 p. [ Links ]
Schneider, S., D. Roessli & L. Excoffier. 2000. Arlequin ver. 2.000: A software for population genetics data analysis. Genetics and Biometry Laboratory, University of Geneva, Switzerlang. 111 p. [ Links ]
Sodsuk, P. K., B. J. MCAndrew & G. F. Turner. 1995. Evolutionary relationships of the lake Malawi Oreochromis species: evidence from allozymes. Journal of Fish Biology 47: 321–333. [ Links ]
STATISTICA VERSION 6.0 (1997). [ Links ]
Steindachner, F. 1864. Ichthyologische Mittheilungen. (VII.) [With subtitles I–VIII]. Verhandllungen der kaiserlich–kongiglichen zoologish–botanischen Gesellschaft in Wien Verh: 223–232 [ Links ]
Sturmbauer, Ch., S. Baric, W. Salzburger, L. Rüber & E. Verheyen. 2001. Lake level fluctuations synchronize genetic divergences of cichlid fishes in African Lakes. Molecular Biology and Evolution 18 (2): 144–154. [ Links ]
Trewavas, E. 1983. Tilapiini fishes of the genera Sarotherodon, Oreochromis and Danakalia. British Musheum (Nat. Hist.). 583 p. [ Links ]
Van Oppen, M. J. H., G. F. Turner, C. Rico., J. C. Deutsch, K. M. Ibrahim., R. L. Robimson & G. M. Hewwitt. 1997. Unusually fine scale genetic structuring found in rapidly speciating Malawi cichlid fishes. Proceedings of the Royal Society of London B. Biological Sciences 264:1803–1812 [ Links ]
Vreven, E. J., B. Adepo–Gourene, J. F. Agnèse & G. G. Teugels. 1998. Morphometric and allozyme variation in natural populations and cultured strains of the Nile tilapia Oreochromis niloticus (Teleostei, Cichlidae). Belgian Journal of Zoology 128:23–34. [ Links ]
Weir, B. S. & C. C. Cockerham. 1984. Estimating F–statistics for the analysis of population structure. Evolution 38: 1358–1370. [ Links ]
Wilson, P. J., C. M. Wood, J. N. Maina & B. N. White. 2000. Genetic structure of Lake Magadi tilapia populations. Journal of Fish Biology 56: 590–603. [ Links ]

