


 nueva página del texto (beta)
 Inglés (pdf)
 Artículo en XML
 Referencias del artículo
 Enviar artículo por email
 Citado por SciELO
  Similares en
SciELO
Similares en
SciELO 
 Permalink
Introduction
The importance of pollination
Pollination is one of the most important ecosystem services biodiversity offers to humankind. Worldwide, nearly 300 000 plants depend on pollinators for fertilization (Kearns et al., 1998; Ollerton et al., 2011), including about 1500 crops of great economic importance (Klein et al., 2007), representing 3% to 8% of global agricultural production (Aizen et al., 2009). In addition, more than three-quarters of the main crops used as food supply depend on the quantity and variety of pollinators (Intergovernmental Science-Policy Platform on Biodiversity and Ecosystem Services [IPBES], 2016).
The comparative advantage of insects with respect to other pollinators (i.e., small birds and bats) has driven the creation of a domesticated-insect market to improve pollination for economically important crops. This practice suggests there is a lack of wild pollinators to ensure adequate pollination for all demanded crops (Rader et al., 2013). In fact, the number of managed hives is rising due to the decrease (in terms of abundance and diversity) of wild pollinators (IPBES, 2016). Despite the importance of domesticated insect species (particularly the honeybee), existing evidence indicates that wild insect pollinators are more efficient and effective pollinators than managed bees, specifically Apidae melliphera, the most common domesticated pollinator (Garibaldi et al., 2013).
Regardless of the type of pollinator (wild or domesticated), the ecosystem service it provides largely depends on the condition and extent of its stock. Unfortunately, global and local studies contain significant evidence of a steady decline in the abundance and diversity of both managed and wild insect pollinators (Biesmeijer et al., 2006; Cameron et al., 2011; Potts et al., 2010; van Engelsdorp et al., 2008).
Although the absolute importance of pollination for food production is well known, the relative value of this ecosystem service in economic terms is not. Hence, an economic valuation would illustrate the link between pollinator abundance and crop yield, allowing for better understanding of the potential costs of continued insect pollinator decline in terms of food production and food security (Abson & Termansen, 2011). The economic value of pollination has both market and non-market components. Market-valued benefits of pollination include increased crop productivity. For instance, Gallai et al. (2009) attempted to estimate the total insect pollination economic value (IPEV), from the sum of the amount of the product produced, the quantity consumed, the dependence ratio of the crop on pollinators, and the local prices of each of the 100 most important crops worldwide. Their estimates yielded a value of 153 billion euro per year, equivalent to 9.5% of the value of world agricultural activity in 2005. Although their methodology is not robust enough because of the variability of crop prices over time and regions, as well as the absence of costs associated with the lack of pollinators (i.e., the use of domesticated-pollinators), the effort highlights the enormous value of this ecosystem service (Hanley et al., 2015). More recent estimates suggest that crop pollination was valued at USD 361 billion worldwide for 2009 (Lautenbach et al., 2012).
Regarding food security, Gallai et al. (2009) also defined the ratio between IPEV and the total economic value of crops as a measure of the economic vulnerability of each crop to pollination loss. The most relevant result in terms of food security is that three of the four most widely consumed types of crops worldwide (fruits, vegetables, and nuts) demonstrate the greatest vulnerability. This means that long-term pollination loss could drive up the price of nutritional crops, thereby exacerbating poverty and health issues.
In short, both well-being and the economic impacts of decreasing pollinator populations can have a profound adverse impact on society. Although the reliability of economic valuations remains questionable (Hanley et al., 2015), and other non-market benefits (such as conservation, aesthetic, and cultural values of insects per se and plants that require pollination to survive) have not been included in the valuation (Hanley et al., 2015; Lautenbach et al., 2012); these approximations give some idea of the scope of the unrecognized economic importance of pollinators.
The importance of avocado
Approximately 72 countries harvested avocado in 2016, among which Mexico was the leading producer. This crop went from accounting for 5.07% of the total value of the entire Mexican crop production in 2015 to 7.3% in 2019. Moreover, even though the total cropping area fell by 6.9% during this period, the area assigned for avocado increased by 25% (Servicio de Información Alimentaria y Pesquera [SIAP], 2015, 2019). According to data from the National Ministry of Agriculture and Rural Development, to cover the total demand for avocado for exportation to the United States in 2020, approximately 26 234 producers and 60 packers were involved, which generated approximately 310 000 direct and 78 indirect jobs, mostly in the state of Michoacan (Ministry of Agriculture and Rural Development, 20201).
Although avocado is cultivated in 28 states in Mexico, Michoacan is the state that contributes the most to national avocado production, accounting for 78.19% of the total amount (Loza, 2015; SIAP, 2017). This state is home to suitable ecosystems for the development of this crop. Pine-oak forests and oak forests provide ideal year-round weather, soil, and humidity conditions for growing high quality avocado. This has also led to a series of environmental problems (such as water contamination, biodiversity loss, and soil fertility depletion) in the area related to high deforestation rates and the chemicals used to optimize and accelerate the crop growing process (Alarcón-Cháires, 2020).
Given the importance of this crop for the Mexican agricultural industry, the main purpose of the study is to estimate the effect of the pollination service provided by the natural areas adjacent to avocado crop areas in Michoacan, Mexico. The effect is estimated by measuring the change in avocado crop productivity as the abundance of pollinators coming from neighboring natural areas changes. This change in productivity is extended to an economic value to provide an economic estimate of the environmental service.
The estimate is important for at least three reasons: 1) It reveals the effect of the ecosystem service known as pollination. Such service often goes unnoticed because of their indirect impact on the economy. 2) It proves that natural habitat conservation is cost-effective because it provides benefits to crop production. 3) From the Public Policy perspective, the estimate can be used to develop a market-based conservation instrument.
Materials and Methods
Study area
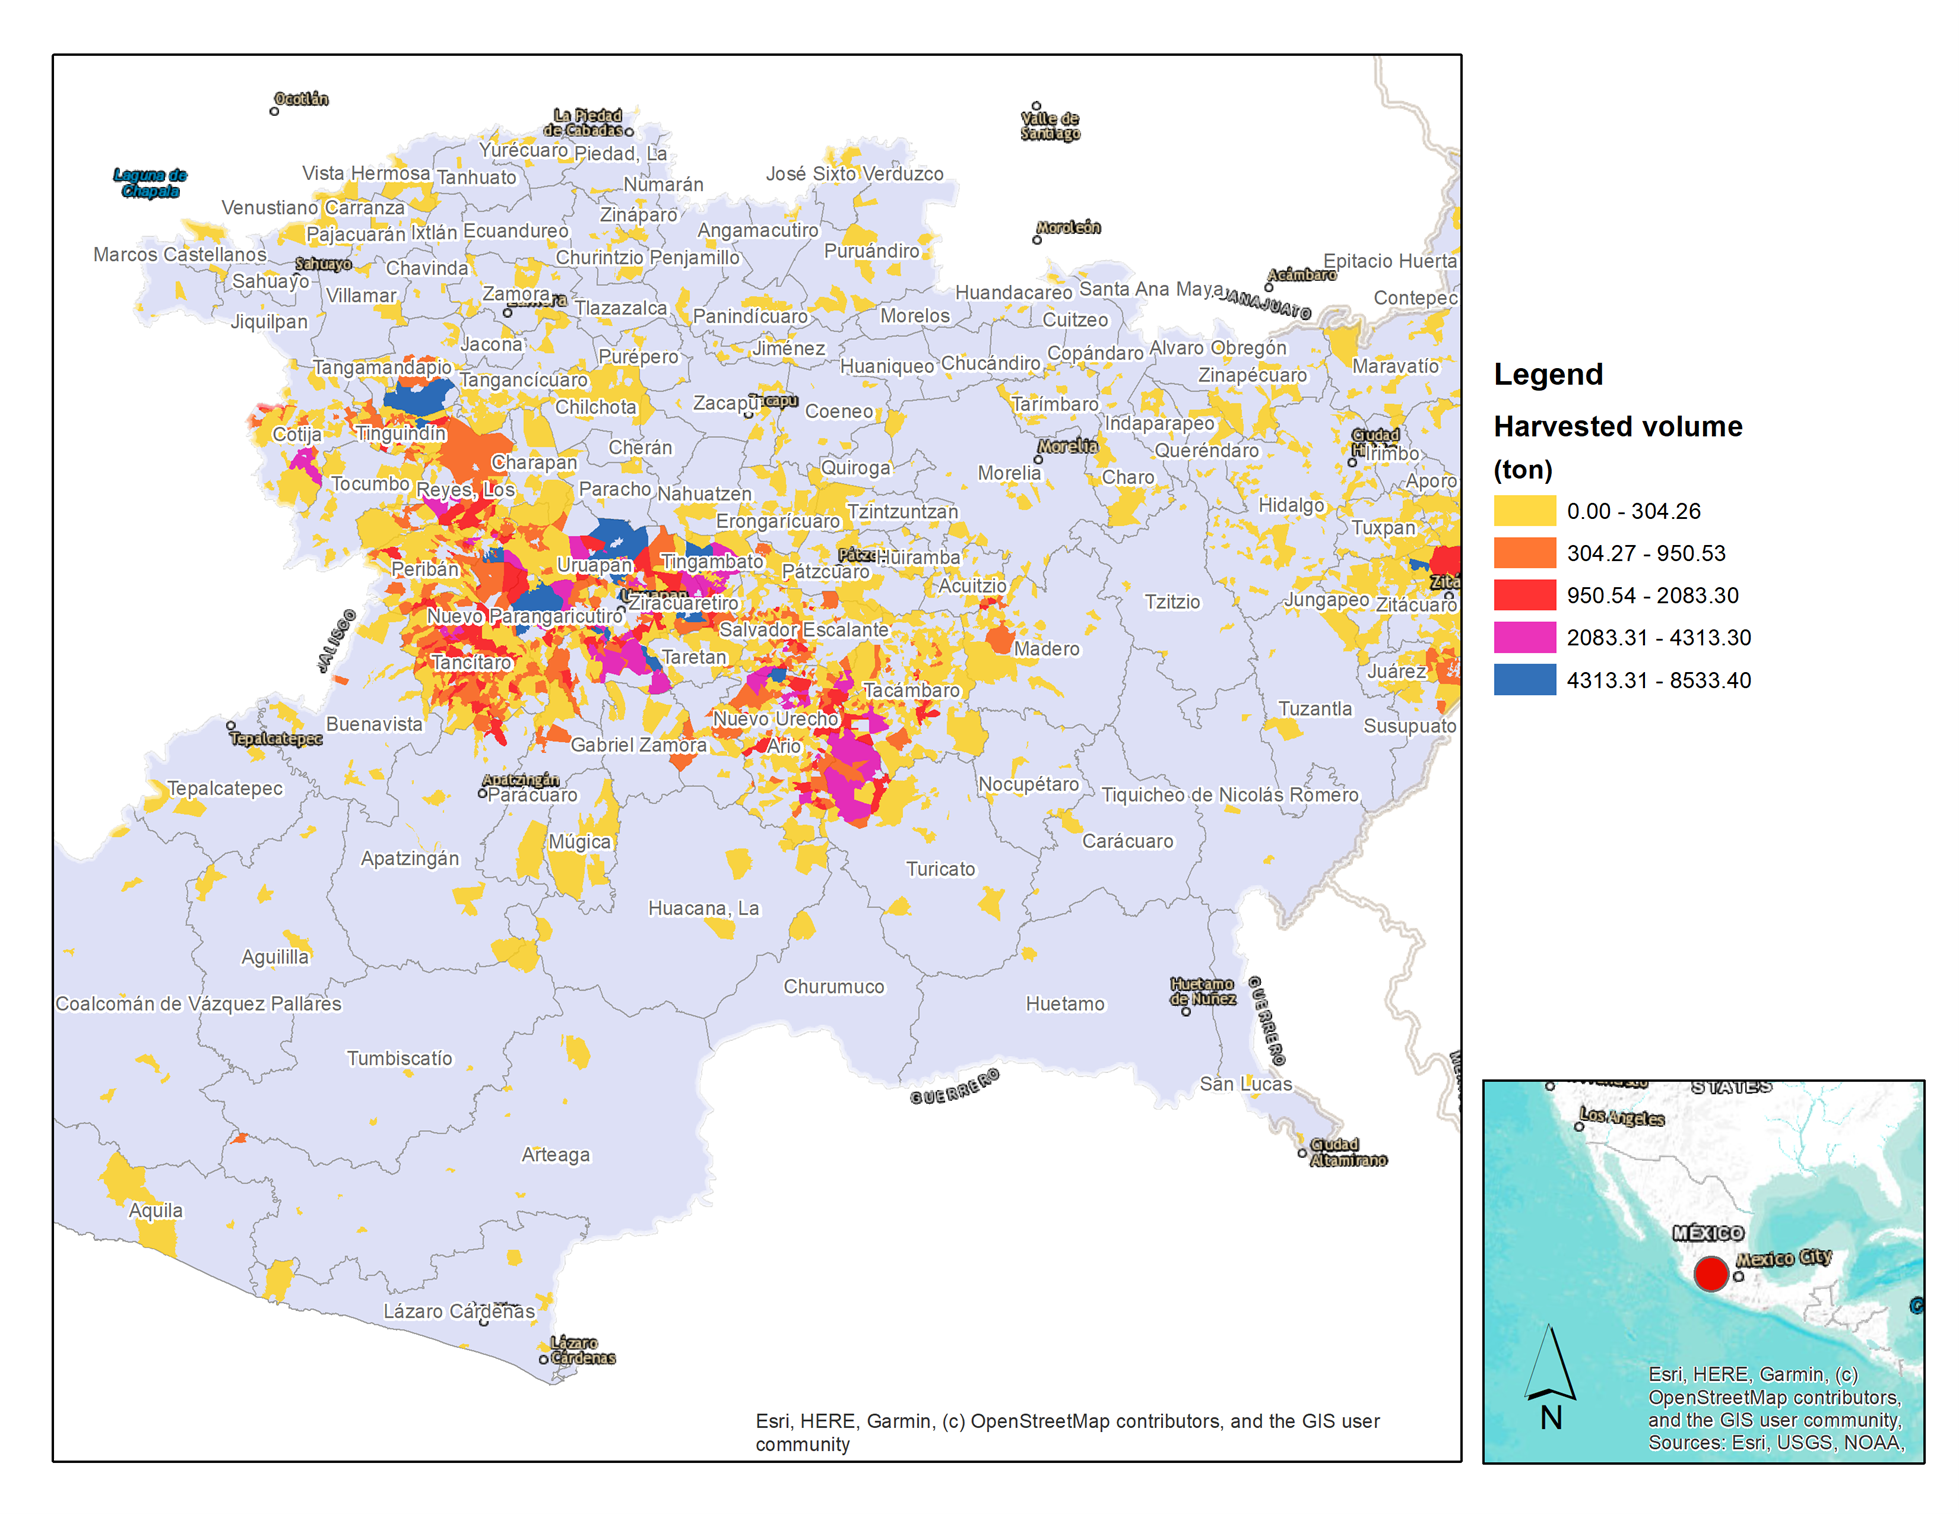
In the State of Michoacan (Figure 1), avocado plantations are distributed throughout the physiographic province of the Transversal Volcanic System, known as the “avocado-producing belt of Michoacan”, which occupies nearly 7752 km2, equivalent to 13.5% of the area of the state (Figure 2). It comprises various vegetation types, namely: Pine forests, broad-leaved forests, pine-oak forests, dry tropical forest, and deciduous and subdeciduous forests (Instituto Nacional de Estadística y Geografía [INEGI], 2017; Valderrama-Landeros et al., 2014). It ranges between 1100 m.a.s.l. (meters above sea level) and 2900 m.a.s.l., and it has seven soil types, 10 different climates, a mean temperature of 16 °C to24 °C, annual rainfall of between 800 mm and 1500 mm, and an average relative humidity of 90% (Gutiérrez-Contreras et al., 2010).

Avocado is of great socioeconomic importance in Michoacan, because a wide range of participants in the production chain, such as producers, traders, industrialists, and agro-input sellers benefit from this fruit market (Téliz-Ortiz & Marroquín-Pimentel, 2007). In fact, considering employment alone, every 10 ha of avocado cultivation requires an average of 1.5 full-time workers (Sánchez et al., 2001).
Modelling approach
The methodological approach consisted of three stages. In a first stage, the area under avocado cultivation in the State of Michoacan was delimited. In addition, information was mined from the agricultural census (INEGI, 2007) on production levels and production inputs used in each of the census units (control area) for the avocado region. The purpose of collecting this information was to develop an avocado production function to estimate the average yield of the crop from the inputs used in each control area, including climatic variables. In a second stage, an index was estimated to approximate the spatial abundance of domesticated and wild pollinators in avocado production regions relative to their distance from natural areas. To do this, the methodology and models of the InVEST platform (https://naturalcapitalproject.stanford.edu/software/invest) were used, modifying the parameters of the model according to the information available for the study region. Finally, in a third stage, the abundance index was integrated into the production function to estimate the effect of pollination on the avocado yield. Further detail of each one of these stages is provided below.
Data base
Information on avocado production, as well as the inputs used by diverse production systems applied in Michoacan, was mined from the Agricultural Census (INEGI, 2007) to form the data base. The information was grouped by “control areas” (census unit for the Agricultural Census), which represents the observation unit. The cartographic dataset of each one of these areas is also available from INEGI (2007). Thus, it was possible to add other relevant data such as the vegetation types (INEGI, 2017) and climatic indexes to the data base (CONABIO, 1998).
Estimates of pollinator supply and abundance
Modeling the size of pollinators populations and their habits related to pollinations is a complex modeling task. For that purpose, the InVEST software, designed by the Natural Capital Project at Stanford University, was used. The software estimates an abundance index of pollinators in natural areas using two sets of variables (Sharp et al., 2014): 1) a list of pollinators whose abundance and characteristics (species, average flight distance, nesting sites, etc.) are estimated from references and databases available in the system itself and 2) the vegetation cover and the characteristics of this cover in the area where pollinators are located, variables which affect the pollinators populations and their habits. The InVEST pollination model has been widely used for assessing pollination services, since it focuses on the resource needs and flight behaviors of wild bees. The model assumes that in order for bees to survive in a landscape and, therefore, to efficiently pollinate nearby crops, they need two basic resources: suitable nest sites and food supply (floral resources), both variables directly related with the type of vegetation. The model first estimates a pollinator supply index, which is an indicator of where pollinators originate in the landscape, using information on the availability of nest sites and floral resources within bee flight ranges. Such an estimate is automatically made by the system when a vegetation type is selected.
Floral resources in spots (represented by cells or pixels of a map in the software) near nesting sites receive more weight than distant ones, according to the species’ average foraging range. The model then calculates a pollinator abundance index, an indicator of where pollinators are active (to pollinate) in the landscape. Pollinator abundance is based on the pollinator supply index and floral resources, foraging activity, and flight range information. Following Sharp et al. (2018), the pollinator abundance index for species s on cell x, during season j, PA(s,x,j), is estimated as the product of available floral resources on a cell during a given season, weighted by pollinator’s relative activity during that season and normalized by the floral resource index in surrounding cells such that:
Equation 1. Pollinator abundance index2.
where l(x) is the land cover type at pixelx, jis the season, RA(l,j) is the index of relative abundance of floral resources on land cover l during seasonj, PS(x,s) is the pollinator supply index at pixelxfor speciess, fa(s,j) is the relative foraging activity for pollinator speciessduring seasonj, D(x,x') is the Euclidean distance between cellsxandx', and αs is the expected foraging distance for pollinator s.
The pollinator supply index (PS(x,s)), as mentioned before, is a function of the available floral resources in the area and a measure of how suitable these resources are for nesting, as well as the relative abundance of these species since they compete for resources.
Equation 2. Pollinator supply index 2.
where FR(x,s) is the accessible floral resources index at pixel x for species s, HN(x,s) is the habitat nesting suitability at pixel x for species s, and sa(s) is the relative abundance index for species s. The sum of all indices for all species is equal to 1.
Resource availability is measured as the number of free floral resources in a certain area, which depends on the relative abundance of pollinators, the relative abundance of these resources, and the expected distance between each pollinator and the nest.
Equation 3. Floral resource index 2.
where D(x,x’) is the Euclidean distance between pixel x and x’, αs is the expected foraging distance for pollinator s, RA(l(x’),j) is an index of relative abundance of landcover l during season j, and fa(s,j) is the relative foraging activity for pollinator species 𝑠 during season 𝑗.
Finally, nesting suitability is a function of the nesting preferences of the pollinator studied and the relative abundance of each type of nest.
Equation 4. Nesting suitability index 2.
where N(l(x),n) is the nesting substrate index for landcover type l for substrate type n and Ns(s,n) is the nesting suitability preference for species 𝑠 in nesting type n.
To create the pollinator abundance index for Michoacan with InVest, a selection was made of wild pollinators whose presence was documented by Ish-Am et al. (1999) in Michocan3. Pollinator parameters (Table 1) were obtained from Michener (2013), Ravelo et al. (2014), and Roubik (2006), who estimated those parameters for pollinators populations living in habitats close to those found in Michoacan.
Table 1 Pollinator parameters used to estimate abundance.
| Type of pollinator |
Nesting suitability | Foraging activity | Alpha (flight range meters) |
Relative abundance |
||
| Cavity index | Ground index | Spring index | Summer index | |||
| Wild | 0 | 1 | 0.5 | 0.5 | 500 | 1 |
| Domesticated | 1 | 1 | 0.5 | 0.5 | 1,500 | 1 |
Source: Authors’ own elaboration with information from Michener (2013), Pimentel et al. (2014), and Roubik (2006).
The area of avocado plantation and the surrounding vegetations was estimated throughout geographic information systems (GIS), following the Chen et al. (2015) methodology (Table 2).
Table 2 Estimated vegetation parameters at study site.
| Land cover | Nesting cavity availability index |
Nesting ground availability index |
Spring floral resource index |
Summer floral resource index |
| Cultivated land | 0.5 | 0.4 | 0.7 | 0.5 |
| Forest | 0.3 | 0.2 | 0.7 | 0.5 |
| Grasslands | 0.3 | 0.2 | 0.7 | 0.5 |
| Shrublands | 0.3 | 0.2 | 0.7 | 0.5 |
| Wetlands | 0 | 0 | 0 | 0 |
| Water bodies | 0 | 0 | 0 | 0 |
| Artificial Surface | 0.1 | 0.1 | 0.1 | 0.1 |
| Barelands | 0.1 | 0.1 | 0.1 | 0.1 |
Source: Authors’ own elaboration with information from Chen et al. (2015).
The estimates used for wild and domesticated pollinator abundance index are given in the following figures.
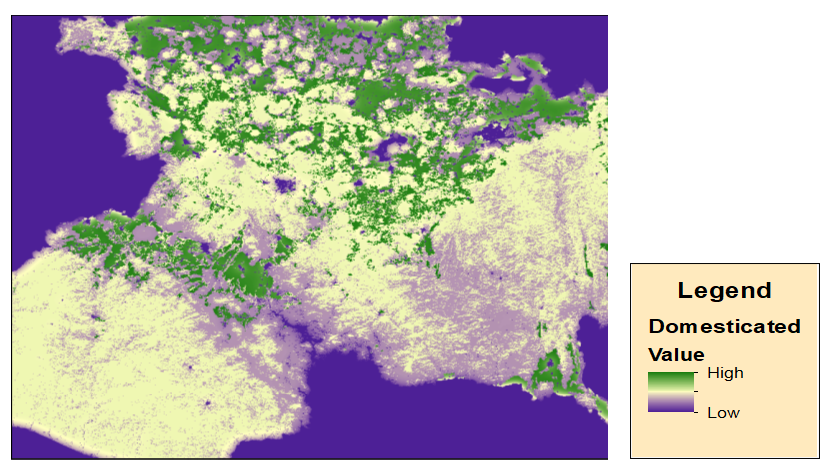
Source: Compiled by authors.
Figure 3A Distribution of Apidae melliphera abundance index in Michoacan, Mexico.

Evaluation of the effect of pollinators in avocado production
Through data from the Agricultural, Livestock and Forestry Census 2007, undertaken by the INEGI (2007), information on avocado yield characteristics at a control area level was obtained4. Using this information and the pollinator abundance index extrapolated at control area level, the following regression model was used to estimate the contribution of the bee pollinator community to avocado production. The model is based on previous findings of a positive causal effect between pollinators and crop growth. Harvested volume is measured as a function of the estimated pollinator abundance index and a set of characteristics of the area.
Equation 5.
where harvest represents the harvested avocado volume by control area, index is the pollinator abundance index obtained from InVEST, and X is a vector of control area characteristics associated with the avocado productions system, namely: land tenure, cultivated area, chemical fertilized area, organic cultivated area, area with herbicides applied, area with chemical insecticides applied, fruit packing facility (dummy), and biological pest control (dummy). Socioeconomic variables were not included as the territorial structure of the control area does not match the territorial structure of the socioeconomic data source.
Results
Descriptive statistics
Descriptive statistics of the variables are presented in Table 3. Most plantations are small and distributed within a tiny range of geographic and climate conditions. Mean elevation is 1904.18 m.a.s.l., which is to be expected since the optimal elevation range for avocados to develop is between 800 m.a.s.l. and 2500 m.a.s.l., although the range encompasses 7.69 m.a.s.l. to 3298.59 m.a.s.l. Temperature variations are low (2.53 ºC), while the mean temperature is 17.89 ºC, a suitable temperature for avocado cultivation. The land ownership distribution sample indicates that most of the land is privately owned. As mentioned earlier, the average planted surface is small (27.95 ha), 4% of which is organic, while the rest has received some form of chemical treatment. Finally, only 3% of the producers had packing facilities, and 55% received biological pest control. The sample therefore presents a set of small producers with a medium level of technification, who use chemicals to protect their crops and enjoy advantageous avocado growing conditions. Finally, the average age for plantations is reported to be 18.57 years, considering the age from the last rejuvenating thinning (Association of Avocado Producers and Packers in Mexico [APEAM], 2019).
Table 3 Descriptive statistics of data used in the model.
| Variable | Mean | S.D. | Min | Max | Unit | Type | Description |
| Harvested volume | 279.46 | 707.32 | 0 | 8533.45 | Cubic meters | Numeric | Harvested volume |
| Elevation | 1904.18 | 463.57 | 7.69 | 3298.59 | Meters above sea level | Numeric | Average elevation |
| Temperature | 17.89 | 2.53 | 10.52 | 28.52 | ºC | Numeric | Average annual temperature |
| Precipitation | 972.94 | 103.77 | 683.79 | 1293.12 | mm | Numeric | Average annual precipitation |
| Communal land | 20.29 | 153.48 | 0 | 5874 | Hectares | Numeric | Communal land area |
| Private land | 84.18 | 355.05 | 0 | 6901.7 | Hectares | Numeric | Private land area |
| Planted area | 27.95 | 71.12 | 0.001 | 1407.5 | Hectares | Numeric | Planted area |
| Chemical fertilizer area |
60.18 | 144.93 | 0 | 3495.6 | Hectares | Numeric | Area with chemical fertilizers applied |
| Organic cultivated area |
7.43 | 35.05 | 0 | 975.4 | Hectares | Numeric | Organic cultivated area |
| Chemical herbicide area |
28.88 | 101.5 | 0 | 3271.8 | Hectares | Numeric | Area with chemical herbicides applied |
| Chemical insecticide area |
25.41 | 100.41 | 0 | 3563.22 | Hectares | Numeric | Area with chemical insecticides |
| Packaging facility | 0.03 | 0.18 | 0 | 1 | NA | Categoric | Has packaging facility |
| Biological pest control |
0.55 | 0.50 | 0 | 1 | NA | Categoric | Biological pest control |
| Wild pollinators | 0.64 | 0.27 | 0 | 1 | Abundance | Numeric | Wild pollinator index |
| Domesticated pollinators |
0.64 | 0.17 | 0 | 1 | Abundance | Numeric | Domesticated pollinator index |
Source: Authors’ own elaboration.
Effect of pollinators on avocado production
Estimates of the pollinator abundance index for two kinds of pollinators, that is, wild pollinators (which include the families Halictidae, Vespidae, Syrphidae, and Calliphoridae) and domesticated pollinators (Apidae melliphera), were used. The analysis was undertaken using four different specifications based on equation 2. The first includes both the set of wild pollinators and the domesticated one in a linear specification. The second includes not only the two types of pollinators but also the interaction of both, the third includes only wild pollinators, and the fourth includes only domesticated pollinators (Apidae melliphera). The aim of these specifications was to test the relationship between the two types of pollinators and to identify the effect of each type separately on harvested volume. Indices were standardized between 0 and 1 to allow for a sensitive interpretation.5 The results are shown in Table 4.
Table 4 Estimates and goodness of fit for tested models.
| Variable | Model 1 (Wild + domesticated) |
Model 2 (Wild + domesticated & Wild * domesticated) |
Model 2 (Wild * domesticated) |
Model 3 (Wild) |
Model 4 (Domesticated) |
| Ln(Altitude) | 0.2658** (0.1186) |
0.2677** (0.1186) |
0.2788** (0.1186) |
0.2881** (0.1184) |
0.2894** (0.1180) |
| Ln(Temperature) | 1.9317*** (0.3325) |
1.9131*** (0.333) |
1.9014*** (0.3311) |
1.9236*** (0.3328) |
1.9973*** (0.3308) |
| Ln(Precipitation) | 1.0646*** (0.2556) |
1.0915*** (0.2572) |
1.1273*** (0.2564) |
1.1942*** (0.2502) |
1.2231*** (0.2417) |
| Ln(Common property area) |
-0.00003 (0.0161) |
-0.0005 (0.0161) |
-0.0014 (0.0161) |
-0.0018 (0.0161) |
-0.0008 (0.0161) |
| Ln(Private property area) |
-0.0630*** (0.0135) |
-0.0636*** (0.0135) |
-0.0654*** (0.0134) |
-0.0657*** (0.0135) |
-0.0635*** (0.0315) |
| Ln(Planted property area) |
1.4923*** (0.0211) |
1.4944*** (0.0212) |
1.509*** (0.0212) |
1.5007*** (0.0208) |
1.5021*** (0.0205) |
| Ln(Chemical fertilized area) |
-0.0579** (0.0229) |
-0.0564** (0.0230) |
-0.0575** (0.0228) |
-0.0595** (0.0229) |
-0.0639*** (0.0227) |
| Ln(Organic production area) |
-0.0838*** (0.0209) |
-0.0835*** (0.0209) |
-0.0830*** (0.0209) |
-0.0831*** (0.0209) |
-0.0844 (0.0209) |
| Ln(Area with chemical herbicides applied) |
-0.0111 (0.0229) |
-0.0111 (0.0229) |
-0.0082 (0.0229) |
-0.0831 (0.0228) |
-0.0101 (0.0229) |
| Ln(Area with chemical insecticides applied) |
-0.02146 (0.0212) |
-0.0218 (0.0212) |
-0.0239 (0.0212) |
-0.0235 (0.0212) |
-0.0204 (0.0212) |
| Fruit packing facility | 0.1139 (0.1187) |
0.1144 (0.1187) |
0.1064 (0.1187) |
0.1060 (0.1188) |
0.1116 (0.1188) |
| Biological pest control |
-0.0088 (0.0496) |
-0.0085 (0.0496) |
-0.0103 (0.0496) |
-0.0125 (0.0496) |
-0.0149 (0.0494) |
| Wild pollinators index |
0.2283* (0.1205) |
0.6414 (0.4564) |
0.0304 (0.0887) |
||
| Domesticated pollinators index |
0.4363** (0.1799) |
0.7060** (0.3392) |
0.2052 (0.1324) |
||
| Wild x domesticated index |
-0.7101 (0.7568) |
0.1983 (0.1907) |
|||
| Constant | -14.2949*** (2.7015) |
-14.6146*** (0.7568) |
-14.3894 *** (2.7199) |
-14.9287*** (2.6914) |
-15.458*** (2.6322) |
| R2 | 0.7943 | 0.7943 | 0.7939 | 0.7938 | 0.7938 |
| Adjusted R2 | 0.7931 | 0.7931 | 0.7928 | 0.7927 | 0.7927 |
| Number of observations |
2,518 | 2,518 | 2,518 | 2,518 | 2,518 |
| Prob > F | 0.0000 | 0.0000 | 0.0000 | 0.0000 | 0.0000 |
* significant at 90%; ** significant at 95%; *** significant at 99%. Standard error in parenthesis.
Source: Authors’ own elaboration.
Results show that, as expected, the greater the area planted, the greater the harvested volume. As for the chemically fertilized area, the coefficient indicates a negative relationship with the harvested volume. This result may seem counterintuitive since fertilization is intended to increase soil and plant productivity, yet old plantations tend to show diminishing returns. In other words, overexposure to chemical fertilizers becomes counterproductive in the long run. Since an avocado tree has a productive lifetime of 25 years, or even longer in favorable conditions (Dorantes et al., 2004), the adverse effects of chemical overexposure can be observed during the lifespan of plantations. In areas where organic production is more widely adopted, volume yield decreases, which is also congruent with the theory since organic techniques follow the natural production trends of crops, which are usually lower than chemically overexploited crops. An interesting result emerges regarding yields in common versus private ownerships; output decreases in the latter. Although one might expect the opposite, community management would appear to be better in large common areas, where economies of scale emerge as well. In addition, given the conditions required for avocado to optimally develop, a higher elevation, temperature and precipitation have a positive effect on harvested volume. No effect was found from the following factors: the presence of a fruit packaging facility, the application of chemical insecticides and chemical herbicides and biological pest control.
Regarding our variables of interest (Table 4), it was found a positive, significant effect of pollinator variables on harvested volume. This effect appears to be greater for domesticated than wild species. However, if either only domesticated or only wild species are present, the effect is lost. In other words, it was found significant synergy between wild and domesticated pollinators as previously reported (Pérez-Balam et al., 2012). Moreover, it was found that when both types of pollinators are present in the territory (Table 4: Model 1), avocado yield increases by 77% (+/- 59%) in areas with the maximum presence of domesticated and wild pollinators. Although this magnitude may seem relatively high, the asymmetry in the distribution of pollinator abundance indices must be considered as it affects the mean yield in the control units. If we consider an area where the abundance of domesticated pollinators is close to the mean, the harvested volume of avocado is 28% (+/- 23%) greater (28% is the result of multiplying the coefficient of domesticated pollinators, equal to 0.44, by the mean of the domesticated pollinators index, equal to 0.64), which reflects the pollinators mean effect regardless the likely variation in the abundance index due to uncertainties in the parameters used to estimate it. Regarding wild pollinators, when they are at the mean level, harvested volume increases by 15% (+/- 15%). These results show that wild and domesticated pollinators complement each other, which has significant technical and policy implications.
Discussion
Despite that a linear production function was used, the avocado yield estimates obtained are in the same range of goodness of fit than those reported estimates from other authors, as they explain a bit more than 75% of the observed variance (Li et al., 2018; Lobell et al., 2007; Rincon-Patino et al., 2018). In the same order of ideas, results show that the most influential variables to predict avocado yield in Michoacan coincide with most yield reports, which indicate that climatic variables are the most determinant to predict avocado yield (Rincon-Patino et al., 2018). Authors suggest that the main reason is that climatic variables are correlated to processes such as crop infection, pollination, and dormancy, which have enormous effect on fruit formation, particularly for the case of avocado (Lobell et al., 2007).
Although there is a substantial body of evidence regarding the effect of pollinators on crop production, this is the first study of its kind in Mexico. Its main contribution is the estimate of the positive impact of pollinators on harvested avocado volume in Mexico. Such an impact can be extended in economic terms considering that the APEAM reported avocado exports to the United States generated USD 2.6 million yearly in 2017 (Estrada, 2017). Given that the presence of pollinators can increase avocado yield by up to 77%, the economic spillover from the conservation of crops adjacent to pollinators’ natural habitats could amount up to two million dollars (+/- 1.5 million dollars) a year. This study’s estimates for the value of pollination are twice (assuming the low limit of the interval) the value calculated by Lautenbach et al. (2012), which indicate that the average pollination value is close to 8.6% of the value of global agricultural production. However, this last figure can be considered an underestimation for the case of avocado since it considers the value of crops whose production does not depend on pollination.
In addition, given the inaccuracy of our data on pollinator abundance due to the lack of reliable sources, this study leaves the door open for further research on the individual effect of each type of pollinator. Specifically, since data on pollinator abundance are only illustrative, the estimated coefficients for the individual effect may not reflect the actual scope of their role in avocado crop productivity. Moreover, the lack of significance of these two variables (abundance of wild pollinators and abundance of domesticated pollinators) may be related to the number of pollinators rather than the type. In other words, when the abundance of pollinators is too low, they are unable to increase the harvested volume of avocado, regardless of their type.
The model therefore suggests that domesticated species are not sufficient to increase production, or at least, that avocado production increases more when both species co-exist. Given that the abundance of wild pollinators is a result of healthy natural ecosystems adjacent to farms, these findings indicate that markets for domesticated pollinators are only effective when a policy of ecosystem conservation is promoted. In this respect, Geldmann & González-Varo (2018) argue that an over-abundance of domesticated bees affects wild pollinators. Accordingly, a balance between the two types of pollinators is required.
These results have major policy implications since, although avocado production apparently competes with ecosystem preservation, these findings show that avocado productivity is -on the contrary- dependent on the conservation of ecosystems that host wild bee populations. Since these ecosystems have been depleted in the past by the expansion of avocado growing zones, assessing an optimal land-matrix of avocado crops and conserved ecosystems through integrated territorial agro-ecosystem planning could be a promising strategy.
The main limitations of this study are the absence of high-quality data on pollinator abundance in the area of study and the lack of field information on the range and type of pollinators. Regarding this first limitation, a taxonomic determination study and thorough species monitoring are required to properly record the abundance of the studied pollinators in the chosen areas and have a realistic estimate of this effect. However, it is believed that the model is statistically robust, and that results reflect a positive correlation between pollinators and avocado productivity (and moreover, that the effect could be considerably larger than these estimates). In addition, the results provide statistical evidence that the two types of pollinators are complementary; in other words, the presence of both types of pollinators is desirable in terms of productivity.
The root of these limitations is greatly related to the lack of additional research linked with a better understanding of the relationship between climatic variables and the processes of fruit formation. In addition, this article paves the way for new research topics, namely: Can we confirm these results for other crops? Does the economic contribution of wild pollinators outweigh the opportunity cost of land not given over to crop production? What is the optimal mix of crop production and natural ecosystems conservation? How do pesticides and herbicides affect wild and domesticated pollinator populations?
Conclusions
Avocado production is a polemic topic in Mexico. It is a crucial agricultural product for the country, yet it seems to compete with local ecosystem preservation. In Michoacan, this includes various types of deciduous and evergreen forests. It was found that a mix of conservation and production could be optimal. Given the fact that natural ecosystem deforestation and degradation pressures are pervasive when new farms are created to expand production of this crop, it might be likely to find better ways to produce more avocado without affecting ecosystems. An optimal mix of production and conservation could therefore be possible.
Conflict of interests
None of the authors has any conflict of interests.

