


 nova página do texto(beta)
 Inglês (pdf)
 Artigo em XML
 Referências do artigo
 Enviar este artigo por email
 Citado por SciELO
  Similares em
SciELO
Similares em
SciELO 
 Permalink
Introduction
In the past decades energy efficiency in residential buildings, along with educational and industrial buildings, has been studied by numerous authors, giving, as a result, a reduction of the energy demand due to the use of heating and cooling systems. Since the energy costs represent a significant fraction of the overall production expenditures during the life of a greenhouse, an important task to achieve is to analyze the potential savings in the building energy use. For instance, the use of heating and cooling, specialized lighting, ventilation, and environmental control such as preserving CO2 concentration increases the energy consumption in greenhouses regardless of the location (Food and Agriculture Organization [FAO], 2013).
A greenhouse building is a space designed to provide an appropriate microclimate for the optimum development of a plant or crop. Greenhouses are meant to provide high yields at low cost and high productivity in lesser time and low environmental damage (Jensen & Malter, 1995). Hence, from a technical perspective, in order to satisfy a greenhouse's requirements, suitable environment conditions where at least an adequate temperature, relative humidity, light, CO2 concentration, and ventilation need to be attended. In addition, today's energy efficiency demands need to consider not only minimum requirements, but also take into consideration a proper selection of the greenhouse cover material, adequate control of heating and cooling systems, efficient lighting and the incorporation of renewable energies (Valera, Molina & Álvarez, 2008).
Greenhouses are a fundamental complement to agricultural production because these transparent enclosures allow the growth of off-season crops, providing an artificial microclimate which allows a continuous production throughout the year. According to a report issued by the Instituto para la Diversificación y Ahorro de la Energía (IDAE), several considerations need to be considered in order to improve energy efficiency in greenhouses. Within the most relevant considerations are control of climatic conditions considering the local weather, plant needs, time of the year and physiological condition of the plant, cost-efficiency of construction, and needed equipment for climate control (Valera et al., 2008).
The FAO drives an intensive program on climate-smart agriculture. This program boosts sustainable agriculture, increasing resilience and productivity, including the mitigation of greenhouse emission gases apart from achieving food security and rural development (FAO, 2014). In this FAO report, the identified weak points of climate-smart agriculture are an absence of strategic planning and a high deficiency in logistics, transportation, automated production and, lastly, the most pertinent to this investigation: energy management. To conclude, qualified human resources, as well as applied technology, are notorious weaknesses found in the report, which analyzes agro-environmental policies in Brazil, Chile, Colombia, Mexico, and Nicaragua. McCartney & Lefsrud (2018) studied protected agriculture in tropical, polar, and urban conditions and concluded that there are several challenges regarding the implementation of efficient heating and cooling systems, accessibility of technologies, automation, and the efficient use of water resources.
The introduction of technology into greenhouses was mainly motivated by the specific climatologic conditions of some countries. Nowadays, protected agriculture present clear benefits when facing water shortage, plague, and adverse climatic conditions. In emerging nations, this sector is in a stage of accelerated growth. In developing countries, the greenhouse industry faces various difficulties such as misguided technology, technically deficient suppliers, inadequate financing and management, lack of trained professionals, misdirected government programs, among others (Nieves, Van der Valk & Elings, 2011).
Since temperature influences the growth and development of the plants, it is the main parameter to control inside greenhouses. To calculate the energetic needs of a greenhouse, maximum solar radiation availability, outdoor temperature, humidity, wind speed, and direction are important variables to consider. However, the outdoor temperature is one of the central parameters to examine. Nevertheless, conventional calculation approaches consider vague temperature values, for example: mean temperature of the hottest month, mean temperature of the daily maximums of the hottest month, annual maximum temperature, mean temperature of the coldest month, mean temperature of the daily minimums of the coldest month, annual minimum temperature, etcetera. These temperatures attempt to reflect the climatic conditions with maximum and minimum values. Nevertheless, this approach is no longer valid when trying to accomplish energy efficiency at its best, as the usage of such temperatures typically would result in the overestimation of energetic needs for the studied greenhouse.
During the past decades, several authors have investigated the influence of selecting different cover materials and their relation with energy consumption. Ali, Bournet, Danjou, Morille & Migeon (2014) performed a computational fluid dynamics (CFD) simulation along with a detailed sensitivity analysis in a 100 m2 Venlo shaped glasshouse to evaluate condensation during nighttime. Meanwhile, Piscia, Montero, Bailey & Mun (2013) proposed an optimization methodology to study how the cover properties affect the nighttime indoor climate at a 4-span and 235 m2 area greenhouse. The evaluated greenhouse's cover was polyethylene film; nonetheless, the optimization results suggest that a very reflective material should replace the conventional plastic materials to avoid thermal inversions for all meteorological conditions.
Alvarez-Sanchez, Leyva-Retureta, Portilla-Flores & López-Velázquez (2014) analyzed the annual performance of an asymmetric greenhouse near Mexico City using the simulation software Design Builder. The greenhouse has a 144 m2 area and has a cover of polycarbonate, and slatted blinds are used as a shading device. Fabrizio implemented energy reduction measures for heating in agricultural greenhouses constructed with polycarbonate hollow sheets and polypropylene sheets (Fabrizio, 2012). A 400m2 tunnel-shaped greenhouse is modeled within the Energy Plus software at two locations in the northwest region of Italy. The findings showed that the use of polycarbonate sheets is a low-cost solution that could decrease up to 30% of the heating requirements in such greenhouses.
Fidaros, Baxevanou, Bartzanas & Kittas (2010) carried out numerical analysis of a ventilated arc-shaped greenhouse during a sunny day through a CFD simulation. The authors focused on the analysis of the active photosynthetic radiation (PAR), a critical plant's growth parameter. Fitz-Rodriguez et al. (2010) implemented a dynamic simulation web tool; this tool was intended as an educational tool to demonstrate the complicated physics of greenhouses and its systems. The tool can evaluate the behavior of different shapes of greenhouses for periods of up to 28 hours in four cities in the United States.
Sethi (2009) carried out a study to find which greenhouse orientation and shape is better suited for receiving the most solar radiation in Punjab, India; four shapes were evaluated, keeping a fixed length, width, and height. As a result, the variation in total solar radiation availability and indoor temperature were presented, stating that the developed models are in good agreement with the measured parameters. Kumari, Tiwary & Sodha (2007) calculated the performance of three different shapes of 24 m2 greenhouses with equal floor and central height at five climatic locations in India. The study focused on finding the distribution of solar radiation using passive or active methods for its heating, concluding that the uneven span greenhouse is the best option. Semple, Lucas, Carriveau, Rupp & Thing (2017) performed a sensitivity analysis during January to analyze the impact of varying several parameters of the heating demand.
There are several analyses focused on climatic conditions, envelope materials, shape, and location. Several studies deepen into the inclusion and optimization of heating and cooling systems within greenhouses (Chou, Chua, Ho & Ooi, 2004; Ghoulem, El Moueddeb, Nehdi, Boukhanouf & Kaiser, 2019; Jain & Tiwari, 2002; Mistriotis, Bot, Picuno & Scarascia-Mugnozza, 1997; Mistriotis & Castellano, 2012; Panwar, Kaushik & Kothari, 2011). Ghoulem et al. (2019) emphasize the use of CFD at the design stage.
Furthermore, an analysis of a ventilated greenhouse (Mashonjowa, Ronsse, Milford & Pieters, 2013) studied the annual dynamic behavior of a rose crop in Zimbabwe through the Grembloux Dynamic Greenhouse Climate Model (GDGCM). Also, studies comprising experimental measurements (Çaylı & Akyüz, 2019; Gourdo et al., 2019; Kim, Kang, Moon, Lee & Oh, 2018), experimental and CFD simulations (Mesmoudi, Meguellati & Bournet, 2017; Molina-Aiz, Valera & Álvarez, 2004) can be found in the literature. Mesmoudi, Meguellati & Bournet (2017) focused on analyzing the detailed behavior of both the diurnal and nocturnal period for a semi-arid climate , whereas Molina-Aiz, Valera & Alvarez (2004) analyzed the impact of exterior wind speed on the indoor ventilation of an Almeria shaped greenhouse, stating that the ventilation openings should be oriented, so a uniform temperature and air velocity are directed towards the interior.
In the past decades, the modeling and simulation of greenhouses outlook have changed, where some of the energy balances and global analysis (Kimball, 1973) have opened research paths for new scientists.
In the previously mentioned literature review, it was found that studies of thermal behavior, sensitivity analysis, solar gains, etcetera, conducted in greenhouses are mainly carried out with the use of commercial software. Programs like, MATLAB and Borland C++ (Kumari et al., 2007), Design Builder (Alvarez-Sánchez et al., 2014), Energy Plus (Fabrizio, 2012), ANSYS FLOTRAN (Molina-Aiz et al., 2004) and ANSYS Fluent (Ali et al., 2014; Fidaros et al., 2010; Kittas & Bartzanas, 2007; Mesmoudi et al., 2017; Mistriotis, Arcidiacono, Picuno, Bot & Scarascia-Mugnozza, 1997; Piscia et al., 2013). Several techniques, such as: energy balance simulation (ES) (Piscia et al., 2013), CFD (Ali et al., 2014; Fidaros et al., 2010; Piscia et al., 2013), web-based tools (Fitz-Rodríguez et al., 2010), TRNSYS simulation software (Semple et al., 2017) and implementation of mathematical models into programming platforms (Kumari et al., 2007; Sethi, 2009).
In this analysis, a greenhouse's thermal behavior is analyzed through the dynamic simulations software TRNSYS 17, which allows a detailed transitory study throughout a typical year. The analysis of the parameters’ variation, like envelope materials and greenhouse shape, will allow the understanding of the global greenhouse operation. The results were obtained by modeling the greenhouse construction using numerical simulation. Moreover, this computational tool can help in the optimization and design of greenhouses considering its annual performance, instead of only specific temperatures throughout historical values. Hourly mean temperature graphs throughout a year are obtained, and annual energetic demand due to heating and cooling are presented.
This paper presents the process of the selection of the greenhouse shape and the cover material before the inclusion of renewable energies to provide the required energy input for its climatic control. The inclusion of low-cost renewable energies that are eligible for rural environments is an effort to contribute to the plan of substitution of fossil fuels in food production and the mitigation of climate change under FAO concepts on Energy-Smart Food Production (FAO, 2012).
Materials and methods
Location and climatic conditions
The modeled greenhouse is located within the BSk climate, according to the Köppen climate classification. The BSk climate differentiates itself from deserts due to its mean annual temperatures and precipitation, placed as an intermediate between a desert and humid climate (Rohli & Vega, 2012). Locations such as the Great Steppe (Eastern Europe and Central Asia), Anatolia in Turkey, the Pannonian Plain in Hungary, Patagonia in South America, and other smaller steppe areas like New Zeland, parts of the central United States, western Canada and the north of Mexico.
A climatic analysis for the region was performed, where: the weather data software Meteonorm 7 provided solar radiation, hourly mean temperatures, humidity, and wind speed. For this purpose, the format Typical Meteorological Year Format TMY was generated with the information on a 15-minutes interval. A typical meteorological year is the statistically representative meteorological information of a specific geographic location through a year. According to the TMY data, temperatures ranging from -3.8 °C to 35.3 °C can be found.
Figure 1 presents a reference to indicate the climatic suitability of the studied region Servicio Meteorologico Nacional - Comision Nacional del Agua-Centro de Investigacion Cientifica y de Educacion Superior de Ensenada [SMN-Conagua-CICESE], 2015). This figure is an adaptation of the graphs shown by Nisen et al. (1988) , where the estimation of the climatic suitability for the cultivation of warm species is represented with the monthly air temperature average and solar radiation. In the adapted graph, three sets of temperatures are shown: minimum, average, and maximum monthly temperatures to indicate the temperature variability in this region and stress the fact that the simplified approach of relying on an average monthly temperature could be a risky methodology.
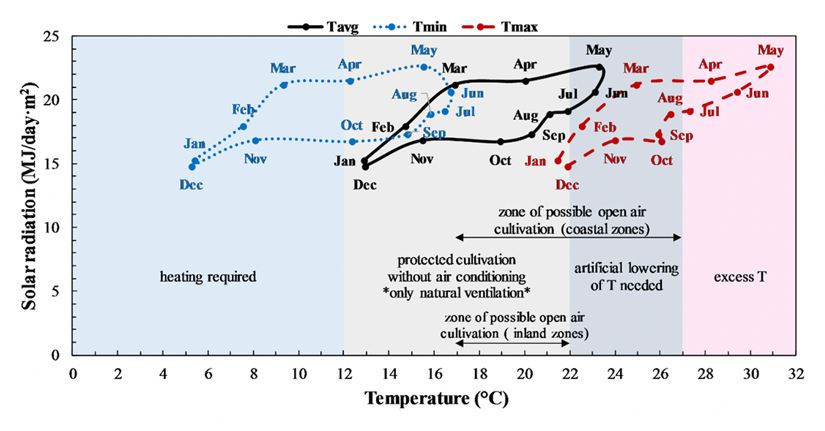
Source: Author’s own elaboration with weather data from Meteonorm V7.1.11.
Figure 1 Characteristic solar radiation versus air temperature from site. Adapted graph from Nisen et al. (1988) .
Greenhouse shape
This work shows the energy demand and hourly mean temperatures calculation of four different greenhouse’s geometries. Table 1 presents the dimensions and volume of each shape, whereas Figure 2 shows the analyzed greenhouse’s shapes: a) saw tooth, b) standard peak or chapel, c) single tunnel, and d) double tunnel. It is important to highlight that all of the modeled greenhouses have a sidewall inclination of 70 degrees with respect to the horizontal. This inclination was chosen due to the mean air velocity at the greenhouse location.
Table 1 Greenhouse’s dimensions and volume.
| Shape | Dimensions H x L x W (m) | Air volume (m3) | Area (m2) |
| a) Saw tooth | 3.5 x 18 x 10 | 528 | 182 |
| b) Standard peak or chapel | 4.0 x 18 x 10 | 488 | |
| c) Single tunnel | 4.2 x 18 x 10 | 541 | |
| d) Double tunnel | 4.0 x 18 x 10 | 532 |
Source: Author's own elaboration.

Thermal and optical properties of materials
The greenhouse cover materials evaluated were: polycarbonate (PC), low-density polyethylene (LDPE), polyvinyl chloride (PVC), and glass (GLASS). These materials are regionally and worldwide used; hence, they are representative of the current greenhouse construction materials market. In Table 2, the thermal and optical properties of the cover and structure are presented.
Table 2 Thermal and optical properties of the greenhouse materials.
| Material properties | PC | LDPE | PVC | GLASS |
| Thermal conductivity, k, (W/m(K) | 0.19 | 0.45 | 0.16 | 0.81 |
| Thickness, (mm) | 4.0 | 0.18 | 0.10 | 3.20 |
| Density, ρ, (kg/m3) | 0.18 | 0.91 | 1.30 | 0.88 |
| Emissivity, ε | 0.89 | 0.13 | 0.62 | 0.84 |
| Solar transmissivity, tsolar | 0.78 | 0.88 | 0.91 | 0.88 |
| Solar reflectivity, rsolar | 0.14 | 0.09 | 0.07 | 0.136 |
| Visible transmissivity, tvisible | 0.75 | 0.89 | 0.92 | 0.89 |
| Visible reflectivity, rvisible | 0.15 | 0.10 | 0.07 | 0.136 |
| U-value, (W/m2K) | 5.43 | 3.72 | 5.16 | 2.89 |
| Solar heat gain coefficient (SHGC) | 0.71 | 0.79 | 0.80 | 0.78 |
Source: Valera et al. (2008).
Dynamic simulation methodology
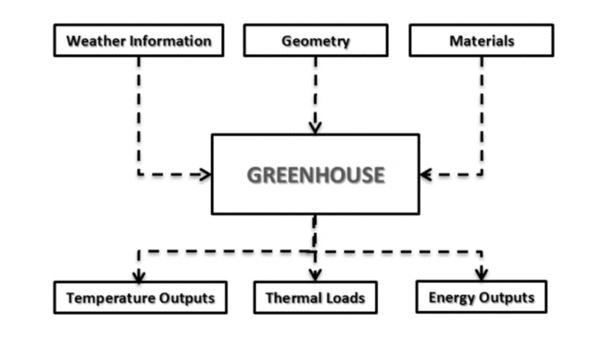
The agricultural industry can benefit from an efficient use of energy for cooling and heating, and from the implementation of solar technologies to heat and cool greenhouses placed in climates with these needs. It has been found that through dynamic simulations, various scenarios of a complete system can be investigated, including the calculation of conventional and renewable energy equipment with an error of less than 5% (Almeida, Amorim, Carvalho, Farinha & Lopes, 2012). Figure 3 presents the TRNSYS diagram of the implemented systems.
The building geometry was modeled using a SketchUp plugin for TRNSYS; then, through the TRNBuild interface, the thermal and optical properties of the materials were established. The use of the SketchUp program allows three-dimensional modeling of simple and complex geometries and its incorporation into the TRNSYS simulation studio. In the particular case of modeling a greenhouse, the properties of the glazing were specified through the Window software, where the particular thermal and optical properties can be stablished. Through type 56, a simplified air conditioning model was implemented; here the energy demand was calculated. The type simulates the operation of a simplified system, and it is based on the theoretical supposition that the energy requirement of heating and cooling would always be a function of the air node temperature.
The temperature control was set through the type 108 TRNSYS module, in which two different operation modes can be chosen; continuous control (through proportional input) and discrete control (on/off), where the latter was selected for this work. This operation mode compares the desired zone temperature to the calculated zone temperature (indoor temperature of the greenhouse). When the calculated temperature is below the control temperature, the heating system is activated, and energy is added to the zone, whereas, when the calculated temperature exceeds the control temperature, the cooling system will extract energy from the zone.
Figure 4 presents a graph of the power output versus temperature. Pi is the output power to the air node I, where a negative number means that heating is required, and a positive number is required for cooling. Pmax is the maximum power for air node I, and Tset,i, is the set temperature for heating or cooling of the air node I. This information is used to calculate the total energy required to keep the temperature within the desired comfort range. The temperature range was set so the greenhouse's indoor temperature is controlled between 15 °C and 30 °C. This greenhouse was designed for educational and research purposes, so an intensive crop or plant production is not the main intention.
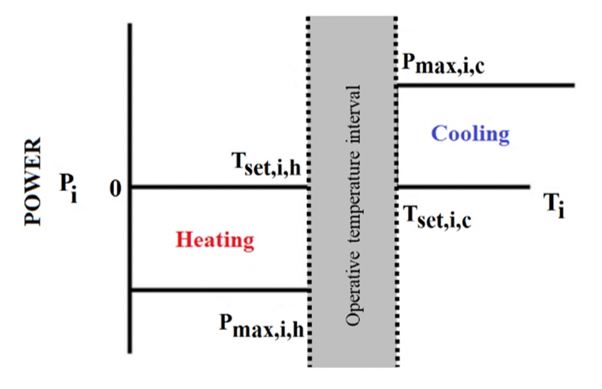
Source: TRNSYS Manual (TRNSYS 17, 2010).
Figure 4 Operation logic of simplified air conditioning system in TRNSYS. Modified from TRNSYS Documentation.
Results
An hourly annual simulation was made; as a result, the energetic demand of four different shapes of greenhouses built with four different common envelope materials was obtained. Figure 1 and Table 1 show the schematic representation of the evaluated greenhouses and dimensions, whereas the thermal and optical properties are contained in Table 2.
Figure 5 shows the thermal performance of hourly mean temperatures of the greenhouses with and without air conditioning during a typical year. The colored lines outside the comfort range (15 °C to 30°C) of each graph can be interpreted as the periods when heating or cooling is needed. This heating demand will be later interpreted as fuel demand and, thus, its inherent cost, which will be represented as an operative cost through the greenhouse’s lifespan. The mean and minimum temperatures in figure 5 (Tmean and Tmin) show differences of 0.16 °C and 0.15 °C, respectively, while the differences of Tmax are up to 1.0 °C.
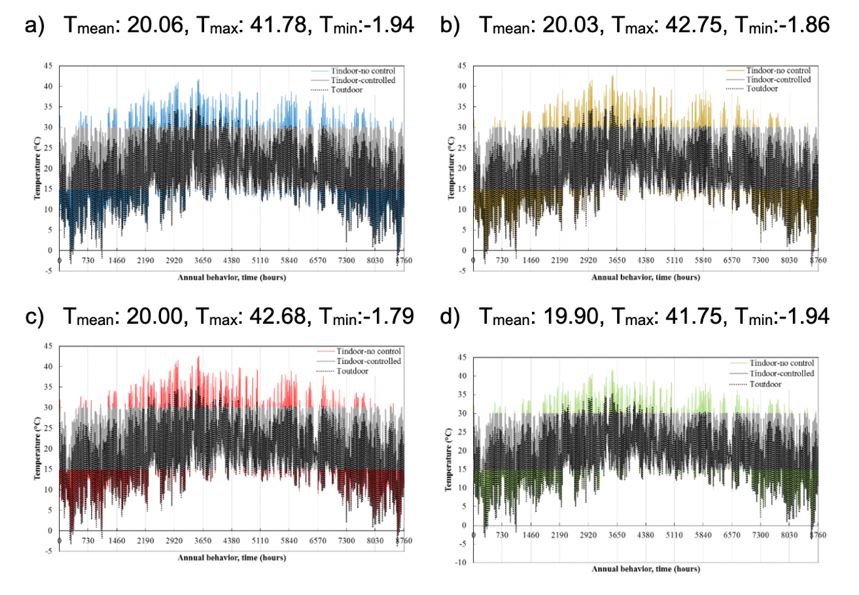
Source: Author's own elaboration.
Figure 5 Graph showing hourly mean temperature during a year for the evaluated greenhouse shapes: a) Sawtooth, b) Standard peak or chapel, c) Single tunnel and d) Double tunnel.
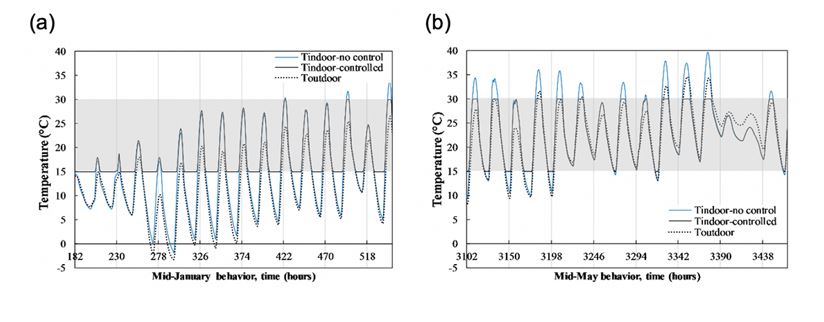
Figure 6 presents the detail of the saw tooth greenhouse with an envelope of LDPE. Here, the variation of the indoor temperatures when the greenhouse has climate control vs. no control evidence that there are significant temperature differences inside the greenhouse. As a result, this would mistakenly calculate the dimension of the air conditioning equipment and thus mislead the estimation of the energy consumption for each greenhouse configuration.
Source: Author's own elaboration.
Figure 6 Detail of air conditioning (heating and cooling) control during consumption peak times (Sawtooth greenhouse) a) Mid-January behavior and b) Mid-May behavior.
Predicted energy consumption in different shapes of greenhouses
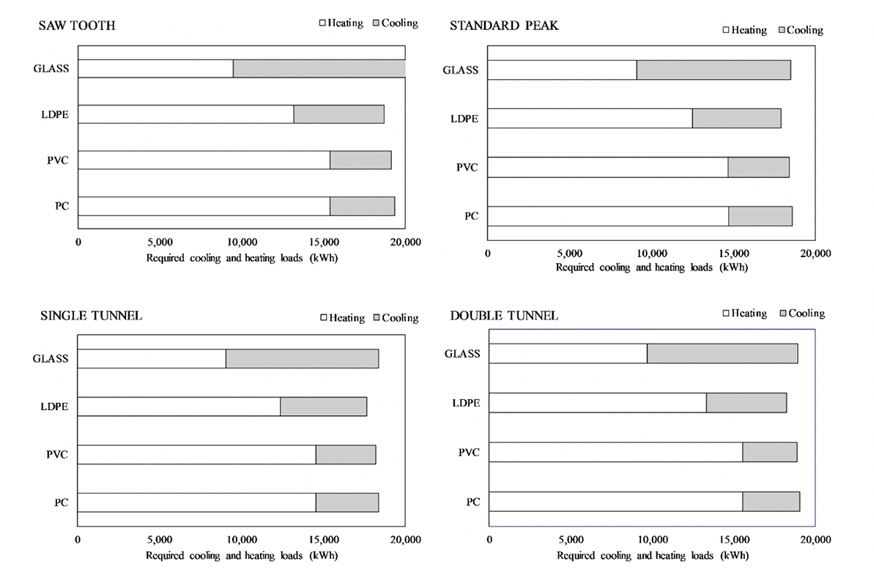
Figure 7 displays the annual energy consumption of the greenhouses, classified by shape so that the suitable cover material can be found. For all different greenhouse shapes, the cover material which would consume less energy for heating is the glass-covered greenhouse; nevertheless, when looking at the overall annual energy consumption, the LDPE covered greenhouse needs less energy to operate within the set temperature range (15 °C-30 °C). Also, the LDPE covered greenhouse would consume an average of 14.5% less energy for heating purposes compared to the PC and PVC covered greenhouses; even when it will consume more energy for cooling, it will consume an average of 3.8% less energy in an annual basis.
Predicted energy consumption due to the use of different cover materials
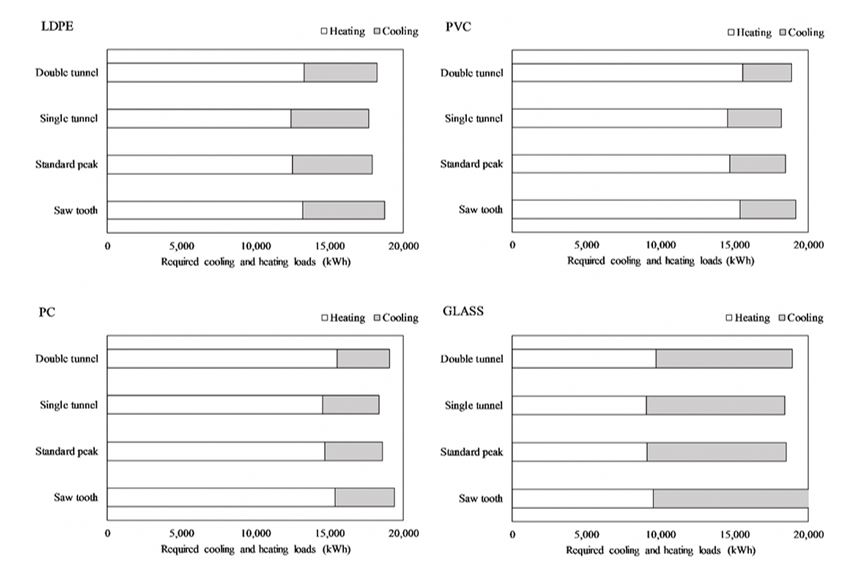
Figure 8 presents a similar analysis to that in figure 7; here, the annual energy consumption of the greenhouses classified by material is shown. This breakdown demonstrates the influence of the greenhouse shape. The single tunnel-shaped greenhouse needs less energy when built with LDPE, PVC, and PC. These cases show a reduction in the heating and cooling loads of up to 6% and 4%, respectively, compared with the sawtooth-shaped greenhouse.
Economic Analysis
It is possible to design several systems that would deliver an expected service; nevertheless, the investment, maintenance, and operation costs of every design will vary from one design to another. The investment cost considers installation and materials costs, including the structure and different covers for each different greenhouse shape. The total cost includes the maintenance and operation expenses, where the operation cost is affected directly by the amount of energy used to power the air conditioning equipment (heating and cooling), for which two systems were considered: electric and combined. The electric system considers both heating and cooling using electricity, whereas the combined system considers an electric cooling and LP gas for heating. The costs regarding the use of electricity and fuel are determined at the end of each typical meteorological year. This cost is then used to calculate the present worth (PW) of the operation considering the life span of the greenhouse, the annual increase in the fuel costs, and the historical inflation.
PW is calculated to estimate the economic feasibility of each greenhouse shapes and cover materials. The equations (1) to (5) were used in the economic analysis and are described in detail.
Equation (1) describes the calculation of the PW, which is a result of the product of the uniform amounts R (4), and the series-present worth factor (2) plus the uniform gradient amount (5) multiplied by the gradient present worth factor (3), where (R) is based on the annual operating costs, obtained by the (Aux) energy calculated in the simulations, considering the equipment’s efficiency (eff) and the (EC) energy cost. The power cost adjustment (PCA) (i) represents the interest rate, and (n) corresponds to the analysis period. The analysis period (years) in this study is based on the life span of the materials cover materials.
Figure 9 shows the total cost of the greenhouse installation and operation during the 30 years of life span. Four different greenhouse shapes and two different materials were economically evaluated (PC and LDPE). The systems were considered to be powered electrically and combined (electric and gas). As a result of the analysis, an electrically operated greenhouse would represent more than four times the cost of the combined system.
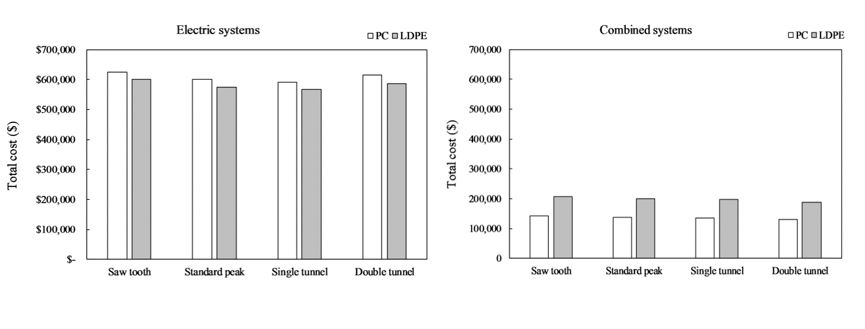
Using electric systems with the PC and LDPE covers presents a 5% and 6% difference between the most expensive (sawtooth) and most economical (single tunnel) greenhouse shapes. Meanwhile, between the combined systems, a difference of 8% and 9% is calculated for the covers which would require the highest (sawtooth) and the lowest investment (double tunnel). The difference in the investment, regarding the material (PC vs. LDPE) for the electric systems, would be up to 5% and for the combined system up to 46%. As a result, the best material for an electric system would be the LDPE. On the other hand, the PC would be the best option for the cover material when the combined system (electric and gas) is required.
Discussion
Temperatures show small differences of 0.5 °C to 2.5 °C and 6 °C to 8°C in the indoor minimum and maximum temperatures, respectively. However, even when these differences look small, the final energy consumption would not necessarily be small; therefore, further calculations needed to be completed. The greenhouses were classified by shape and analyzed to find an appropriate cover material. It was found that the LDPE covered greenhouse requires an average of 14.5% less energy when compared with the PC and PVC covered greenhouses.
Later, the greenhouses were classified by cover material, so the influence of the greenhouse's shape could be calculated. In this analysis, the double tunnel shape would need less energy when built with LDPE, PVC, and PC. Furthermore, the heating and cooling loads were reduced up to 6% when compared with the sawtooth-shaped greenhouse.
Finally, the economic analysis compared the cost of the electric and combined systems. As a result, it was found that the best cover material for an electric system is the LDPE, resulting in 5% less economic expenditure. On the other hand, the PC cover material would be 45% more cost-efficient for the combined system.
Conclusions
The thermal and economic assessment of four shapes of greenhouses was performed using dynamic simulation software. Common greenhouse shapes and cover materials were modeled and analyzed within the BSk climate. The results contrast with the technical solution, which analyzes only global energy consumption, leaving aside costs and energy efficiency. For all of the greenhouse’s shapes, the LDPE cover would require less energy on the established temperature range. Therefore, the technical solution pointed to the LDPE as the best system; nevertheless, when the cost of energy (gas and electricity) is involved, the optimal solution results to be a combined system with a PC cover. Thus, the operation costs when the LDPE cover is used is up to 3.8% less than when the PC and PVC are implemented.
This study proves the convenience of using dynamic simulation programs as powerful tools to assess techno-economic decisions over the use of energy in greenhouses. The authors encourage an exhaustive analysis of the shapes, covers, and fuels along with the consideration of the climatic characteristics of each greenhouse construction site. The next step would be to analyze different scenarios of renewable energy integration in order to minimize the fuel consumption and to maximize the economical savings.

