


 nova página do texto(beta)
 Inglês (pdf)
 Artigo em XML
 Referências do artigo
 Enviar este artigo por email
 Citado por SciELO
  Similares em
SciELO
Similares em
SciELO 
 Permalink
Introduction
The water of the Lerma River has been claimed to contain potentially toxic elements and, also, that it is a highly contaminated river which is recommended exclusively for agricultural use (López, Ramos & Carranza, 2007). The wastewater discharged in this river contains nutritional elements such as nitrogen and phosphorus that contribute to the yields of some crops (Jiménez & Marín, 2005; Quiroz, Mora, Molina & García, 2004; Zamora, Rodríguez, Torres & Yendis, 2008); however, the wastewater discharged into the flows and bodies of water are a source of infection and toxicity for human health and for the environment (Cifuentes, Blumenthal, Ruiz-Palacios, Bennett & Peasey, 1994; Cifuentes et al., 2000; Jiménez, 2001; Quiroz et al., 2004; Robledo et al., 2017). The environment impact of the discharge will depend on the concentration, type of elements, and time of exposure. The concentration of the most frequent ions (Ca2+, Mg2+, Na+, K+, HCO3 -, Cl-, and SO4 2-) and the quality of the Lerma River water were evaluated. The pH is an indicator of the degree of alkalinity or acidity of the water, and the electrical conductivity (EC) is an indicator of the salinity index. The ionic concentration of the solution is closely related to the salinity index (Rhoades, Chanduvi & Lesch, 1999), and this affects some crops. The effect depends on the type of ions present and the type of crop (Can et al., 2014; Sánchez, Camacho, Rodríguez & Ortega, 2013; Sánchez-Bernal, Ortega, González-Hernández, Camacho-Escobar & Kohashi-Shibata, 2008). In Guanajuato and Michoacán, the largest surface irrigated with Lerma River water is found in the irrigation district DDR 011. The main crops in the Lerma River basin are sorghum, barley, maize, wheat, alfalfa, asparagus, and broccoli (Comisión Nacional del Agua [Conagua], 2015), and it is expected that the salinity effect will not be the same for all crops.
With respect to the procedure recommended to calculate the risk of sodicity in soils irrigated with water containing bicarbonate and a pH below 8.4, it is recommended to determine the sodium adsorption ratio (SAR), and to adjust the concentration of calcium in the water to the equilibrium value expected after irrigation, and to include the effect of carbon dioxide (CO2), bicarbonate (HCO3 -) and salinity on the calcium originally contained in the irrigation water. It also supposes the existence of a source of calcium in the soil, such as calcite (CaCO3), and the inexistence of magnesium precipitates (Suarez, 1981; Can, Ramírez, Ortega, Trejo & Cruz, 2008). For highly alkaline waters (pH > 8.4), the procedure to calculate the SAR recommended by Velázquez, Ortega, Martínez, Kohashi & García (2002) is under the focus of Bower, Ogata & Tucker (1968), this focus only considers the precipitation of calcium carbonate. If the precipitate of this salt is present, the value of SAR will increase. The risk of sodification depends on the specific physical and chemical conditions of each soil and its chrystallochemical structure, calculated with the exchangeable sodium percentage (ESP) and the value of ionic selectivity coefficient (KG) along with the value for SARIW (Velázquez et al., 2002); the combined values of EC-SAR provide information on the risk of soil salinization and sodification (Richards et al., 1954). The present study was carried out to evaluate the quality of the Lerma River water and to distinguish changes in the pollutant concentration due to discharge of wastewater, and in order to estimate the risk of salinization and sodification of the irrigated soils in the Lerma River basin, agronomic water quality criteria were used (pH, EC, SAR, infiltration [EC-SAR] and ESP).
Materials and Methods
To carry out this research, the following materials were used: Global Positioning System (GPS Garmin® Etrex Venture HC); potentiometer (Hanna Instruments® pH 210); EC bridge (Hanna Instruments® HI 255); Spectrophotometer (JENWAY® 7305); flame spectrophotometer (Instrumentation Laboratory® AutoCal Flame Photometer 643); the software used was SAS® 9.0, SigmaPlot® 10.0, and Aq•QA® 1.1.
Study area
The Lerma River is part of the Lerma-Chapala basin (Figure 1); actually, the springs that originated the Lerma River in Almoloya lagoon disappeared, and they only receive water during the rainy season. The Lerma River originates in a channel that unites a set of cienegas of the lacustrine system in Almoloya, located in the Municipal area of Almoloya del Río, Mexico, at an altitude of approximately 2588 m. It ends in Lake Chapala, Jalisco, at 1530 mamsl (Figure 2). It is approximately 750 km long and its water is used mainly for agricultural and industrial purposes (Cotler-Ávalos, Mazari-Hiriart & de Anda-Sánchez, 2006).

Source: Author’s own elaboration.
Figure 1 Location of study area and sampling stations in the Lerma River.

Source: Author’s own elaboration.
Figure 2 Altitudinal profile of Lerma River in accord with measured data in the sampling stations.
Throughout its course it receives water from some tributary flows (rivers La Laja, Guanajuato, Turbio, Tigre, and Duero are the most important). The water accumulated in three dams is also used for crop irrigation and to produce electricity (Antonio Alzate, Tepuxtepec, and Solís). The annual average temperature and rainfall for the Lerma river basin is 21 °C and 700 mm, respectively (Cotler et al., 2006); the basin’s geological material is composed of andesitic and basaltic volcanic rocks (Demant, 1978).
Sampling, hydrochemical analysis and statistical analysis of results
Water samples were collected and analyzed from 39 sampling stations in the Lerma River. Samples were taken during April of 2015, considering the sampling methodology proposed by the Secretariat of Trade and Industrial Promotion (SCFI, from its Spanish acronym) (Diario Oficial de la Federación [DOF], 1980), and accessibility to the sites was granted. All sampling sites were located using a GPS.
The pH value was measured according to the methodology proposed by DOF (2016). The EC, expressed in dS
m-1 at 25 °C was measured following the method by Richards et al. (1954).
The concentrations of
Once the results of the chemical analysis of the water were obtained, the normality test was performed through the Shapiro-Wilk method, along with a descriptive statistics analysis, correlation analysis, and linear regression analysis to establish the influence between some of the variables (Montgomery & Runger, 2015), such as EC, cations, anions, total dissolved solids (TDS) and ionic strength (I).
Irrigation water quality indices
The quality of water for agricultural irrigation was determined according to the criteria proposed by Richards et al. (1954) (EC-SAR), Bower et al. (1968) (SARadj), Suarez (1981) (SAR°), and Ayers & Westcot (1985) (infiltration). These criteria have been used in various investigations (Azpilcueta, Pedroza, Sánchez, Salcedo & Trejo, 2017; Cortés et al., 2009; Nishanthiny, Thushyanthy, Barathithasan & Saravanan, 2010; Rodríguez et al., 2009; Sarabia, Cisneros, Aceves, Durán & Castro, 2011; Valles-Aragón, Ojeda-Barrios, Guerrero-Prieto, Prieto-Amparan & Sánchez-Chavez, 2017).
To calculate the risk of soil sodification, the SAR was estimated, and the Mg2+ was not considered, since the solubility of magnesium carbonate is higher than in calcium carbonate; therefore, Mg2+ remains in the solution, whilst Ca2+ precipitates as a carbonate (Kovda, Yaron & Shalhevet, 1973). The SAR equation is explained by the mass action law, which states that for a reversible reaction in balance and a constant temperature, a determined ratio of concentrations for reagents and products has a constant value K, which is the balance constant (Brown, Lemay, Bursten, Murphy & Woodward, 2014):
The scale of the equilibrium constant (Kc) indicates if a balanced reaction is favorable for products or reagents. If the value of the equilibrium constant is greater than 1, the balance will shift to the right, favoring the products (Kovda et al., 1973). From the above concepts, the SAR equation can be obtained (Sánchez, Ortega, Sandoval, Hernández & Estrada, 2012; Velázquez et al., 2002):
where: (3, 4 and 5) X1/2Ca2+, XNa+ represents the phase adsorbed in soil; K is the ion exchange coefficient; SARIW is the SAR of irrigation water expressed in mmol L-1 units; [Na+], [Ca2+] is the concentrations of sodium and calcium expressed in mmol L-1 units. In saline soils, the SAR equation is an indirect estimation of exchangeable Ca2+ and Mg2+:
where SARadj is the sodium adsorption ratio adjusted by the pH (Bower et al., 1968), considering only the calcite precipitation; LF is the leaching fraction (LF = 1.0); 8.4 is the pH of a non-sodic soil in equilibrium with the calcite (Richards et al., 1954, Velázquez et al., 2002). This is the limit from which the Ca2+ precipitates as CaCO3; pHs is the pH of the water in which the content of calcium, carbonate, and bicarbonate are in equilibrium; there is no calcite saturation or subsaturation (Langelier, 1936).
where I is the ionic strength of the solution, C is the concentration of ions in the solution expressed in mmol L-1, Z is the charge on the ion (Solomon, 2001), and the ionic strength is a measure of the electric field of a solution and is related to EC. This estimate is necessary to adjust the SAR.
The SAR proposed by Suarez (1981) adjusts the concentration of calcium in the water to the value of equilibrium expected after irrigation (SAR°):
where K1 and K2 are the first and second dissociation
constants of carbonic acid; KPS is the product of solubility of
calcite ([K1 = 6.3429, K2 = 10.2510, KPS =
8.3187] MacIness & Belcher, 1933);
This investigation proposes to estimate the SAR in the soil water (SARSW) under equilibrium conditions with calcite, from the composition of irrigation water, and considering the tendency towards precipitation (SIL +) or dissolution (SIL -) of calcite from irrigation water under the viewpoint of Langelier (1936) and modifying Bower’s equation, as shown in equation 10. Calcium dissolution (SIL -) reduces the value of SAR in soil water; calcium precipitation (SIL +) increases the value of SARSW:
where SARSW is the SAR of soil water, considering the precipitation or dissolution tendency of calcite; and pH is the pH measured in irrigation water; SIL=pH-PHs.
Results and discussion
Hydrochemical composition of the water in the Lerma River
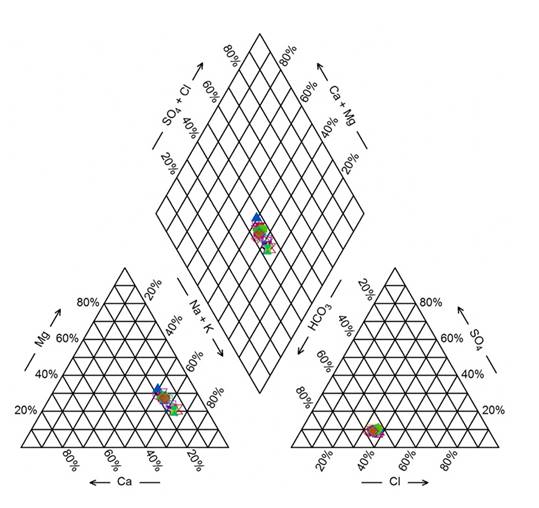
The hydrochemical composition of the Lerma River water was bicarbonate-sodic, according to the ionic dominance is illustrated in Figure 3. The ionic content in surface water, under natural conditions, depends on the mineralogical composition of prevalent rocks where the river flows (Appelo & Postma, 2005). The geological material of the Lerma-Chapala basin is composed of andesitic and basaltic volcanic rocks (Demant, 1978), which give the basin characteristics of low ionic concentration only at the beginning of the course, and predominant of bicarbonate and sodium. The discharges of wastewater into the rivers increase the concentration of these ions due to the discharge of household wastewater, agricultural and industrial drainage (Bautista, Cruz, Moncayo, Silva & Estrada, 2014; Chávez et al., 2011; Quiroz et al., 2004; Velázquez, Pimentel & Ortega, 2010).
Source: Author’s own elaboration.
Figure 3 Diagram to show the relative ionic composition of the Lerma river water.
Table 1 shows the descriptive statistics of the predominant ions found in the Lerma river water. The asymmetry and kurtosis values point to where the data distribution is found; in most cases, the asymmetry and kurtosis coefficients have positive values higher than 0.5, indicating that the data distribution is asymmetric, which can be confirmed with the Shapiro-Wilk normality test (p < (), except for the pH. The tendency of the pH was neutral-alkaline, considering its minimum and maximum value; the extreme values, higher than the top limit (8.01, 8.08, and 8.11), belong to samples 16, 30, and 14, located in Acámbaro and la Calle, in Guanajuato, where water is used to irrigate crops; the extreme values below the bottom limit (7.03, 7.00, and 6.81) were found in samples 10, 25, and 27 in Atlacomulco, Salamanca and Labor de Peralta, and coincide with the urban-industrial water discharge, as well as water for agricultural use in Labor de Peralta (Figure 4).
Table 1 Descriptive statistics of the ionic concentration in the Lerma River water.
| pH | EC dS m-1 |
Ca2+ | Mg2+ | Na+ | K+ | HCO3 - | Cl- | SO4 2- | TDS mg L-1 |
|
|---|---|---|---|---|---|---|---|---|---|---|
| -------------------------------- meqL-1 -------------------------------- | ||||||||||
| Skewness | 0.279 | 0.992 | 1.164 | 1.199 | 0.967 | 1.286 | 0.92 | 1.073 | 1.38 | 0.983 |
| Kurtosis | -0.765 | 0.517 | 1.306 | 1.357 | 0.59 | 1.306 | 0.302 | 0.731 | 2.59 | 0.49 |
| Sh-W | 0.29 | 0.0004 | 0.0008 | 0.0005 | 0.0007 | 0.0002 | 0.0007 | 0.0004 | 0.0004 | 0.0004 |
| Min. | 6.81 | 0.372 | 0.62 | 0.98 | 1.69 | 0.2 | 1.92 | 1.22 | 0.32 | 255.72 |
| Max. | 8.11 | 1.323 | 2.36 | 3.66 | 6.72 | 0.86 | 6.71 | 4.55 | 1.32 | 898.2 |
| Mean | 7.44 | 0.65 | 1.089 | 1.657 | 3.214 | 0.394 | 3.397 | 2.223 | 0.556 | 444.13 |
| Median | 7.37 | 0.643 | 1.05 | 1.60 | 3.10 | 0.36 | 3.36 | 2.18 | 0.56 | 438.75 |
| Std. Dev. | 0.331 | 0.259 | 0.424 | 0.638 | 1.368 | 0.169 | 1.331 | 0.924 | 0.22 | 177.23 |
| Range | 1.3 | 0.951 | 1.74 | 2.68 | 5.03 | 0.66 | 4.79 | 3.33 | 1.00 | 642.48 |
| CV (%) | 4.44 | 39.84 | 39.01 | 38.52 | 42.56 | 42.9 | 39.18 | 41.56 | 39.56 | 39.90 |
| Q1 | 7.21 | 0.401 | 0.70 | 1.10 | 1.89 | 0.24 | 2.10 | 1.37 | 0.36 | 273.70 |
| Q3 | 7.74 | 0.781 | 1.31 | 2.07 | 3.92 | 0.47 | 4.06 | 2.68 | 0.66 | 532.47 |
| 95 % | 8.08 | 1.252 | 2.10 | 3.10 | 6.58 | 0.82 | 6.40 | 4.55 | 0.98 | 857.72 |
| n = 39; Sh-W: Shapiro-Wilk normality test; α = 0.05. | ||||||||||
Source: Author’s own elaboration.

Source: Author’s own elaboration.
Figure 4 Distribution and box plot diagram of the measured values of pH in the water of Lerma River.
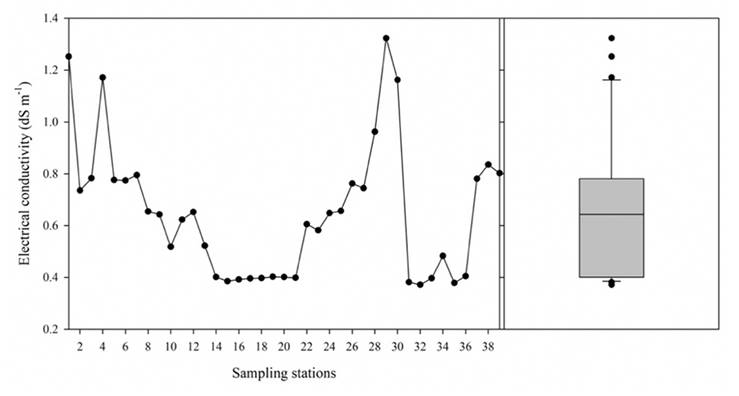
The EC presented a variation with a medium tendency (CV = 39.84%) and indicates the heterogeneity of values of the Lerma River water, between 0.372 dS m-1 and 1.323 dSm-1. In their study, López et al. (2007) and Zarazúa et al. (2013) found heterogeneous values for EC. During the flow of the Lerma River, it receives discharges of urban, industrial, and agricultural wastewaters, which explains the variation found, despite 75% of the water samples having EC values below 0.781 dS m-1, and the median being 0.643 dS m-1, the extreme values higher than the upper limit (Figure 5) were found in the Almoloya Lagoon (1.252 dS m-1), Xonacatlán (1.171 dS m-1), and Pastor Ortiz (1.323 dS m-1). The EC found in the Almoloya Lagoon can be explained by the evaporation of this body of water, since the evaporation of the solutions induces ionic concentration, increasing EC; in addition, it is part of a lacustrine system affected by the intense extraction of groundwater (Cotler et al., 2006); in contrast, rainfall favors its dilution. Near Xonacatlán is an important urban and industrial center, and Pastor Ortiz is an agricultural area, so these extreme values could be explained by the discharge of wastewater and agricultural drainages into the Lerma River water.
Source: Author’s own elaboration.
Figure 5 Distribution and box plot diagram of the measured values of EC in the water of Lerma River.
The concentration of total dissolved solids was estimated from the sum of concentration of these ions expressed in mg L-1 units, with a dimensional analysis. The values show that 75% of the water samples had a concentration of less than 532 mg L-1, and 95% showed values below 857.72 mg L-1; according to the total dissolved solids, the Lerma River water was classified as low salinity.
The sequence from higher to lower concentrations of cations and anions can be established according to the value of the median: Na+> Mg2+> Ca2+> K+ and HCO3 -> Cl-> SO4 2-; these waters are bicarbonated-sodic. The highest concentration of cations is of sodium ions, whereas for anions, bicarbonate showed the highest concentration. Bicarbonated-sodic waters have been found to be typically residual in varied concentrations (Can et al., 2008; Cuellar, Ortega, Ramírez & Sánchez, 2015; López et al., 2016) and its use in agricultural irrigation can lead to the risk of salinization and sodification for the soils and the crops irrigated with these waters, as well as the risk of potentially toxic metals in the arable layer of agricultural soils (Siebe, 1994; Zamora et al., 2008). This study does not analyze the concentration of heavy metals, yet the Lerma River has been reported to contain toxic metals, and from an ecological and toxicological perspective, it is a river with high levels of pollutants (Zarazúa et al., 2013), which is recommended exclusively for agricultural use (López et al., 2007). However, the use of wastewater may increase the ESP values in the soil due to high SAR values found in the Lerma River water and increase the salinity of soil solution affecting the normal development of crops (Sánchez et al., 2012).
In order to establish the influence of the concentration of the ions Ca2+, Mg2+, Na+, K+, HCO3 -, Cl-, and SO4 - on the EC, ionic strength and total dissolved solids, the Spearman’s correlation test (Table 2) was carried out, followed by a linear regression analysis.
Table 2 Spearman’s correlation coefficients.
| CE | Ca2+ | Mg2+ | Na+ | K+ | HCO3 - | Cl- | SO4 2- | TDS | I | |
|---|---|---|---|---|---|---|---|---|---|---|
| CE | 1 | |||||||||
| Ca2+ | 0.981 | 1 | ||||||||
| Mg2+ | 0.932 | 0.948 | 1 | |||||||
| Na+ | 0.961 | 0.927 | 0.841 | 1 | ||||||
| K+ | 0.950 | 0.961 | 0.908 | 0.908 | 1 | |||||
| HCO3 - | 0.990 | 0.967 | 0.921 | 0.966 | 0.944 | 1 | ||||
| Cl- | 0.976 | 0.982 | 0.929 | 0.941 | 0.948 | 0.949 | 1 | |||
| SO4 2- | 0.960 | 0.961 | 0.923 | 0.925 | 0.962 | 0.948 | 0.964 | 1 | ||
| TDS | 0.997 | 0.977 | 0.922 | 0.966 | 0.956 | 0.993 | 0.969 | 0.959 | 1 | |
| I | 0.977 | 0.976 | 0.939 | 0.956 | 0.953 | 0.976 | 0.974 | 0.969 | 0.975 | 1 |
| p-value < 0.0001 in all cases; α= 0.05. | ||||||||||
Source: Author’s own elaboration.
The ionic strength is an important variable in agriculture, since it helps
estimate the calcium carbonate saturation index (SIL), which is an
indicator of the precipitation or solubilization of calcite, also necessary in
estimating the SAR. Spearman’s correlation coefficient shows that the variables
are related (Rho > 0.90). Given that the test statistic
(p-value) is lower than in the comparison statistic α= 0.05),
in all cases of p < 0.05, the following correlational
hypothesis can be established:
This means that EC, TDS, and I are closely related to ionic concentration. However, the influence of each ion over EC, TDS, and I is different. In this sense, the following sequence can be established from higher to lower influence by the cations: Ca2+> Na+> K+> Mg2+, and by anions: HCO3 -> Cl-> SO4 2-. In general, Ca2+, Na+, HCO3 -, and Cl- had a greater influence on the EC, TDS, and I. These relations could be explained by the dependence of EC and I on the concentration of ions in solution and is based on the Arrhenius theory of electrolytic dissociation.
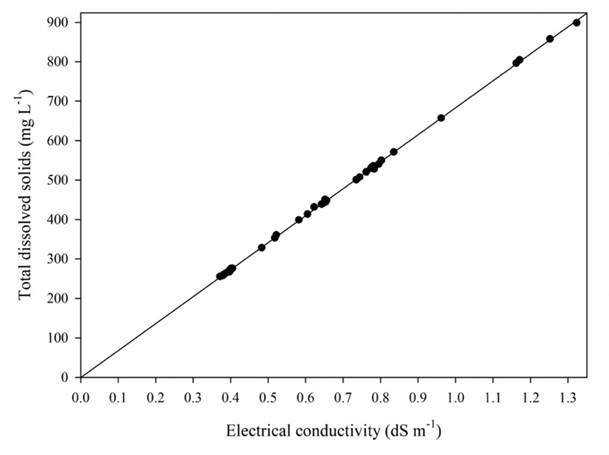
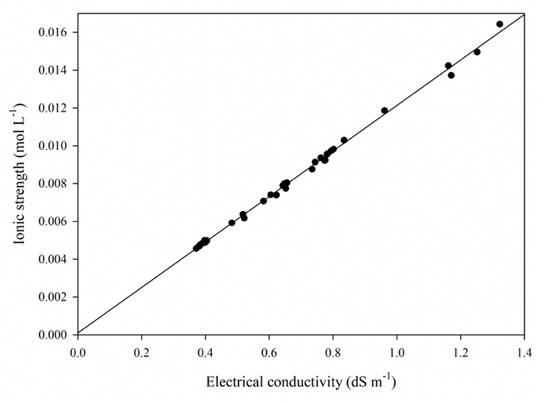
Because EC is a relatively simple and quick determination, it provides a good estimation of the total electrolytic concentration (González, 2000), but -as in the measurement of total dissolved solids by evaporation- it does not provide information on the concentration and dominance of ions in a solution, and the type of water is also unknown. Given that these variables are related, if we know the EC value, the concentration of TDS can be estimated with a great deal of accuracy (Table 3), along with the ionic strength of the solution (Table 4), since the relation between EC and TDS (Figure 6), as well as the relation between EC and I (Figure 7), is linear.
Table 3 Analysis of variance to test the significance of the TDS-EC regression.
| Dependent variable Y (TDS, mg L-1) | Independent variable X (EC, dSm-1) | ||||
|---|---|---|---|---|---|
| Source of variation | Degrees of freedom | Sum of squares | Mean square | F-Value | Pr > F |
| Regression | 1 | 1193356.76 | 1193356.76 | 163193 | <0.0001 |
| Error | 37 | 270.564 | 7.313 | ||
| Total | 38 | 1193627.33 | |||
| R2 = 0.9997 | CV = 0.6088 | ||||
| Predictor | Coefficient | Standard error | t-Value | Pr > t | |
| Constant | β0 = -0.5706 | 1.1829 | -0.48 | 0.6324 | |
| EC (dS m-1) | β1 = 684.1658 | 1.6935 | 403.97 | <0.0001 | |
Source: Author’s own elaboration.
Table 4 Analysis of variance to test the significance of the I-EC regression.
| Dependent variable Y (I, mol L-1) | Independent variable X (EC, dSm-1) | ||||
|---|---|---|---|---|---|
| Source of variation | Degrees of freedom | Sum of squares | Mean square | F-Value | Pr > F |
| Regression | 1 | 0.00035537 | 0.00035537 | 5210.38 | <0.0001 |
| Error | 37 | 0.00000252 | 0.00000007 | ||
| Total | 38 | 0.00035790 | |||
| R2 = 0.9929 | CV = 3.258 | ||||
| Predictor | Coefficient | Standard error | t-Value | Pr > t | |
| Constant | β0 = 0.00027 | 0.0001142 | 2.40 | 0.0214 | |
| EC (dS m-1) | β1 = 0.01180 | 0.0001635 | 72.18 | <0.0001 | |
Source: Author’s own elaboration.
Source: Author’s own elaboration.
Figure 6 Simple regression linear of electrical conductivity and total dissolved solids data.
Source: Author’s own elaboration.
Figure 7 Simple linear regression of electrical conductivity and ionic strength data.
According to the results obtained from the variance analysis, the regression is
highly significant to explain the values of TDS (mg L-1) from EC (dS
m-1). Using the equation
Given that the test statistic (Pr > F) is lower than the comparison statistic
(α = 0.05), the regression values explain the relation between EC and I, 99.29%
of the variation in the values found for ionic strength can be explained by the
values of EC; therefore, the regression model is trustworthy to estimate the
ionic strength from EC using the equation:
It is necessary to clarify that this type of relationships is not causal. That is, EC, ionic strength, and total concentration of dissolved solids depend, fundamentally, on the concentration of ions in the solution. Also, these regression relationships are only valid for the values of the regression variables found in the broadness of the original data (Montgomery & Runger, 2015). This is the reason why various studies (González, 2000; Griffin & Jurinak, 1973; Leffelaar, Arie & Raj, 1983; López et al., 2016; Pasricha, 1987; Ponnamperuma, Tianco & Loy, 1966 ) that propose the estimation of TDS and I show different regression values for the estimation of this variables. In this case, the measurement of the hydrochemical data is recommended to have a broader vision and to precise the composition, concentration, and type of waters evaluated for its use in agricultural irrigation.
Irrigation water quality and estimation of soil salinity and sodicity
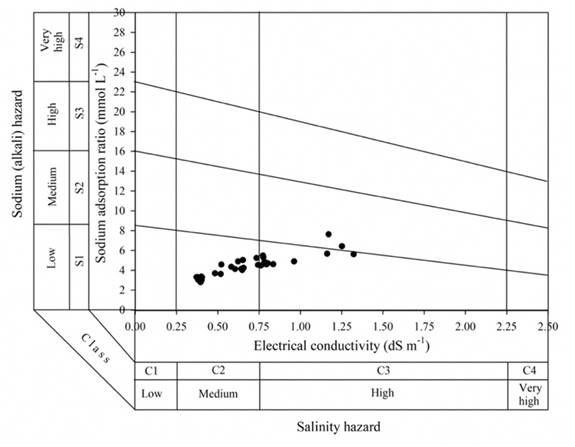
The main indices for the evaluation of water are EC and the SAR, used to estimate the risk of salinization and sodification of the soil and crops (Ayers & Westcot, 1987; Richards et al., 1954). Regarding EC, the normal values for irrigation water are lower than 3.0 dS m-1 since higher values affect the availability of water for irrigation, making restrictions of use more severe. This research found that 75% of the water samples had EC values below 0.781 dS m-1, and 95% < 1.252 dS m-1, which is why they are not a hazard to water availability for crops and have no use restrictions considering only salt content.
The risk of salinization and sodification of the soil and crops is illustrated in Figure 8. This diagram also includes EC and SAR and shows that waters with a low concentration and high SAR have a higher use restriction due to the risk of sodification from their use in agricultural irrigation; water with a higher concentration and low SAR reduces the risk of sodification, but it increases the risk of salinization. The diagonal lines show the risk of sodification and were built using the following equations: bottom diagonal: SAR = 18.87-4.44(log EC); intermediate diagonal: SAR = 31.31-6.66(log EC); top diagonal: SAR = 43.75-8.87(log EC); the values for EC were: 250 μS cm-1, 750 μS cm-1, and 2250 μS cm-1.
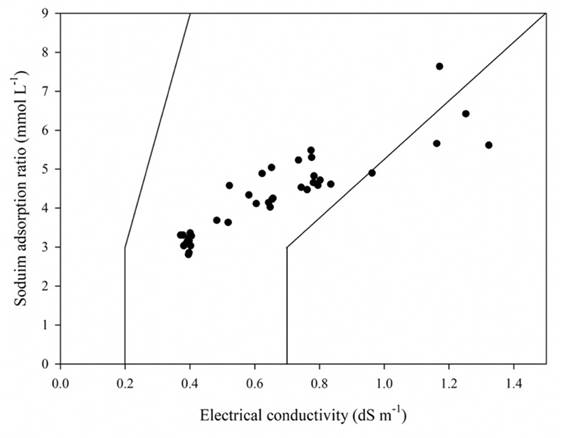
To evaluate the problems of the relative reduction of infiltration caused by salinity and the SAR, the criterion proposed by Ayers & Westcot (1987) was used The left diagonal was drawn using the following EC and SAR values: (0.2, 3.0 and 0.4, 9.0); the right diagonal, with the EC and SAR values: (0.7, 3.0 and 1.5, 9.0). In this case, the low EC values (< 0.4 dSm-1), along with the irrigation water’s SAR, account for a relative reduction of the severe infiltration, whereas high EC values (> 0.7 dS m-1) reduce the infiltration problems significantly. In water with very low concentration, sodium is predominant, and the water is more corrosive and tend to solubilize soil minerals, including Ca2+, leading to damage of the soil structure. The dispersed soil particles obstruct pores, reducing the rate of infiltration water in the soil (Sánchez et al., 2012); in general terms, soil dispersion and the destruction of its structure are produced when sodium concentration is greater than that calcium in a ratio higher than 3:1 (Ayers & Westcot, 1987).
Figure 9 shows that most of the water samples analyzed (89.74%) can reduce the water soil infiltration by their application in agricultural irrigation. This is due to the SAR values being high, since it was found that the Lerma River water has a predominance of Na+ and HCO3 -; therefore, irrigation with this water causes the accumulation of sodium salts and risk of a variable soil sodification.
Source: Author’s own elaboration.
Figure 9 Relative rate of water infiltration as affected by salinity and sodium adsorption ratio.
To observe the different sodification values of the irrigated soil, due to the application of the Lerma River water to crops irrigation, the SAR of soil water was estimated, considering the approach by Bower et al. (1968), Suarez (1981), and including the calcite solubilization tendency using the Langelier index.
The highest values for SAR (Table 5) are those estimated with Bower’s equation. This approach only considers the precipitation of calcite; that is, it estimates a soil sodification value, considering that 8.4 is the value of a non-sodic soil in equilibrium with calcite and is the limit from which Ca2+ precipitates and from which sodic soil appear. The equilibrium pH is estimated properly in the water using the equation proposed by Langelier (1936); therefore, the evaluation of water requires this estimation (pHs) to then estimate the calcite solubilization or precipitation tendency that influences the estimation of SAR in soil water.
Table 5 Values of sodium adsorption ratio, ionic strength and pHs in the Lerma River water.
| I mol L-1 |
pHs | SARIW | SARadj | SAR° | SARSW | |
|---|---|---|---|---|---|---|
| ---------------------- (mmol L-1) ---------------------- | ||||||
| Skewness | 1.029 | -0.334 | 0.872 | 0.872 | 0.787 | 1.74 |
| Kurtosis | 0.482 | -0.802 | 1.162 | 0.525 | 0.427 | 2.64 |
| Sh-W | 0.0002 | 0.0144 | 0.017 | 0.0021 | 0.0219 | 0.0001 |
| Min. | 0.005 | 7.15 | 2.80 | 3.48 | 1.98 | 0.038 |
| Max. | 0.016 | 8.24 | 7.63 | 15.37 | 5.91 | 10.236 |
| Mean | 0.0079 | 7.82 | 4.26 | 6.98 | 3.27 | 2.87 |
| Median | 0.008 | 7.78 | 4.24 | 6.77 | 3.18 | 2.18 |
| Std. Dev. | 0.003 | 0.309 | 1.06 | 3.03 | 0.94 | 2.53 |
| Range | 0.011 | 1.091 | 4.82 | 11.89 | 3.93 | 10.19 |
| CV (%) | 38.6 | 3.95 | 25.03 | 43.46 | 28.79 | 88.39 |
| Q1 | 0.005 | 7.62 | 3.28 | 3.96 | 2.39 | 1.21 |
| Q3 | 0.01 | 8.15 | 4.88 | 8.56 | 3.76 | 3.23 |
| 95 % | 0.015 | 8.22 | 6.42 | 13.95 | 5.45 | 10.06 |
| n = 39; Sh-W: Shapiro-Wilk normality test; α= 0.05. | ||||||
Source: Author’s own elaboration.
Regarding the above, Suarez (1981) proposed evaluating the SAR of the soil water, considering an adjustment of the concentration of Ca2+ to values of equilibrium after irrigation. With this approach, Can et al. (2008) recommended to evaluate the SAR in low-concentration bicarbonated water; in their study, Cuellar et al. (2015) found very similar values for SARIW and SAR°.
This investigation considered evaluating the SAR of soil water by using the SAR of irrigation water and the calcium carbonate saturation index, under the conceptual approach by Bower et al. (1968) and including the precipitation or solubilization of calcite (SIL). It was found that the water samples that tended towards the precipitation of calcite increased the value of SARSW, and in the water samples in which calcite is estimated to solubilize in contact with the soil, the values of SARSW decreased. The correlation coefficient between variables SIL and SARSW was of 0.941. This is a very high correlation (p-value < 0.0001), which indicates that if the value of the SIL increases ([from SIL -, to SIL +]) of solubilization towards precipitation], the value of SARSW increases (Figure 10).

The analysis of the ratio between the SAR values indicated that the SARadj/SARIW was 1.62, the SAR°/SARIW was 0.75, and the SARSW/SARIW was 0.54. Considering these proportions, it can be observed that the SARadj estimates a higher risk of sodification, due to the precipitation of Ca2+ in irrigation water. The SAR° is lower than SARIW and this is due to the adjustment in the concentration of Ca2+, and the SARSW is also lower than the SARIW, which can be explained by the estimation of the tendency towards the solubilization of calcite (SIL -).
Given the variety of soil types in the Lerma River basin, it was considered to estimate the ESP existing in the soil by the application of water to agricultural irrigation, considering the SARIW values and different ionic exchange constants (KG):
[11] where KG = 0.007244, 0.0118614 and 0.016899, representing a sandy, loamy and clay soils, respectively (Velázquez et al., 2002).
The scale of the estimated ESP values is related with the value of KG. Therefore, for a sandy soil, a lower ESP is estimated, the highest ESP value is estimated for a clay soil in all cases (Table 6). This indicates that the clay soils have a greater potential to develop sodicity problems due to their greater exchange surface and exposed negative charges. Silva, Ochoa, Cristobal & Estrada (2006), in their study, attributed the soil salinity to irrigation water type C3 in the agricultural area of Chapala Lake.
Table 6 Estimation of the ESP from the SARIW and different values of the constant of ionic exchange.
| PSI-K1 | PSI-K2 | PSI-K3 | |
|---|---|---|---|
| Skewness | 0.823 | 0.794 | 0.764 |
| Kurtosis | 0.997 | 0.902 | 0.806 |
| Sh-W | 0.0216 | 0.0249 | 0.0286 |
| Min. | 1.99 | 3.22 | 4.52 |
| Max. | 5.23 | 8.3 | 11.42 |
| Mean | 2.99 | 4.8 | 6.69 |
| Median | 2.98 | 4.79 | 6.69 |
| Std. Dev. | 0.723 | 1.136 | 1.55 |
| Range | 3.24 | 5.08 | 6.89 |
| CV | 24.18 | 23.67 | 23.14 |
| Q1 | 2.32 | 3.75 | 5.26 |
| Q3 | 3.41 | 5.47 | 7.62 |
| 95 % | 4.44 | 7.07 | 9.78 |
| n = 39; Sh-W: Shapiro-Wilk normality test; α = 0.05. | |||
Source: Author’s own elaboration.
The surfaces of all minerals have electrical charges, but clays have greatest cationic exchange capacity, and particularly montmorillonite. The cations are adsorbed with a different strength; the ions with the greatest strength of adsorption can displace those with a weaker adsorption. This process is known as cationic exchange. Trasviña, Bórquez, Leal, Castro & Gutierrez (2018) concluded that the gypsum application to saline soil decreases PSI, EC and SAR values due to cationic exchange and salts leaching.
The following figure (Figure 11) illustrates the change in the ESP estimated according to the values of KG and SARIW. For one value of SARIW there are different values for ESP that depends on the value of KG. The lowest ESP values appear in the bottom dotted line, and represent the value of KG = 0.007244, whereas the highest ESP values are in the top dotted line and represent the value of KG = 0.016899. The gypsum application in agricultural soils may reduce the risk of sodification and salinization processes; in addition, it is necessary to apply the salts leaching through agricultural drainage (López et al., 2016; Trasviña et al., 2018).

Conclusions
Based on the results of this research, it is concluded that the concentration of the water in the Lerma River, with an ionic dominance of bicarbonate and sodium, may cause salinization and sodification processes in the irrigated soils.
The variation in the concentration and the bicarbonated-sodic water in this study, and the toxic elements found by others scientists, are due to the discharges of wastewater (industrial and domestic) and agricultural drainage into the Lerma River water.
A close relation was found between EC, TDS, and I and, therefore, the concentration
of TDS and I can be estimated using the regression equations:
The risk of soil sodification, evaluated using SARIW was low. Therefore, low values were estimated for ESP for loamy and sandy soils, whereas the highest values were estimated for clay soils. The highest ESP was below 11.42; therefore, the risk of sodification may depend on the type of soil, although the accumulation of sodic salts was due to the process of evapotranspiration, and the inadequate management of agricultural irrigation could increase soil sodicity with a higher intensity in clay soils.
The dissolution or precipitation of calcite estimated with the saturation index influenced the estimation of the SAR of soil water. Negative values for SIL resulted in the reduction of the SARSW, while positive values of this index increased the estimated value for SARSW. These values must be confirmed with the experimental analysis of agricultural soils and with the conceptual approaches by Langelier (1936), Bower et al. (1968) and Suarez (1981) to visualize the generalities of the process of sodification and salinization due to the application of irrigation water; additionally, they determine the concentration of heavy metals in water and irrigated soils due to potential risk of accumulation and toxicity in crops and agricultural soils.

