


 nova página do texto(beta)
 Inglês (pdf)
 Artigo em XML
 Referências do artigo
 Enviar este artigo por email
 Citado por SciELO
  Similares em
SciELO
Similares em
SciELO 
 Permalink
Introduction
Unspecific obesity (Body Mass Index, BMI ≥ 30 kg/m2) and central obesity (Waist Circumference, WC ≥ 80 cm for women and ≥ 90 cm for men) (Alberti et al., 2009) are important risk factors that underlie several diseases such as cardiovascular diseases (CVD), hypertension (HT), type 2 diabetes (D2), cancer, osteoporosis, and others (Cui et al., 2014; Hou et al., 2013; Moore et al., 2004; Murguía-Romero et al., 2015; Urquidez-Romero et al., 2017; Villalobos-Molina et al., 2015; Wall-Medrano et al., 2016). In addition to BMI and WC, some other obesity indexes have been reported, like Ponderal Index (PI; weight/height3), Human Body Shape Index (HBSI; weight/heightx), Waist to Hip Index (WHI; Waist/Hip), Taper Index (TI; Waist circumference/(0.109•√weight/height)), and A Body Shape Index (ABSI = WC/(BMI2/3 • height1/2)) (Krakauer & Krakauer, 2012; Lebiedowska & Stanhope, 2012; Taylor, Jones, Williams & Goulding, 2000).
The BMI, PI, and HBSI take weight and height into account to determine low weight or obesity, then estimated values for those parameters are unspecific; furthermore, when athletes or muscular people are evaluated, those indexes do not represent obesity. In contrast, the TI and ABSI include the WC in their equations to determine central obesity with higher precision; however, somatotype (i.e., endomorphy, mesomorphy, and ectomorphy, always in this order) has been less considered to determine obesity (Heath & Carter, 1967).
Body image is defined as the self-perception of the size, figure, and form of our body, and the feelings and attitudes regarding it (Slade, 1988); this self-perception could be positive or negative. One of the main factors that influence perception of body image is the images of “ideal” and stylized bodies shown in the media, where when people are exposed to images of thin models, they tend to report a negative self-image (Groesz, Levine & Murnen, 2002). Other factors that influence the body image perception are the BMI, self-esteem, age, and social pressure to maintain an ideal body (Monteath & McCabe, 1997). Diverse reports have analyzed the body image, with interesting findings since a negative body image is a predictor of eating disorders (Ahrberg, Trojca, Nasrawi & Vocks, 2011; Peat, Peyerl & Muehlenkamp, 2008; Skrzypek, Wehmeier & Remschmidt 2001; Vaquero-Cristóbal, Alacid, Muyor & López-Miñarro, 2013), obesity (Makara-Studzińska & Zaborska, 2009), postpartum depression (Silveira, Ertel, Dole & Chasan-Taber, 2015) and low self-esteem (Monteath & McCabe, 1997), among others.
On the other hand, in order to know the relationship between the perception of body image and health status, overweight, obesity, body dysmorphia, and eating disorders, several instruments have been developed in which through images selection and body silhouettes of a person, a disorder (eating, psychological, morphological, among others) associated with body image could be detected (Gardner, 1996; Gardner, Jappe & Gardner, 2009; Pulvers, Bachand, Nollen, Guo & Ahluwalia, 2013; Thompson & Gray, 1995). In this regard, Pulvers et al. (2004) had used a questionnaire of nine body silhouettes similar to Gardner’s (Gardner, 1996) to determine BMI, that has been validated through anthropometric measures, among other methods; in contrast, Gardner et al. (2009) updated their scale on body dimensions with an expanded questionnaire that includes 17 figures and validated it through anthropometric measures. Authors tried to cover different ranges of body shape, from underweight to obesity (BMI = 16.7 kg/m2 to 38.9 kg/ m2); however, in their study, a wide variance (14.6) between BMI of self-perception vs the measured one, along with a regular inter-observer correlation (0.76), were obtained. Researchers have not analyzed sensitivity or specificity of their instruments; on the contrary, it has been reported that the Body Image Dimensional Analysis questionnaire have 83% sensitivity and 92% specificity (Segura-Garcia, Papaianni, Rizza, Flora & De Fazio, 2012) when compared with the subscale of Body Dissatisfaction of the Eating Disorders Inventory-2 (BD-EDI-2), which is a validated and widely used questionnaire to detect eating disorders (Garner, Olmstead & Polivy, 1983). In addition, Pulvers et al. (2013) with their 9 silhouettes questionnaire showed high sensitivity (85%) and moderate specificity (75%) to determine overweight and obesity, even though it does not discriminate underweight people. It is proposed that somatotype could be widely used to evaluate different degrees and shapes of obesity, as well as thinness and muscularity; then it has been used to evaluate athletes (Gutnik et al., 2015), but it has not been employed regarding the health of the general population. Since determining somatotype involves several anthropometric measurements such as weight, height, diameters, perimeters and skin folds, it could be a useful approach in comparison to the other indexes to determine obesity as well as body image (Ramos-Jiménez et al., 2016), because observed somatotype modifications impact on body image (Ramos-Jiménez et al., 2016).
To the best of our knowledge, there are no reports where simultaneously both body image and somatotype, or body shape, overweight or obesity could be related. Therefore, the objective of this study is to measure the sensitivity and specificity of the Heath & Carter (1967) somatotype and the body silhouettes questionnaire described by Gardner et al. (2009) and Ramos-Jiménez, Hernández-Torres, Urquidez-Romero, Wall-Medrano & Villalobos-Molina (2017) in university students from northern Mexico, taking the BMI as a disease risk parameter and, thereby, obtaining two new instruments to predict nonspecific obesity and central obesity.
Materials and Methods
This is a nonprobability study conducted in 2015, through an open announcement, in which 294 university students (143 women) from Universidad Autónoma de Ciudad Juárez, Chihuahua, México, aged between 18 and 35 years, accepted to participate. Students signed an informed consent letter which was in accord to the Helsinki guidelines and approved by the University Ethics Committee.
In order to know the body image perception, participants answered the questionnaire described by Gardner et al. (2009) and Ramos-Jiménez et al. (2017) on four occasions. Questions asked in that questionnaire were: How do I look? (BI-1), How do I want to look like? (BI-2), How do I think others see me? (BI-3), a third person answered the question How am I seen by others? (BI-4). Such questionnaire shows 9 figures set on body image, where images 1-3 represent people with BMI < 20 kg/m2, images 4-5 represent people with BMI 20 kg/m2 - 24.9 kg/m2, images 6-7 represent people with BMI 25 kg/m2 - 29.99 kg/m2, and images 8-9 represent people with BMI ≥ 30 kg/m2 (Makara-Studzińska & Zaborska, 2009), i.e., the higher the BMI of the measured subject, the higher the body weight related to height.
Regarding the somatotype and body shape, participants were measured through anthropometrics (Norton & Olds, 1996) and recommended by the International Society for Advancement in Kinanthropometry (ISAK). Measurements of folds, diameters, and perimeters were done with a Centurion anthropometric tape (Rosscraft, Vancouver, Canada); while body weight was recorded with a digital scale (SECA model 656, Hamburg, Germany), and height was recorded with a portable stadimeter (SECA model 206). The anthropometrist is an ISAK level 2 expert and somatotype was calculated according to Norton & Olds (1996), where endomorphy represents the obesity degree in people, mesomorphy shows the muscularity degree, and ectomorphy is the thinness degree (for a complete description of somatotypes and their equations, see Norton & Olds (1996)). Since WC increases in relation to height, it was adjusted by the height of the Phantom subject, i.e., to multiply it by 170.18 cm and divide it by the actual height of the evaluated individual (Norton & Olds, 1996).
Statistical analysis
Variables were analyzed through the methodology of classification and regression trees, where the sensitivity, specificity, precision, and accuracy of the model were all being analyzed through binary classification (Murguía-Romero et al., 2015). In this work, sensitivity is the predicted number of cases with the pathology correctly diagnosed; specificity is the predicted number of cases as healthy correctly diagnosed; positive precision is the number of cases with pathology correctly predicted, and negative precision is the number of cases without pathology correctly predicted; accuracy is the total number of cases correctly predicted (with or without pathology).
Sensitivity and specificity for both cutoff points for somatotype as well as for the scale of body image were derived from receiver operating characteristic (ROC) curves. Also, the cutoff points for ROC curves have been described (Alberti et al., 2009) to determine obesity (BMI > 30 kg/ m2; WC > 80 cm for women and > 90 cm for men) and were calculated for the maximal score observed with the Youden index (Wall-Medrano et al., 2016). In this study, ROC curves ≤ 50 showed no discriminant capacity, at 50 - 60 they showed very low capacity, at 60 - 70 they showed low capacity, at 70 - 80 they showed moderate capacity, at 80-90 they showed high capacity, and at 90 - 100 they showed very high capacity. Finally, Cronbach's alpha was used to validate the reliability of the questions of the body shape questionnaire used here. All statistical analysis was based on the Statistical Package for the Social Sciences (SPSS) ver 21.0.
Results
According to the classification tree, somatotype correctly predicted 91.4% and 98.3% of positive and negative cases (with and without obesity), with the highest prediction for unspecific obesity. In contrast, body image correctly predicted 87.4% and 94.0% of cases, the highest for unspecific obesity (Table 1).
Table 1 Discriminant capacity of somatotype and body image to determine unspecific obesity (BMI ≥ 30 kg/m2) and central obesity (WC: ≥ 80cm, women; ≥ 90 cm men).
| Somatotype Unspecific obesity |
Central obesity | Body image Unspecific obesity |
Central obesity | |
|---|---|---|---|---|
| Sensitivity | 99.6% | 94.3% | 95.1% | 80.4% |
| Specificity | 86.7% | 90.8% | 76.5% | 88.9% |
| Positive accuracy | 91.0% | 69.4% | 98.5% | 64.3% |
| Negative accuracy | 95.3% | 98.6% | 50.0% | 94.8% |
| Accuracy | 98.3% | 91.4% | 94.0% | 87.4% |
Note: Percent values obtained through Classification and Regression Tree.
Source: Author’s own elaboration
In regard of somatotype, endomorphy was the main component that predicted unspecific as well as abdominal obesity, followed by mesomorphy and endomorphy (Figure 1a), while, in body image, the main component that predicted unspecific and central obesity was the question How am I seen by others? (BI-4), followed by How do I think others see me? (BI-3). The question How do I want to look like? was the weakest predictor (BI-2) (Figure 1b).
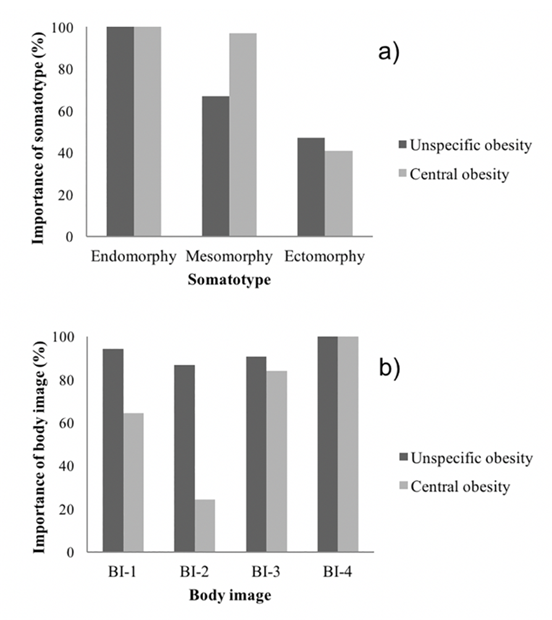
Source: Author’s own elaboration
Figure 1 Body image predictors to determine unspecific obesity (BMI ≥ 30 kg/m2) and central obesity (WC: ≥ 80cm, women; ≥ 90 cm men). BI-1 = How do I look? BI-2 = How do I want to look like? BI-3 = How do I think others see me? BI-4 = How am I seen by others?
Tables 2 and 3 show the Youden index and cutoff points for somatotype derived from ROC curves, where there are between moderate and very high discriminant capacity (75.4% - 97.5%) to determine unspecific and central obesity, in this order: unspecific obesity > central obesity. In this regard, mesomorphy showed the lowest sensitivity and specificity for both unspecific as well as central obesity (62.2% - 92.6%).
Table 2 Sensitivity and specificity of cutoff points for somatotype and body image to determine unspecific obesity (BMI ≥ 30 kg/m2).
| Endomorphy | Mesomorphy | Ectomorphy | BI-1 | BI-2 | BI-3 | BI-4 | |
|---|---|---|---|---|---|---|---|
| Cutoff point | 7.05 | 5.95 | 1.25 | 6.5 | 5.5 | 6.5 | 6.5 |
| Youden index | 1.798 | 1.754 | 1.94 | 1.64 | 1.47 | 1.74 | 1.67 |
| Sensitivity, % | 96.3 | 92.6 | 94.6 | 81 | 54 | 96 | 77 |
| Specificity, % | 83.5 | 82.9 | 100 | 83 | 93 | 78 | 90 |
| Total discriminant capacity, % | 94.4 | 94.0 | 97.5 | 91 | 82 | 92 | 92 |
Note: Analysis after ROC curves. BI-1 = How do I look? BI-2 = How do I want to look like? BI-3 = How do I think others see me? BI-4 = How am I seen by others?
Source: Author’s own elaboration
Table 3 Sensitivity and specificity of cutoff points for somatotype and body image to determine central obesity (WC: ≥ 80cm, women; ≥ 90 cm men).
| Endomorphy | Mesomorphy | Ectomorphy | BI-1 | BI-2 | BI-3 | BI-4 | |
|---|---|---|---|---|---|---|---|
| Cutoff point | 6.55 | 5.45 | 1.15 | 5.5 | 4.5 | 5.5 | 5.5 |
| Youden index | 1.724 | 1.408 | 1.696 | 1.62 | 1.41 | 1.60 | 1.65 |
| Sensitivity, % | 84 | 62.2 | 75 | 92 | 71 | 93 | 85 |
| Specificity, % | 89 | 78.6 | 94.6 | 70 | 70 | 67 | 80 |
| Total discriminant capacity, % | 92.0 | 75.4 | 92.3 | 88 | 76 | 89 | 89 |
Note: Analysis after ROC curves. BI-1 = How do I look? BI-2 = How do I want to look like? BI-3 = How do I think others see me? BI-4 = How am I seen by others?
Source: Author’s own elaboration
When body image was evaluated, cutoff points also had moderate to high discriminant capacity, but lower than those of somatotype (76% - 92%) and unspecific obesity > central obesity (Tables 2 and 3). In this context, How do I want to look like? showed the lowest sensitivity and specificity for both unspecific and central obesity (54%-93%); on the contrary, How do I think others see me? and How am I seen by others? were more sensitive and specific to determine both types of obesity (77% - 96%), except for the low specificity of How do I think others see me? for central obesity (67%). The body shape questionnaire presented a Cronbach alpha of 0.90.
Discussion
The main finding of the study is that predictive accuracy of both somatotype and body image are very good indicators of unspecific and abdominal obesity. The somatotype indicator had an accuracy in its prediction between 91% and 98% and the body image between 87% and 94%; a high reliability of the body image questionnaire used here was also observed (90%). In addition, somatotype showed moderate to very high sensitivity and specificity to determine unspecific obesity, (9% higher than central obesity (except mesomorphy for central obesity).
Somatotype, BMI, and WC are important components of body image, whereas body shape modifications impact in body image perception (Madrigal et al., 1999; Pulvers et al., 2004; Pulvers et al., 2013). In general, BMI and WC are used as a health status diagnostic and they characterize individuals with or without risk to develop cardiometabolic diseases; however, body image and somatotype have not been studied with that goal. Somatotype is currently used in sports to establish the physical fitness as well as the competition abilities of athletes (Gutnik et al., 2015), while body image is mainly used to know body dysmorphia and eating disorders (Garner et al., 1983; Madrigal et al., 1999).
Valdés-Badilla et al. (2015) reported low and moderate correlations (0.36 - 0.65) between somatotype and BMI or WC in physical education university students; while the results in non-sports individuals showed higher correlations for the same variables (0.70 - 0.85, data not shown), using their measurement methods but adjusting WC by height. Furthermore, endomorphy was the main component that determines both unspecific and central obesity, since endomorphy relates to fat mass (Norton & Old, 1996); then, the somatotype was validated as a tool to determine both types of obesity.
The sample here contained individuals with endo-mesomorphic somatotype and showed endomorphy higher than 6.5, mesomorphy higher than 5.4, and ectomorphy lower than 1.15; a similar pattern (endomorphy 6.3-8.5, mesomorphy 3.4-4.7, and ectomorphy 0.7-1.7) was reported by Xin, Jin, Tuo, Yuan & Ji (2013) but in subjects with metabolic diseases (hypertension, hyperlipemia, and diabetes). In the same context, endomorphy higher than 7.0, mesomorphy higher than 5.1, and ectomorphy lower than 1.4 in physically active hypertensive subjects have been reported (Almeida, Santos, Rodrigues, Carvalho & Batista, 2015). Since it is clear that central but not unspecific obesity is the main determinant of metabolic alterations (Janssen, Katzmarzyk & Ross, 2004), our findings of cutoff points for somatotype could be used to predict cardiometabolic risks in young adults, because they detect unspecific as well as central obesity. However, clinical trials are needed to know the advantage of relating somatotype with BMI or WC.
Body image in general shows a high sensitivity and specificity value (~80%), 3% higher for unspecific than abdominal obesity. In this regard, a very high sensitivity and specificity to determine thin vs overweight or obese individuals (> 90%) when comparing body image and BMI were described (Madrigal et al., 1999); however, no sensitivity to determine thin vs normal, and overweight vs obese (<50%) was reported (Madrigal et al., 1999).
In a different set of results (not shown), low to medium correlation was found between anthropometric variables (BMI and WC) vs body image (r = 0.41 - 0.75). Here the higher BMI or WC individuals see themselves or are being seeing by others with higher body weight; moreover, with higher the overweight or obesity individuals’ wish to look thinner (r = -0.79); then, 28% wish to have a BMI < 25 kg/m2 and 60% wish to have a lower body weight than the current one.
The cutoff points determined for body image, 5.5 - 6.5 in unspecific obesity and 4.5 - 5.5 in central obesity, suggest that the studied population perceive their body image differently than that reported in European populations (McElhone, Kearney, Giachetti, Zunft & Martínez, 1999; Ramos-Jiménez et al., 2017); in other words, our student population perceive themselves between 2 - 4 points thinner (without being so), since images 8 - 9 represent Europeans with BMI ≥ 30 kg/m2.
The last approach, How do I look like? was not the first option to identify unspecific or central obesity, but How do I think others see me? followed by How do I think others see me? (Figure 1b) were. By using exclusively BMI, similar data in an Afro-American population were reported (Pulvers et al., 2004; 2013).
Conclusions
The somatotype (Heath & Carter, 1967) and the body image questionnaire (Ramos-Jiménez et al., 2017) are two valid instruments with high sensitivity and specificity to determine unspecific and central obesity. Somatotypes of 6.55, 5.45, 1.15 (endomorphy, mesomorphy, and ectomorphy), or higher represent subjects with central obesity, and those of 7.05, 5.95, and 1.25 represent individuals with unspecific obesity. Self-images higher than 6 (Gardner, 1996) represent subjects with both unspecific and central obesity. Given the association of BMI with various metabolic diseases, the cutoff points for the somatotype and body image indicated here can be used as parameters to predict nonspecific and central obesity.

