


 text new page (beta)
 English (pdf)
 Article in xml format
 Article references
 Send this article by e-mail
 Cited by SciELO
  Similars in
SciELO
Similars in
SciELO 
 Permalink
Introduction
Innovation matters. According to the US Department of Commerce, technological innovation accounted for 75% of the Gross Domestic Product (GDP) growth in the US since the end of the World War II (Ezell & Atkinson, 2010). For Jalisco state, its cluster of the Information Technologies Sector located in the Metropolitan Zone of Guadalajara, Mexico (ITSMZG) represents such technological innovation. The ITSMZG develops new technologies in software design, TV, cinema, advertising for videogames, digital animation, interactive multimedia, and e-learning, among others. It has around 200 Information Technologies (IT) firms, that is, 20 000 jobs in the state that export 2000 billion USD annually on high value-added services, almost a third of the national total (Romo, 2014).
The ITSMZG has a high level of Open Innovation (OIN) practices, and the relationship with Big Data (BGD) represents a real challenge to adapt, implement, and measure, -especially for 500 ITSMZG specialists, including: chief executive officers of small and medium-sized enterprises (SME CEO) (100), back office (50) and front office managers (50), software designers (100), IT teachers (100), and managers of consultant firms (100); thereby, we asked which is the relationship between BGD on OIN?
To solve this, a survey was applied during the period January-April 2016. This was done in order to gather data and to analyze all the determinant factors related to improving the relationship between BGD on OIN. This is because the ITSMZG requires an empirical model as a first proposal to be adapted, applied, and measured, for instance, to identify the weak relationships among the factors and make suggestions for the improvement of the model and, consequently, the sector itself.
When the documentary research was started, some differences between the academic vision versus the expert vision were noticed; for this reason, the aim was to determine what they consist of in order to make a more consistent proposal; thereby, the following question was posed:
SQ1. Are there differences between the academic vision and the expert vision about OIN and BGD concepts?
On the other hand, the OIN incites to know what the collaboration, dynamics, etc., are like in the boundary with the BGD. In this sense, it is necessary to ask:
SQ2. How to analyze open innovation collaboration in terms of their boundaries, leverage, scope, structure, and dynamics?
Finally, we can foresee possible novel ways of interaction in the relationship OIN-BGD, and thus, it was solved:
Materials and Methods
As materials, the literature review was carried out, starting with conceptual definitions. For instance, OIN is defined:
Open innovation is a distributed innovation process based on purposively managed knowledge flows across organizational boundaries, using pecuniary and non-pecuniary mechanisms in line with each organization’s business model. These flows of knowledge may involve knowledge inflows to the focal organization (leveraging external knowledge sources through internal processes), knowledge outflows from a focal organization (leveraging internal knowledge through external commercialization processes) or both (coupling external knowledge sources and commercialization activities (Chesbrough & Bogers, 2014).
However, the challenges also call the attention of the quadruple helix model of innovation where civil society joins with business, academia, and government sectors to drive changes far beyond the scope of what any one organization can do on their own (Curley & Salmelin, 2012).
Related with OIN are the external/internal Knowledge Management (KMG) (Organization for Economic Co-operation and Development [OECD], 2003; 2008) flowing in the organization and the Open Business Model (OBM) that enables an organization to be more effective in creating as well as in capturing value (Chesbrough, 2007). Combinations of OIN and OBM generate interesting models to create and capture value, and they have not been specified enough before in the OIN literature (Vanhaverbeke & Chesbrough, 2014). But, how is OIN affected in the digital era? One of the insights is the Innovation Ecosystem (IEC), defined as an element that “models the economic rather than the energy dynamics of the complex relationships that are formed between actors or entities whose functional goal is to enable technology development and innovation” (Jackson, 2010). So, in this context, several actors are related, for instance: the material resources (funds, equipment, facilities, etc.) and the human capital (students, faculty, staff, industry researchers, industry representatives, etc.) that make up the institutional entities participating in the ecosystem (e.g., the universities, colleges of engineering, business schools, business firms, venture capitalists, industry-university research institutes, federal or industrial supported Centers of Excellence, and state and/or local economic development and business assistance organizations, funding agencies, policy makers, etc.) (Jackson, 2010). All the resources, human capital and all the relationships between people, the ways that they interact with each other in the context of their environment, and the systems of principles, rules, and norms that are set up to guide these interactions are gathered in one term: governance (Turton, Hatting, Claasen, Roux & Ashton, 2007).
One of the most outstanding factors driving the IEC is the information through BGD such as the ability to effectively manage information and extract knowledge as a key competitive advantage. Many organizations are building their core business on their ability to collect and analyze the information to extract business knowledge and insight. BGD technology adoption within the industrial sectors is not a luxury but an imperative need for most organizations to survive and gain competitive advantage (Cavanillas, Curry & Wahlster, 2015).
Designing the Model
In order to determine our proposal model, more than 40 papers (between 1993 and 2007) related with OIN and BGD were classified according to the variables more cited per author (Table 1) and frequency (Table 2).
Table 1 Authors and variables related with the OIN and BGD Factors.
Notes: (1) LSP= Leadership; (2) T&M= Training and Mentoring; (3) P&S= Policies and Strategies; (4) COM= Communication; (5) INC= Incentives; (6) KC&A= Knowledge capture & acquisition; (7) PKMG= Performance of KMG; (8) OIO= Open Innovation Orientation; (9) MKS= Market Segmentation; (10) VP= Value Proposition; (11) CRM= Customer Relationship; (12) CHN= Channels of Distribution; (13) RIPR= Revenue Streams for Intellectual Property Rights; (14) KYR= Key Resources; (15) KYA= Key Activities; (16) CST= Cost; (17) PTS= Partnership; (18) TEC= Technology; (19) STR= Strategy; (20) NWE= New Entrepeneurships; (21) POBM= Performance of OBM; (22) RSK= Risk; (23) OIEC= Opportunities of Innovation Ecosystem; (24) TIEC= Threats of Innovation Ecosystem; (25) GOV= Governance; (26) PIEC=- Performance of IEC; (27) BVC=- Big Data Value Chain; (28) DTQ=- Data Quality; (29) CBG=- Characteristics of Big Data; (30) PBGD=- Performance of Big Data
Source: Author’s own elaboration.
Table 2 Variables and their frequencies, representing the OIN and BGD Factors
| ID | Variables | Authors numbered as in Table 1 | Total | ||||||||||||||||||||||
|---|---|---|---|---|---|---|---|---|---|---|---|---|---|---|---|---|---|---|---|---|---|---|---|---|---|
| 1 | 2 | 3 | 4 | 5 | 6 | 7 | 8 | 9 | 1 0 |
1 1 |
1 2 |
1 3 |
1 4 |
1 5 |
1 6 |
1 7 |
1 8 |
1 9 |
2 0 |
2 1 |
2 2 |
2 3 |
|||
| 1 | LSP | X | X | X | X | 4 | |||||||||||||||||||
| 2 | T&M | X | X | X | X | 4 | |||||||||||||||||||
| 3 | P&S | X | X | X | X | 4 | |||||||||||||||||||
| 4 | COM | X | X | X | X | X | 5 | ||||||||||||||||||
| 5 | INC | X | X | X | 3 | ||||||||||||||||||||
| 6 | KC&A | X | X | X | X | 4 | |||||||||||||||||||
| 7 | PKMG | X | X | X | 3 | ||||||||||||||||||||
| 8 | OIO | X | X | X | X | 4 | |||||||||||||||||||
| 9 | MKS | X | X | X | 3 | ||||||||||||||||||||
| 10 | VP | X | X | X | X | 4 | |||||||||||||||||||
| 11 | CRM | X | X | X | 3 | ||||||||||||||||||||
| 12 | CHN | X | 1 | ||||||||||||||||||||||
| 13 | RIPR | X | X | 2 | |||||||||||||||||||||
| 14 | KYR | X | X | X | 3 | ||||||||||||||||||||
| 15 | KYA | X | X | 2 | |||||||||||||||||||||
| 16 | CST | X | 1 | ||||||||||||||||||||||
| 17 | PTS | X | X | X | 3 | ||||||||||||||||||||
| 18 | TEC | X | 1 | ||||||||||||||||||||||
| 19 | STR | X | X | 2 | |||||||||||||||||||||
| 20 | NWE | X | X | 2 | |||||||||||||||||||||
| 21 | POBM | X | X | X | 3 | ||||||||||||||||||||
| 22 | RSK | X | 1 | ||||||||||||||||||||||
| 23 | OIEC | X | X | X | 3 | ||||||||||||||||||||
| 24 | TIEC | X | X | 2 | |||||||||||||||||||||
| 25 | GOV | X | X | 2 | |||||||||||||||||||||
| 26 | PIEC | X | X | X | 3 | ||||||||||||||||||||
| 27 | BVC | 0 | |||||||||||||||||||||||
| 28 | DTQ | 0 | |||||||||||||||||||||||
| 29 | CBG | 0 | |||||||||||||||||||||||
| 30 | PBGD | X | X | X | 3 | ||||||||||||||||||||
| ID | Variables | Authors numbered as in Table 1 | TOTAL | ||||||||||||||||||||||
| 24 | 25 | 26 | 27 | 28 | 29 | 30 | 31 | 32 | 33 | 34 | 35 | 36 | 37 | 38 | 39 | 40 | 41 | 42 | 43 | XX | X X | X X | |||
| 1 | LSP | 4 | |||||||||||||||||||||||
| 2 | T&M | 4 | |||||||||||||||||||||||
| 3 | P&S | 4 | |||||||||||||||||||||||
| 4 | COM | 5 | |||||||||||||||||||||||
| 5 | INC | 3 | |||||||||||||||||||||||
| 6 | KC&A | 4 | |||||||||||||||||||||||
| 7 | PKMG | 3 | |||||||||||||||||||||||
| 8 | OIO | 4 | |||||||||||||||||||||||
| 9 | MKS | X | 4 | ||||||||||||||||||||||
| 10 | VP | 4 | |||||||||||||||||||||||
| 11 | CRM | 3 | |||||||||||||||||||||||
| 12 | CHN | 1 | |||||||||||||||||||||||
| 13 | RIPR | X | X | 4 | |||||||||||||||||||||
| 14 | KYR | 3 | |||||||||||||||||||||||
| 15 | KYA | X | X | 4 | |||||||||||||||||||||
| 16 | CST | X | 2 | ||||||||||||||||||||||
| 17 | PTS | X | X | X | 6 | ||||||||||||||||||||
| 18 | TEC | X | X | 3 | |||||||||||||||||||||
| 19 | STR | X | X | X | 5 | ||||||||||||||||||||
| 20 | NEW | 2 | |||||||||||||||||||||||
| 21 | POBM | 3 | |||||||||||||||||||||||
| 22 | RSK | X | X | 3 | |||||||||||||||||||||
| 23 | OIEC | X | X | X | X | 7 | |||||||||||||||||||
| 24 | TIEC | X | X | 4 | |||||||||||||||||||||
| 25 | GOV | 2 | |||||||||||||||||||||||
| 26 | PIEC | 3 | |||||||||||||||||||||||
| 27 | BVC | X | X | X | 3 | ||||||||||||||||||||
| 28 | DTQ | X | X | X | 3 | ||||||||||||||||||||
| 29 | CBG | X | X | X | 3 | ||||||||||||||||||||
| 30 | PGBD | 3 | |||||||||||||||||||||||
| TOTAL | 106 | ||||||||||||||||||||||||
Source: Author’s own elaboration.
The qualitative part of this research was started applying the focus group technique with the Delphi’s Panel and Analytic Hierarchy Process (AHP) (Saaty, 2002) to 6 ITSMZG specialists (1 SME CEO; 1 back office; 1 front office manager and 1 software designer; 1 IT teacher; and 1 consultant), focusing their attention and experience to get some suggestions, in order to determine the best grouping of factors, the variables (academic vision), and the best names to associate them to the OIN and BGD (expert vision). In this sense, the final variable grouping names for OIN were identified as KMG, OBM, and IEC. For the BGD, these were identified as BVC, DTQ and CBG (Table 3).
Table 3 Focus group by Delphi’s Panel and AHP to determine the main groups of variables of OIN and BGD
| Objective | Open Innovation (OIN) Factor | ||||||
|---|---|---|---|---|---|---|---|
| ID | Factor as expert vision | Variables | Factor as academic vision | AHP weighing as expert vision (%) | %Difference (academic vision-expert vision) | ||
| Frequency | % | ||||||
| Alternatives | 1 | KMG | LSP | 4 | 4.26 | 6.9 | -2.64 |
| 2 | T&M | 4 | 4.26 | 6.8 | -2.54 | ||
| 3 | P&S | 4 | 4.26 | 5.4 | -1.14 | ||
| 4 | COM | 5 | 5.32 | 5.4 | -0.08 | ||
| 5 | INC | 3 | 3.19 | 5 | -1.81 | ||
| 6 | KC&A | 4 | 4.26 | 4.9 | -0.64 | ||
| 7 | PKMG | 3 | 3.19 | 2.9 | 0.29 | ||
| 8 | OBM | OIO | 4 | 4.26 | 5.2 | -0.94 | |
| 9 | MKS | 4 | 4.26 | 4.6 | -0.34 | ||
| 10 | VP | 4 | 4.26 | 4.7 | -0.44 | ||
| 11 | CRM | 3 | 3.19 | 4.6 | -1.41 | ||
| 12 | CHN | 1 | 1.06 | 4.5 | -3.44 | ||
| 13 | RIPR | 4 | 4.26 | 4.9 | -0.64 | ||
| 14 | KYR | 3 | 3.19 | 4.2 | -1.01 | ||
| 15 | KYA | 4 | 4.26 | 4.8 | -0.54 | ||
| 16 | CST | 2 | 2.13 | 3.9 | -1.77 | ||
| 17 | PTS | 6 | 6.38 | 2.1 | 4.28 | ||
| 18 | TEC | 3 | 3.19 | 3 | 0.19 | ||
| 19 | STR | 5 | 5.32 | 2 | 3.32 | ||
| 20 | NWE | 2 | 2.13 | 2.3 | -0.17 | ||
| 21 | POBM | 3 | 3.19 | 1.9 | 1.29 | ||
| 22 | IEC | RSK | 3 | 3.19 | 2.5 | 0.69 | |
| 23 | OIEC | 7 | 7.45 | 2 | 5.45 | ||
| 24 | TIEC | 4 | 4.26 | 3 | 1.26 | ||
| 25 | GOV | 2 | 2.13 | 1.5 | 0.63 | ||
| 26 | PIEC | 3 | 3.19 | 1 | 2.19 | ||
| Total | 94 | 100 | 100 | ||||
| Objective | Big Data (BGD) Factor | ||||||
| ID | Factor as expert vision | Variables | Factor as academic vision | AHP weighing as expert vision (%) | %Difference (academic vision- expert vision) | ||
| Frequency | % | ||||||
| Alternatives | 27 | BGD | BVC | 3 | 25 | 30 | -5 |
| 28 | DTQ | 3 | 25 | 40 | -15 | ||
| 29 | CBG | 3 | 25 | 20 | 5 | ||
| 30 | PBGD | 3 | 25 | 10 | 15 | ||
| TOTAL | 13 | 100 | 100 | ||||
Source: Author’s own elaboration.
Thereby, all the determined factors and variables were set to explain our general conceptual model of OIN and BGD through the literature review.
Knowledge Management (KMG)
Knowledge Management “covers any intentional and systematic process or practice of acquiring, capturing, sharing, and using productive knowledge, wherever it resides, to enhance learning and performance in organizations” (Scarbrough, Swan & Preston, 1999, as cited in OECD, 2003). Hence, a model is proposed based on the strong leadership (LSP) of its members (Mejía-Trejo, Sanchez-Gutierrez & Ortiz-Barrera, 2013; OECD, 2003), who are able to establish different mechanisms of communications (COM) (Chatenier et al., 2010; OECD 2003) to transmit the explicit and tacit knowledge, including training the personnel and mentoring the apprentices (T&M) with policies and strategies (P&S) about rewards and incentives (INC) to the personnel in inbound and outbound knowledge frontiers of the firm (Asakawa et al., 2010; OECD, 2003; West & Bogers, 2014). To do a best knowledge capture and acquisition (KC&A) (Crespin-Mazet, 2014; Gassman & Enkel, 2004; OECD, 2003; Goglio-Primard & Keupp & Gassman, 2009), incentives for the operative personnel is recommended (Allarakhia et al., 2010; OECD, 2003), achieving an OIN key performance indicator according to the context of the business (Chien-Tzu & Wan-Fen, 2014; Lichtenthaler, 2015; Parmented, 2010).
Therefore, the first hypothesis (H1) is:
The higher the level of BGD, the higher the level of KMG in OIN of ITSMZG.
Open Business Model (OBM)
It is here considered the Osterwalder & Pigneur (2010) definition of business model, as: “A business model describes the rationale of how an organization creates, delivers, and captures value”. So, with the increased adoption of open innovation practices, open business models have emerged as a new design theme (Chesbrough, 2006). Therefore, in this work it is proposed an OBM concept based on KMG necessary to potentiate the OIN Orientation (OIO) by the definition of exploring it, experimenting with new alternatives and/or exploiting it, as well as refining and extending of the existing knowledge (Beckman et al., 2004; Chien-Tzu & Wan-Fen, 2014) and what kind of driver is using, for example: the purchase of technology, the licensing, etc. (EIRMA, 2003; OECD, 2008). The market segmentation (MKS) acts as the basis to define the specialized services and products offered to the customer (Osterwalder & Pigneur, 2010) and represents the opportunity to analyze different applications of technology besides the current market such as the discovering and developing of new markets or for licensing other Firms’ Market (Chesbrough, 2003; OECD, 2008). The value proposition (VP) is the core of any business, so it should be emphasized in different forms, like branding, performance, newness, etc. (Osterwalder & Pigneur, 2010) and make the user a source of innovation to create value, a tool to capture value (Chesbrough, 2003; Van der Borgh et al., 2012; Von Hippel, 2005). The customer relationship management (CRM), as a tool, must be applied in different channels (CHN), own & partners, in all its different forms, such as personal service, automated-service, self-service, etc. (OECD, 2008; Osterwalder & Pigneur, 2010), emphasizing the co-creation (Rayna & Styriukova, 2014) in network. The revenues streams (RIPR) represent a great chance for the organizations based on the intellectual property rights (IPR) protection as patents, trademarks, and copyrights for commercializing them using patent pools or cross-licensing portfolios, for instance (OECD, 2008).
The key resources (KYR) must be recognized (Asakawa et al., 2010; Gassman, 2006; Osterwalder & Pigneur, 2010) involving tangible (buildings, infrastructure, labs, etc.) and intangible (data, information, talent personnel, etc.) assets. The key activities (KYA), mainly the R&D network, Should be more productive based on absorptive capacity features, knowledge, and technology (Chesbrough & Teece, 2002; Enkel et al. 2009; OECD, 2008; Schwaag-Serger 2006).
The minimum of the costs (CST) are related with fixed-cots, economy-scale, economy-scope, etc. (Remneland-Wikhamn & Knights, 2012). The Partnerships (PTS) represent a solid base to make business, involving the relationship University-Government-Organization (triple helix) (Etzkowitz & Leydesdorff, 1995; Gassman, 2006; OECD, 2008; Tidd, 2006) and, recently, the society (Miller et al., 2016).
The technology (TEC) acts as an important agent in the OBM, due to its capacity to incorporate it in an external or internal way into the organization and aimed to the current or different markets (Chesbrough, 2003; Chesbrough & Crowther, 2006).
The strategy (STR) was applied in different ways: Market-Based Innovation; Crowd-Based Innovation Strategies or Collaborative Innovation; Network-Based Innovation Strategies (Gassmann et al., 2010; Hopkins et al., 2011; Saebi & Foss, 2013; Yun-Hwa & Kuang-Peng, 2010), according to different final goals to implement such as: improvement of revenues, performance, competitive advantage or, even more, ensure the secrecy, etc. (Asakawa et al., 2010; Cohen et al., 2002; OECD, 2008; Rohrbeck et al., 2009).
Finally, the new entrepreneurships (NWE) successfully achieved are a good indicator of any OBM, such as the spin-in, spin-out and spin-off in a certain period. According to the context of the business, an OBM key performance indicator (POBM) was determined (Chien-Tzu & Wan-Fen, 2014; Lichtenthaler, 2015; Parmented, 2010).
Therefore, the second hypothesis (H2) is:
The higher the level of BGD, the higher the level of OBM in OIN of ITSMZG.
Innovation Ecosystem (IEC)
Innovation Ecosystem is considered as “a network of interconnected organizations, organized around a focal firm or a platform, and incorporating both production and use side participants, and focusing on the development of new value through innovation” (Deloitte, 2015). This IEC in the model is proposed with the next elements to analyze the types of risk (RSK), such as the cost, the infringement litigation with other companies in similar and/or different product markets, etc. (OECD, 2008; Sieg et al., 2010; Tidd, 2006). The opportunities (OIEC) are based on the potential of how well knowledge flows and how well the system is connected, a greater sense of urgency for internal groups to act on ideas or technology, opportunity to refocus some internal resources on finding, screening and managing implementation, etc. (Docherty, 2006; Goglio-Primard & Crespin-Mazet, 2014; Holmes & Smart, 2009; Nelson, 1993; OECD, 2008; Van der Borgh et al., 2012).
Threats (TIEC), involve all the extra costs of managing co-operation with external partners, the lack of control, the potentially opportunistic behavior of partners, (Goglio-Primard & Crespin-Mazet, 2014; Van der Borgh et al., 2012), the adverse impact of flexibilities, the overdependence of partners, etc. (Holmes & Smart, 2009). A governance system (GOV) is able to be elected and recognized as a key factor for applying the principles of behavioral rules that support and regulate all the transactions by means of written rules, the process of election of central governance, establishing roles and responsibilities to make decisions, etc., in order to achieve an IEC key performance indicator (PIEC) and according to the context of the business (Chien-Tzu & Wan-Fen, 2014; Lichtenthaler, 2015; Parmented, 2010).
Therefore, the third hypothesis (H3) is:
The higher the level of BGD, the higher the level of IEC in OIN of ITSMZG.
Big Data (BGD)
Big data is high volume, high velocity, and/or high variety of information assets that require new forms of processing to enable enhanced decision-making, insight discovery, and process optimization (Manyika et al., 2011). Therefore, there are very important concepts involving the big data such as BVC (Curry, 2014). This is a proposal that can be used to model the high-level activities that comprise an information system. The BVC identifies the following key high-level activities:
-Data Acquisition is the process of gathering, filtering, and cleaning data before it is put in a data warehouse or any other storage solution on which data analysis can be carried out.
-Data Analysis is concerned with making the raw data acquired amenable to use in decision-making as well as domain-specific usage. It involves exploring, transforming, and modeling data with the goal of highlighting outstanding data, synthesizing and extracting useful hidden information with high potential from a business point of view.
-Data Duration is the active management of data over its lifecycle to ensure it meets the necessary data quality requirements for its effective usage. It can be categorized into different activities such as content creation, selection, classification, transformation, validation, and preservation.
-Data Storage is the persistence and management of data in a scalable way that satisfies the needs of applications that require fast access to the data.
-Data Usage covers the data-driven business activities that need access to data, its analysis, and the tools needed to integrate the data analysis within the business activity.
Another important concept is over the data quality. The OECD (2011) defines the following seven dimensions of DTQ:
-Relevance: It is characterized by the degree to which the data serves to address the purposes for which users seek them.
-Accuracy: It is the degree to which the data correctly estimate or describe the quantities or characteristics they are designed to measure.
-Credibility: It is the credibility of data products. It refers to the confidence that users place in those products based simply on their image of the data producer.
-Timeliness: It reflects the length of time between their availability and the event or phenomenon they describe, but it is considered in the context of the time period that permits the information to be of value and still acted upon.
-Accessibility: It reflects how readily the data can be located and accessed.
-Interpretability: It reflects the ease with which the user may understand and properly use and analyze the data.
-Coherence: It reflects the degree to which they are logically connected and mutually consistent.
Big data brings together a set of data management challenges for working with data under new scales of size and complexity. Many of these challenges are not new. What is new however are the challenges raised by the specific characteristics of big data (CBG) related to the 3 V’s (Curry, 2014; Tableau, 2017):
-Volume (amount of data): dealing with large scales of data within data processing (e.g., Global Supply Chains, Global Financial Analysis, Large Hadron Collider).
-Velocity (speed of data): dealing with streams of high frequency of incoming real-time data (e.g., Sensors, Pervasive Environments, Electronic Trading, Internet of Things).
-Variety (range of data types/sources): dealing with data using differing syntactic formats (e.g., Spreadsheets, XML, DBMS), schemas, and meanings (e.g., Enterprise Data Integration).
The V’s of big data challenge the fundamentals of existing technical approaches and require new forms of data processing to enable enhanced decision-making, insight discovery, and process optimization in order to achieve a BGD key performance indicator (PBGD) according to the context of the business (Chien-Tzu & Wan-Fen, 2014; Lichtenthaler, 2015; Parmented, 2010).
Therefore, the forth hypothesis (H4) is: the higher the level of BGD, the higher the level of OIN of ITSMZG.
So, in Figure 1 and Table 4 the Final Questionnaire is proposed.
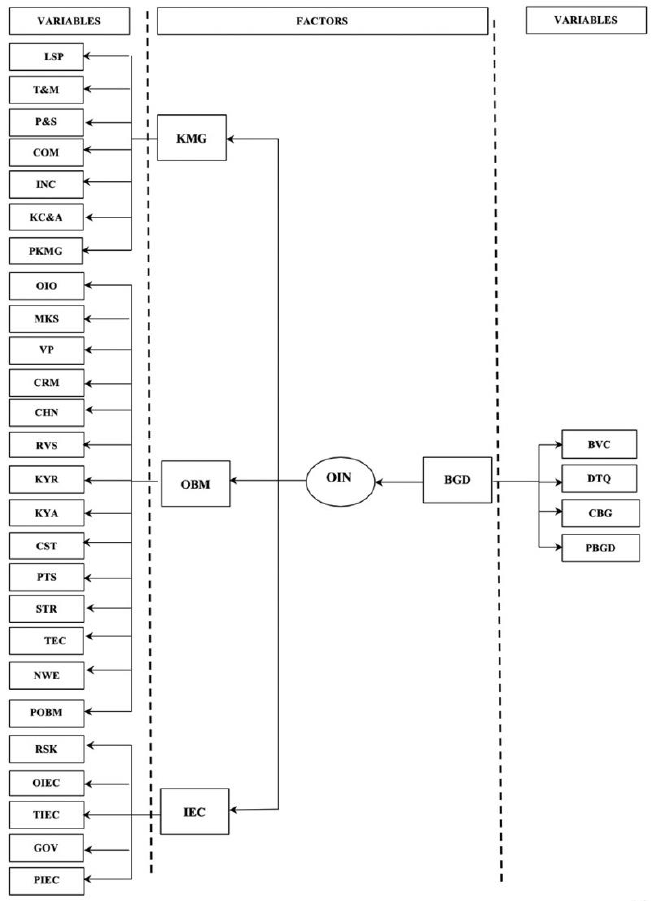
Table 4 The Final Questionnaire
| Open Innovation Factor (OIN) | ||
| Knowledge Management (KMG) Factor | ||
| Variables | Indicador | Author(s) |
| (1) LSD | 1.-KM practoces were a responsibility of managers and executives | OECD (2003); Asakawa et al. (2010); West & Bogers (2014); Mejia-Trejo et al. (2013) |
| 2.-KM practices were explicit criteria for assessing worker performance | ||
| 3.-KM practices were a responsibility of non-management workers. | ||
| 4.-KM practices were responsibility of the KMO | ||
| (2) T&M | 5.-Firm encouraged experienced workers to transfer their knowledge to new or less experienced workers | |
| 6.-Firm provided informal training related to KM | ||
| 7.-Firm encouraged workers to continue their education by reimbursing tuition fees for successfully completed work-related courses | ||
| 8.-Firm offered off-site training to workers in order to keep skills current | ||
| 9.-Firm provided formal training related to KM practices | ||
| 10.-Firm used formal mentoring practices, including apprenticeships | ||
| (3) P&S | 11.-Policies or programs intended to improve worker retention | |
| 12.-Values system or culture intended to promote knowledge sharing | ||
| 13.-It’s written KM (internal-external) policy or strategy | ||
| (4) COM | 14.-Workers are sharing knowledge with written documentation | |
| 15.-Workers are sharing knowledge by regularly updating all the databases of their projects | ||
| 16.-Workers are sharing knowledge in collaborative work in virtual teams | Chatenier et al. (2010); OECD (2003) | |
| (5) INC | 17.-Knowledge sharing is rewarded with monetary incentives | OECD (2003); Allarakhia et al. (2010) |
| 18.-Knowledge sharing is rewarded with non-monetary incentives | ||
| 19.-You have a reward system to support the flow of know-how between units external and internal or dual embeddedness | OECD (2008) | |
| (6) KC&A | 20.-You have a source of external knowledge based on: partnerships with external parties (alliances, joint ventures, joint development, acquisition or sale of knowledge (contract, R&D, licensing), corporate venturing (equity investments in university spin offs or in venture capital investment funds), etc.) | Gassman & Enkel (2004); OECD (2003); Goglio-Primard & Crespin-Mazet (2014); Keup & Gassman (2009) |
| 21.-You have a source of internal knowledge based on in house innovations | ||
| (7) PKMG | 22.- The capture and acquisition of knowledge is based on decisions about the measure of remarkable improvement and performance of the KM | Parmented (2010); Lichtenthaler (2015); Chien-Tzu & Wan-Fen (2014) |
| Open Business Model (OBM) Factor | ||
| Variable | Indicator | Author(s) |
| (8) OIO | 23.-Select the right answer -Your OBM is oriented more exploration in innovation -Your OBM is oriented more to exploitation in innovation |
Beckman et al. (2004); Chien-Tzu & Wan-Fen (2014) |
| 25.-Put the order to the following sentences
where 1 is the most important Your OBM in open innovation mode is based on: __Purchase of technology __Joint venturing and alliances __Joint development __Contract R&D __Licensing __Collaborations with universities __Equity in university spin offs __Equity in venture capital investment funds __Purchase of technology |
EIRMA (2003); OECD (2008) | |
| (9) MKS | 26.-Put the order to the following sentences
where 1 is the most important Your OBM determines the real needs of its consumers, classifying them on: __Mass market __Niche market __Segmented __Diversified __Multisided platforms-markets |
Osterwalder & Pigneur (2010) |
| 27.- Put the order to the following sentences
where 1 is the most important Your OBM is only focused an makes surveillance for: __Your current market __Discovering and developing new markets __Licensing other Firms’ Market |
OECD (2008); Chesbrough (2003) | |
| (10) VP | 28.- Put the order to the following sentences
where 1 is the most important Your OBM offers VP through __Newness __Performance __Customization __Design __Brand __Price __Cost reduction __Risk reduction __Accessibility, __Convenience/usability |
Osterwalder & Pigneur (2010) |
| 29. Your OBM lead the VP based on User Innovation (Create Value) as a tool of Open Innovation (Capture Value) | Von Hippel (2005); Chesbrough (2003); Van der Borgh et al. (2012) | |
| (11) CRM | 30.-Put the order to the following sentences
where 1 is the most important Your OBM is seeking to deliver requirements to your costumers applying: __Personal assistance __Dedicated personal assistance __Self service __Automated service __Communities |
Osterwalder & Pigneur (2010); OECD (2008) |
| __Co-creation | Rayna & Styriukova (2014); Osterwalder & Pigneur (2010) | |
| (12) CHN | 31.- Put the order to the following sentences
where 1 is the most important Your OBM is seeking to be very closed to the delivery of the services to your customers using: __Its own channels __Its partner’s channels |
Osterwalder & Pigneur (2010); OECD (2008) |
| (13) RIPR | 32.- Put the order to the following sentences
where 1 is the most important Your OBM applies revenue stream of IPR by mean of: __Financial assets licensing and/or building an Intellectual Capital Portfolio to exploitation __Usage fee __Subscription fees __Lending/renting/leasing __Licensing __Bokerage fee __Advertising |
|
| 33.-Put the order to the following sentences
where 1 is the most important Your OBM applies revenue stream of IP by means of: __Trade secrets __Patent pools __Cross-licensing |
OECD (2008) | |
| (14) KYR | 33.-Put the order to the following sentences
where 1 is the most important Your OBM use all yours: __Physical key resources (buildings, labs, sites, network etc.) __Intellectual key resources (relationships, databases, information systems, etc.) __Human key resources (its personnel) __Financial key resources |
Osterwalder & Pigneur (2010) |
| 34.- Put the order to the following sentences
where 1 is the most important Your OBM considers: __The rapid shift of industry and technology borders, to pose new business models |
Gassman (2006); Asakawa et al. (2010) | |
| __The knowledge as a factor of competitive advantage. | ||
| __That a more interdisciplinary cross boarder research more partnership for innovation | ||
| (15) KYA | 35.- Put the order to the following sentences
where 1 is the most important Your OBM uses all yours: __Production key activities __Problem solving key activities __Platform network key activities |
Osterwalder & Pigneur (2010) |
| __ R&D located under cluster and networks innovation systems with geographical proximity because the spillovers often occur by this. | OECD (2008); Enkel et al. (2009) | |
| 36.- Put the order to the following sentences
where 1 is the most important Your OBM is making activities for: __A great awareness to invest in own R&D because the importance of absorptive capacity |
OECD (2008) | |
| __For R&D investments in other countries, because is more the available the pool of scientist, clusters and academic institutes, than the near to markets and production facilities | Schwaag-Serger (2006) | |
| __For attracting technology sourcing mainly, in locating the R&D activities outside the home country, and the geographic dispersion a means of knowledge creation rather than knowledge diffusion | ||
| __For attracting the share of codified information and co-ordination of activities among different parties because is easier for innovations that can be pursued independently (autonomous innovation). | Chesbrough & Teece (2002) | |
| __To have benefits only realized in conjunction with complementary innovations. Your product lifecycle is long. Less attractive | ||
| (16) CST | 37.-Put the order to the following sentences
where 1 is the most important Your OBM minimizes your cost through: __Cost-driven __Value-driven __Fixed costs __Variable costs, __Economies of scale __Economies of scope |
Osterwalder & Pigneur (2010); Remneland-Wikhamn & Knights (2012) |
| (17) PTS | 38.- Put the order to the following sentences
where 1 is the most important Your OBM is seeking partners to support: __Optimization and economy of scale global industries results, powerful standards and dominant designs. (Globalization) __Reduction of risk and uncertainty, and acquisition of particular resources and activities |
Osterwalder & Pigneur (2010); OECD (2008); Gassman (2006) |
| __New developments in and around their industry owing is based on an industry characterized by rather short technology life cycles | OECD (2008b); Osterwalder & Pigneur (2010) | |
| __Suppliers, customers, universities, etc., even in cross countries, in an innovation ecosystem | Gassman (2006) | |
| 39.-Your OBM is seeking the relation amongst: University-Industry-Government (the triple helix) because the collaborative innovation activities stimulate innovation; even more you’re considering the social aspect (quadruple helix) benefits | Etzkowitz & Leydesdorff (1995); Tidd (2006); OECD (2008); Miller et al. (2016) | |
| 40.-Your OBM seeking use venturing to find external partners for commercializing innovations that are not used internally (divestment, spin-out, spin-off) | ||
| (18) TEC | 41.- Put the order to the following sentences
where 1 is the most important You’re implementing internal technology for your: __Current market __New markets __Another Firm’s market |
Chesbrough (2003) |
| 42.- Put the order to the following sentences
where 1 is the most important You’re implementing internal/external venture handling technology to: __Your current market __The new markets __The other Firm’s Market 43.- Put the order to the following sentences where 1 is the most important You´re implementing external technology for: __Current market __New markets __Another Firm’s market | ||
| 44.- Put the order to the following sentences
where 1 is the most important You’re implementing external technology insourcing to: __Your current market __To the new markets __The other Firm’s market | ||
| 45.-You’re on permanent surveillance for
external technology to bring to the company 46.-You’re on permanent surveillance for IPR of other technologies 47.- Put the order to the following sentences where 1 is the most important You’re implementing: __Technology opportunistically __Technology in formal and systematic way. __Alternatives technologies __Technologies with enough incentives __Technologies to address an incremental product improvement __More proven technologies than new ones __More proven technologies more than trying to develop entirely new __External technologies because they represent more benefits __Internal technologies because they represent more benefits |
Chesbrough & Crowther (2006) | |
| (19) STR | 48.-Put the order to the following sentences
where 1 is the most important Your STR is designed on: __ Efficiency-Centric Open Business Model; hence you pose Market-Based Innovation Strategies) __User-Centric Open Business Model; hence you pose Crowd-Based Innovation Strategies __Collaborative Open Business Model; hence you pose Collaborative Innovation Strategies. __ Open Platform Business Model; hence you pose Network-Based Innovation Strategies |
Saebi & Foss (2013); Gassmann et al. (2010); Yun-Hwa & Kuang-Peng (2010); Hopkins et al. (2011) |
| 49.-Put the order to the following sentences
where 1 is the most important Your STR to do IPR protection registration is due: __To preventing copy __To preventing other companies from patenting (e.g., prevent blocking) __To prevent lawsuits __To use for negotiations __To enhance of reputation __To generate licensing revenue __To measure the performance |
Cohen et al. (2002); Asakawa et al. (2010) | |
| __To get competitive advantage | Rohrbeck et al.(2009) | |
| 50.-Your strategy to protect your IPR is based entirely by the industrial trade secrecy | OECD (2008) | |
| (20) NEW | 51.-You’ve got spin in as: an investment in technology start-ups (e.g. university spin offs) | OECD (2008) |
| 52.-You’ve got spin out as: divesting internally developed technologies relates to the inside-out aspect of open innovation | ||
| 53.-You’ve got spin off as: the company no longer maintains a stake in the project/company. | ||
| (21) POBM | 54.-Your strategy is based on about the measure of remarkable improvement and performance of the OBM | Parmented (2010); Lichtenthaler (2015); Chien-Tzu & Wan-Fen (2014) |
| Innovation Ecosystem (IEC) Factor | ||
| Variables | Indicator | Author(s) |
| (22) RSK | 55.-You avoid the risk of costs using innovation intermediaries | OECD (2008); Sieg et al. (2010) |
| 56.-Your management of the creation of cross-licensing agreements involving the exchange of two or more patent portfolios to allow mutual use of patents by multiple patent holders in order to avoid risk of patent infringement | ||
| 57.-Your innovation network considers the theft of IPR as the most important risk to global open innovation networks even with external partners that may later become competitors | ||
| 58. Put the order to the following sentences
where 1 is the most important Your innovation network involves: __Similar companies that focus on tactical innovation issues where the success depends on their ability to share experience, disclose information and develop trust and transparency __Collaboration between companies from a single industry or adjacent industries that co-operate to explore and create new products and processes __Collaboration between companies from different industries that co-operate to explore and create new products and processes, where sharing of information and risk __Heterogeneous companies that focus on tactical innovation issues where the success depends on their ability to share experience, disclose information and develop trust and transparency |
Tidd (2006) | |
| (23) OIEC | Put the order to the following sentences where
1 is the most important 59.- You’ve got open innovation network: __For opportunity from recognizing the potential of innovation depends on how well knowledge flows __For the benefits from maximizing the transference of tacit knowledge residing in national innovation system |
OECD (2008) |
| __For benefits from the ability to leverage R&D developed outside | Docherty (2006); OECD (2008); Goglio-Primard & Crespin-Mazet (2014) | |
| __For the benefits from extended reach and capability for new ideas and technologies and create value through the knowledge | Van der Borgh et al. (2012) | |
| __For the benefits from: the opportunity to refocus some internal resources on finding, screening and managing implementation | Docherty (2006); OECD (2008); Goglio-Primard & Crespin-Mazet (2014) | |
| __For the benefits from: the improved payback on internal R&D through sales or licensing of otherwise unused intellectual property | ||
| __A greater sense of urgency for internal groups to act on ideas or technology | ||
| __For the benefits from: the ability to conduct strategic experiments with less risk | ||
| __For the benefits from: over time, the opportunity to create a more innovative culture | ||
| (24) TIEC | __Threats from: the extra costs of managing co-operation with external partners | |
| 60.- Put the order to the following sentences
where 1 is the most important You’ve perceived or experienced open innovation network threats from: __The lack of control | ||
| __The adverse impact of flexibility | ||
| __The overdependence on external parties | ||
| __The potentially opportunistic behavior of partners | ||
| (25) GOV | 61.-You recognize the need to have written rules to exchange the information in the innovation ecosystem | Deloitte (2015); Chatenier et al. (2010) |
| 62.-You participate in the election of central governance system | ||
| 63.-You participate in the development of operating procedures, that include standards for collecting, storing, and sharing data | ||
| (26) PIEC | 64.- You consider the governance is able to make decisions based on the measure of remarkable improvement and performance of the IEC | Parmented (2010); Lichtenthaler (2015); Chien-Tzu & Wan-Fen (2014) |
| Big Data (BGD) Factor | ||
| Variable | Indicator | |
| (27) BVC | 65.- Put the order to the following sentences
where 1 is the most important You’re using the BVC, to support your OIN, by: ___Data Acquisition as the process of gathering, filtering, and cleaning data before it is put in a data warehouse or any other storage solution on which data analysis can be carried out. __Data Analysis is concerned with making the raw data acquired amenable to use in decision-making as well as domain-specific usage. It involves exploring, transforming, and modeling data with the goal of highlighting outstanding data, synthesizing and extracting useful hidden information with high potential from a business point of view. __Data Duration is the active management of data over its life cycle to ensure it meets the necessary data quality requirements for its effective usage. It can be categorized into different activities such as content creation, selection, classification, transformation, validation, and preservation. __Data Storage as the persistence and management of data in a scalable way that satisfies the needs of applications that require fast access to the data. __Data Usage covers the data-driven business activities that need access to data, its analysis, and the tools needed to integrate the data analysis within the business activity. |
Cavanillas et al. (2015);Curry (2014); Tableau (2017); OECD (2011) |
| (28) DTQ | 66.- Put the order to the following sentences
where 1 is the most important You’re using the DTQ, to support your OIN: __ Relevance: It is characterized by the degree to which the data serves to address the purposes for which users seek them. __ Accuracy: It is the degree to which the data correctly estimate or describe the quantities or characteristics they are designed to measure. __Credibility: It is the credibility of data products refers to the confidence that users place in those products based simply on their image of the data producer. __Timeliness: It reflects the length of time between their availability and the event or phenomenon they describe, but it considered in the context of the time period that permits the information to be of value and still acted upon. __Accessibility: It reflects how readily the data can be located and accessed. __Interpretability: It reflects the ease with which the user may understand and properly use and analyze the data.; and __Coherence: It reflects the degree to which they are logically connected and mutually consistent. |
|
| (29) CBG | 67.- Put the order to the following sentences
where 1 is the most important You’re using the CBG, to support your OIN: __Volume (amount of data): dealing with large scales of data within data processing (e.g., Global Supply Chains, Global Financial Analysis, Large Hadron Collider). __Velocity (speed of data): dealing with streams of high frequency of incoming real-time data (e.g., Sensors, Pervasive Environments, Electronic Trading, Internet of Things). __Variety (range of data types/sources): dealing with data using differing syntactic formats (e.g., Spreadsheets, XML, DBMS), schemas, and meanings (e.g., Enterprise Data Integration). The V’s of big data challenge the fundamentals of existing technical approaches and require new forms of data processing to enable enhanced decision-making, insight discovery, and process optimization. |
|
| (30) PBGD | 68.- The application of BGD is based on decisions about the measure of remarkable improvement and performance of the PBGD | Parmented (2010); Lichtenthaler (2015); Chien-Tzu & Wan-Fen (2014) |
Source: Author’s own elaboration.
In the quantitative stage of this research the calculus of Pearson’s correlation was involved, in order to get how the main factors were interacting (Table 5).
Table 5 Pearson’s Correlation Coefficient
| KMG | OBM | IEC | BGD | ||
|---|---|---|---|---|---|
| Pearson’s
Correlation Coefficient |
KMG | 1 | 0.841** | 0.750** | 0.488** |
| OBM | 0.841** | 1 | 0.322** | 0.300** | |
| IEC | 0.750** | 0.322** | 1 | 0.280** | |
| BGD | 0.488** | 0.300** | 0.280** | 1 |
** Sig. Correlation in 0.01
Source: SPSS 20 as a research result.
Therefore, the scale of the model was designed. About the reliability and validity of the measurement scales, the Confirmatory Factor Analysis was used by means of the maximum likelihood method with the EQS 6.2 software (Byrne, 2006). The Cronbach’s alpha and the Composite Reliability Index (CRI) (Bagozzi & Yi, 1988) were used as techniques to prove the reliability of the measurement scale where all the values exceeded the recommended value of 0.7 for both measurements, which indicates that there is enough evidence and it justifies internal reliability of the scales (Hair, Anderson, Tatham & Black, 2014; Nunnally & Bernestein, 1994).
In fact, other methods of estimation were used when it was assumed that the normality was present. In this sense, the suggestions from Chou, Bentler & Satorra (1991) and Hu, Bentler & Kano (1992) were followed by the correction of the statistics, such as the robust statistics (Satorra & Bentler, 1988) used to provide a better evidence of the statistical adjustments. The settings used in this study were the Normed Fit Index (NFI), the Non-Normed Fit Index (NNFI), the Comparative Fit Index (CFI) and the Root Mean Square Error of Approximation (RMSEA) (Byrne, 2006; Hair et al., 2014). Values of NFI, NNFI, and CFI between 0.80 > = and < = 0.89 represent a reasonable fit (Segars & Grover, 1993) and > = 0.90 represents an evidence of a good fit of the theoretical model (Byrne, 2006). RMSEA < 0.08 was acceptable (Hair et al., 2014). This part of the confirmatory factor analysis results is shown at the bottom of Table 7 and it suggests that the theoretical model provides a good fit of data.
As evidence of the convergent validity, the results from the confirmatory factor analysis indicate that all the items of the related factors are significant (p < 0.001), the size of all the standardized factorial loads are superior to 0.60 (Bagozzi & Yi, 1988) and the average of the standardized factorial loads of every factor exceed without any problems the value of 0.70 (Hair et al., 1995). Finally, the Average Variance Extracted (AVE) was calculated for each pair of constructs, which results in an AVE > = 0.50 recommended by Fornell & Larcker (1981). The confirmatory factor analysis results are shown at the top of Table 6.
Table 6 Internal consistency and convergent validity evidence of the theoretical model
| Factor | Variable | Factorial loadings > 0.6 (a) | Robust t Value | Loading Average | Cronbach’s Alpha > = 0.7 (b) | Composite Reliability (CRI) > =0.7 (b) | Average Variance Extracted > = 0.5 (c) |
|---|---|---|---|---|---|---|---|
| KMG | LSP | 0.677*** | 1.000a | 0.727 | 0.723 | 0.730 | 0.623 |
| T&M | 0.882*** | 13.339 | |||||
| P&S | 0.616*** | 7.022 | |||||
| COM | 0.668*** | 7.011 | |||||
| INC | 0.699*** | 6.999 | |||||
| KC&A | 0.870*** | 13.012 | |||||
| PKMG | 0.678*** | 7.111 | |||||
| OBM | OIO | 0.662*** | 1.000a | 0.739 | 0.755 | 0.718 | 0.688 |
| MKS | 0.872*** | 17.000 | |||||
| VP | 0.880*** | 18.010 | |||||
| CRM | 0.970*** | 23.076 | |||||
| CHN | 0.899*** | 21.023 | |||||
| RIPR | 0.671*** | 6.978 | |||||
| KYR | 0.644*** | 7.001 | |||||
| KYA | 0.660*** | 7.223 | |||||
| CST | 0.675*** | 8.324 | |||||
| PTS | 0.681*** | 6.123 | |||||
| STR | 0.689*** | 6.345 | |||||
| TEC | 0.813*** | 14.987 | |||||
| NEW | 0.610*** | 6.328 | |||||
| POBM | 0.632*** | 6.476 | |||||
| IEC | RSK | 0.882*** | 1.000a | 0.709 | 0.725 | 0.720 | 0.664 |
| OIEC | 0.719*** | 8.010 | |||||
| TIEC | 0.640*** | 6.999 | |||||
| GOV | 0.631*** | 7.899 | |||||
| PIEC | 0.674*** | 7.432 | |||||
| BGD | BVC | 0.698*** | 1.000a | 0.700 | 0.715 | 0.719 | 0.702 |
| DTQ | 0.710*** | 19.234 | |||||
| CBG | 0.705*** | 22.221 | |||||
| PBGD | 0.689*** | 17.234 | |||||
| Results: S-BX² =
563.604; df = 213; p < 0.000; NFI =
0.815; NNFI = 0.839; CFI = 0.848; RMSEA = 0.075 Conclusion: These values indicate that there is enough evidence of convergent validity and reliability, which justifies the internal reliability of the scales (Hair et al., 2014; Nunnally & Bernstein, 1994). (Nunnally & Bernstein, 1994; Hair et al., 2014). | |||||||
Notes: a. Parameters constrained to the value in the identification process; *** = p < 0.001, (Bagozzi & Yi, 1988), b. According to Hair et al. (2014) and Bagozzi & Yi (1998), c. AVE according to Fornell & Larcker (1981).
Source: Author’s own elaboration.
Regarding the discriminating validity of the theoretical model, the evidence is shown in Table 7.
Table 7 Discriminant validity measuring of the theoretical model
| Variable | KMG | OBM | IEC | BGD |
|---|---|---|---|---|
| KMG | 0.623 | 0.080 | 0.056 | 0.019 |
| OBMS | 0.240-0.346 | 0.688 | 0.086 | 0.030 |
| IEC | 0.190-0.295 | 0.235-0.330 | 0.664 | 0.098 |
| BGD | 0.092-0.204 | 0.093-0.105 | 0.224-0.388 | 0.702 |
Note: The diagonal represents the AVE, whereas above the diagonal part, the variance is presented (the correlation squared). Below the diagonal, it is shown the correlation estimation of the factors with a confidence interval of 95%.
Source: Author’s own elaboration
From Table 7:
a. It can be seen the confidence interval test (Anderson & Gerbing, 1988), which establishes that, with an interval of 95% of reliability, none of the individual elements of the latent factors of the correlation matrix has the value of 1.0.
b. It can be seen the extracted variance test (Fornell & Larcker, 1981) which indicates that the variance extracted between each pair of constructs is not higher than their corresponding AVE. Therefore, according to the results obtained from both tests, it is concluded that both measurements show enough evidence of discriminating validity from the theoretical model.
Results
In order to prove the hypotheses presented in the theoretical model, we applied the confirmatory factor analysis by means of structural equations modeling with the EQS 6.2 software (Byrne, 2006). Hence, the nomological validity of the theoretical model was examined through the Chi-square test, which compares the results obtained between the theoretical model and the measurement model. Such results indicate that the differences between both models are not significant, this can offer an explanation of the relationships observed among the latent constructs (Hatcher, 1994) (Table 8).
Table 8 Structural equation modeling results from the theoretical model
| Hypotheses | Path | Standardized path Coefficients | Robust t Value |
|---|---|---|---|
| H1.- The higher the level of BGD, the higher the level of KMG in OIN of ITSMZG. The model has a significant positive effect. | BGD→KMG | 0.699*** | 5.229 |
| H2.- The higher the level of BGD, the higher the level of OBM in OIN of ITSMZG. The model has a significant positive effect. | BGD→OBM | 0.856*** | 4.987 |
| H3.- The higher the level of BGD, the higher the level of IEC in OIN of ITSMZG. The model has a significant positive effect. | BGD→IEC | 0.754*** | 7.417 |
| H4.- The higher the level of BGD, the higher the level of OIN of ITSMZG. | BGD→OIN | 0.770*** | 8.087 |
| Results: S-BX² = 636.250; df = 246; p <
0.000; NFI = 0.830; NNFI = 0.850; CFI = 0.809; RMSEA =
0.0065. Note: *** = p < 0.001 Conclusion: The model has a significant positive effect among the Factors. | |||
Source: Author’s own elaboration.
Discussion
The interpretation about the results regarding this work is based on the opinion of 500 specialists of the ITSMZG about: which is the relationship between BGD and OIN?
The answer to this main question leads us to know how the main factors of BGD are influencing the OIN process to identify the weak relationships and to make suggestions about reinforcement of such relationships proposed, for the improvement of the model. This is accomplished when:
1. The SQ1: Are there differences between the academic and expert visions between OIN and BGD concepts? There were important differences identified from Table 3, the column %Difference (academic vision-expert vision), where the positive and negative values related with both visions are shown. These differences represent how the variables are considered for each part; positive values tell that the academic vision addresses these topics more often than experts expect; the negative values are the opposite. Therefore, the highlighted issues were the gap (considering the magnitudes only) of all the values with more than 3%. For instance, there are variables at OIN, such as: CHN (-3.44), PTS (4.28), STR (3.32), and OIEC (5.45); or even more the BGD: BVC (-5), DTQ (-15), CBG (5), and PBGD (15). All mentioned above is considered as a great opportunity to do more contributions for each vision.
2. The SQ2: How to analyze open innovation collaboration in terms of their boundaries, leverage, scope, structure, and dynamics? Based on our model, the OIN collaboration depends on the IEC factor. Hence:
3. The SQ3: What are novel ways of examining the interdependency and co-evolution in the open innovation context (big data-driven approaches)? Based on our model, the interdependency and co-evolution in the open innovation context is based on the BGD variable, hence:
a. From Table 5, it is necessary to improve the direct relationships between BGD-KMG (0.488), BGD-OBM (0.300), and BGD-IEC (0.280).
b. From Table 6, it is necessary to improve the underlying relationships between the variables in the lowest factorial loadings (< 0.7), such as BVC (0.698) and PBGD (0.689).
4. On the other hand, the fourth hypotheses (Table 8):
H1. The higher the level of BGD, the higher the level of KMG in OIN of ITSMZG.
H2. The higher the level of BGD, the higher the level of OBM in OIN of ITSMZG.
H3. The higher the level of BGD, the higher the level of IEC in OIN of ITSMZG.
H4. The higher the level of BGD, the higher the level of OIN of ITSMZG.
proving that each one of them has a significant positive effect.
Conclusion
Therefore, the highlighted aspects obtained from the research were:
1. The differences between the academic and expert visions about factors and variables, involved in the model (Table 3), require a gap reduction between them, to do more accurate suggestions in the relationships’ improvement of the model.
2. The analysis of open innovation collaboration in terms of their boundaries, leverage, scope, structure, and dynamics is explained when it is realized that the relationships with IEC-BGD and IEC-OBM (Table 5) are necessary to improve. This is because the first two relationships are still a novelty in the ITSZMG. In this sense, the underlying relationships among the variables show the same situation of novelty in the concepts, such are: TIEC, GOV, and PIEC (Table 6). They represent a great chance to improve.
3. The novel ways of examining the interdependency and co-evolution in the open innovation context (big data-driven approaches) are explained when the chances to increase the direct relationships between BGD-IEC, BGD-OBM, and BGD-KMG are seen (Table 5). In the sense of underlying relationships, it is necessary to improve BVC and PBGD Table 6)
1. A final model (Figure 1) and a final questionnaire (Table 4) describing the OIN factor by means of KMG factor (7 variables), OBM factor (14 variables), IEC factor (5 variables), and BGD factor (4 variables) were obtained.
2. The first proposal of the model is considered enough to be adapted and applied due to its capability to measure the relationships properly between the main factors and the variables of BGD and OIN for the ITSZMG.
3. As a final contribution, this empirical model could be adapted, implemented, and measured in other regions in Mexico (or even more, in other countries), following the fulfillment of the requirements:
-A real interest from the sectors (not only the Information Technologies) to get an outstanding improvement of their own performance. This can be possible if they review their own capabilities and resources in order to verify how they are in the main factors of OIN such as KMG, OBM, IEC, and BGD.
-An advantage of this proposal is the huge number of indicators (30 variables/68 indicators) that must be considered in accordance with the needs of any sector. However, if this sector is not aware of its own resources and capabilities, it will be very difficult to fulfill it. For instance, even though Mexico has an important telecommunications infrastructure, not all the states have the same infrastructure quality.
-This model obeys to both academic vision and expert vision but in a common area, the business. However, in cases such as Mexico (and other emerging countries), government intervention (in taxes, policies, commercial rules, etc.) is another determinant factor to be considered in other complementary or future studies, beyond the limits of this study.

