


 nueva página del texto (beta)
 Inglés (pdf)
 Artículo en XML
 Referencias del artículo
 Enviar artículo por email
 Citado por SciELO
  Similares en
SciELO
Similares en
SciELO 
 Permalink
Introduction
Over the past decade, several countries have promoted the integration of Information and Communication Technologies (ICT) in the education system (Padilla-Meléndez, Del Águila-Obra & Garrido-Moreno, 2014). As many different sectors are growing because of the effects of globalization, education has been evolving in different ways (Arteaga-Sánchez, Cortijo & Javed, 2014; Baturay, Gökçearslan & Ke, 2017; van Raaij & Schepers, 2008). One particular interest is the growing number of students who fully enroll to online courses (Digital Learning Compass, 2017). In Mexico, virtual education, also known as online or e-learning, has reported a large growth in the field of higher education, from 32 000 students in 1981 to up to 467 552 in 2014, including mixed and online education (Zubieta-García & Rama-Vilate, 2015). In this context, the integration of learning technology and applications is a key factor for these new generations of students.
Virtual Learning Environments (VLE) provide a technological platform for developing and delivering courses regardless of time or location via the internet. This complements traditional, face-to-face education and transforms it into blended learning (Garrison & Kanuka, 2004; McComas, 2014), or VLE is only used for online courses and for online learning (Moore & Kearsley, 2011). Since VLE-based courses are always available online, they offer diverse advantages (Garrison, 2011). For instance, students have the opportunity to study at their own pace (Moskal, Dziuban & Hartman, 2013; Richardson & Swan, 2003); they also have access to more information or multiple representations about definitions, concepts or topics related with the course (Mayer, 2009; Paivio, 2014); VLE allows file exchange between students and instructors, the ability to schedule educational activities and monitor the progress of students of a course. Notably, Richardson & Swan (2003), Galey (2014), and Porter, Graham, Spring & Welch (2014) add two advantages that could be the most important: the first one is that VLE are location-independent, which means that students do not need to move from one place to another in order to attend courses, so they save time; the second one refers that, unlike traditional courses, VLE allows students to reflect about learning materials and their responses before posting comments or answers on forums. For these reasons, VLE are widely used in education (Codreanu, Michel, Bobillier-Chaumon & Vigneau, 2017). Salmerón-Pérez, Rodríguez-Fernández & Gutiérrez-Braojos (2010) state that the use of virtual platforms improves collaborative and cooperative learning regardless of the educational level of students.
However, according to Galey (2014), VLE also has disadvantages. According to Evans (2013), some critics argue that online education is not as effective as traditional classroom education, because it lacks face-to-face interaction, and others mention that all participants involved in online education must make a stronger effort than in traditional courses in order to build a good relationship and maintain focus on class topics. Rabe-Hemp, Woollen & Humiston (2009) claim that students favor face-to-face interactions when discussing class topics. In addition, Tuckman (2007) states that the lack of supervision on students often leads to excessive online procrastination and reduced performance, because many of them treat the opportunity for self-pacing as an opportunity to procrastinate. Furthermore, the fact that not all students have internet at home represents an inequality (Codreanu et al., 2017).
As in any learning environment, in VLE students are the primary participants. Nowadays, VLE are an important tool that in the right hands can support the teaching-learning process (Codreanu et al., 2017; Pituch & Lee, 2006).
VLE characteristics
According to Moore, Dickson-Deane & Galyen (2011), there is disagreement among researchers about common definitions and terminology on topics related with VLE. This makes it difficult not only to perform meaningful cross-study comparisons but also to bring a standardized taxonomy of VLE. In fact, these authors explained that VLE can be found in the literature as different types of learning environments, such as learning management system (LMS), course management system (CMS) or knowledge management system (KMS).
According to Govindasamy (2001), there are seven quality parameters that VLE need in order to success: instructional design, course development, teaching and learning process, course structure, student support, faculty or school support, and evaluation and assessment. These seven benchmarks are only related to the pedagogical part. However, after a systematic literature review, Mueller & Strohmeier (2011) expose the following characteristics in two different sets:
System-related: communicativeness, feedback, media synchronicity, flexibility, perceived quality, perceived usability, interface design, reliability, adaptability, system quality, user adaptation, and user tools.
Information-related: course attributes, course quality, format, information quality, information relevance, and terminology.
As can be seen, these two sets do not only contain pedagogical foundations but also technical aspects.
Problem Statement
Although VLE is an evolving area of research, which is receiving more attention every day, Liaw, Huang & Chen (2007) and Paechter, Maier & Macher, (2010) claim that there is minimal research on students’ experience and attitudes toward VLE. Therefore, there is a need to quantify the acceptance of VLE by students. Technology acceptance is a set of quality attributes that measure the relationships that exist between usefulness, ease of use and system use (Davis, 1989). In this way, there is some research about validated measuring instruments applied to gauge the technology acceptance of VLE. Šumak, Polancic & Hericko (2010) conducted an online survey with undergraduate students (n = 235) to understand their perception about the use of Moodle; their instrument was based on the unified theory of acceptance and use of technology (UTAUT) (Venkatesh, Morris, Davis & Davis, 2003). Sánchez & Hueros (2010) surveyed 226 students, using the technology acceptance model (TAM) (Davis, 1989) in order to improve their understanding of the motivational factors behind students’ level of satisfaction with Moodle. Lin, Persada & Nadlifatin (2014) tried to examine the students’ acceptance of Blackboard Learning System use, by employing TAM as an analysis approach; they conducted an online questionnaire, extracting information from a total of 302 respondents. It is evident that models and theories such as the widely-used TAM and the UTAUT have been proposed and applied, but they do not address technology acceptance of factors such as communication, design, usability, general aspects, and reliability in a mixed fashion.
On the other hand, there is a concern about statistical analysis to validate technology acceptance instruments such as questionnaires. It is possible to use the Cronbach’s alpha, which, according to Tavakol & Dennick (2011), it measures reliability, but not validity, of instruments. These two concepts are closely associated. Furthermore, Malhotra (1997) explains that the value of this coefficient tends to increase when more items are added to the instrument; this explains why the coefficient can be inflated. Cronbach’s alpha shows internal consistency but does not indicate the degree of correlation of the items that make up a construct (Tavakol & Dennick, 2011).
In this context, it is important to point out that some studies have not been particularly concerned with the operationalization of the acceptance of VLE constructs, since they do not fully report the psychometric properties (internal consistency, statistical exploration or confirmation of the instruments) of the instrument measuring the acceptance of VLE (DeVellis, 2003). Since the psychometric properties are missed, this raises questions about the validity of these studies’ outcomes. Considering that a robust operationalization is equally important with a robust theorization of the construct under study (DeVellis, 2016), this paper thoroughly portrays the development and validation of the acceptance of VLE based on Moodle.
The aim of this paper is to present the validation of an instrument to assess the acceptance of the VLE Moodle. The validated instrument was created by Ruiz & Romero (2008) and consists of five factors: communication, design, usability, general aspects, and reliability, with 15 items (Table 1). It is hypothesized that the technology acceptance of a VLE based on Moodle will be valid and reliable to measure and, consequently, the instrument will provide dependable information about the technology acceptance of a VLE system. Therefore, this study was used to evaluate the validity of the instrument, using a confirmatory factor analysis (CFA) and a data set obtained through the responses of a sample of students from the University of Colima in Mexico, to the mentioned instrument.
Table 1 Latent factors and items used for measuring the acceptance of VLE with Moodle.
| Latent Factors | Observed Variable | Statement |
|---|---|---|
| Communication (CM) | MFCTS | I believe Moodle facilitates communication among teachers and students. |
| MFCBS | I believe Moodle facilitates communication among students. | |
| UMCL | I believe the use of tools such as Moodle enhance communication and learning. | |
| Design (DE) | DCA | The courses design is appropriate. |
| UCA | Color use is acceptable. | |
| OIA | The information organization is acceptable. | |
| Usability (US) | NTDMS | Overall, I consider that navigation through the different sections of a course in Moodle is simple. |
| EFICM | I believe it is easy to find information within a course in Moodle. | |
| ITCUHL | The Moodle interface is comfortable to use and easy to learn. | |
| General aspects (GA) | UMSS | Overall, I think the use of Moodle in the courses has been satisfactory. |
| IWUMFT | I would like to continue using Moodle at the School of Telematics. | |
| IWUMAS | I would like to use Moodle in all courses. | |
| Reliability (RE) | CWPLQ | The course web pages are fast to load. |
| TPUCAQ | I have not had any technical problems uploading files to the course or answering questionnaires. | |
| VSMCA | The Moodle server has always been available. |
Source: Author’s own elaboration.
Data and Methods
Instrument and data collection
This research was conducted at the School of Telematics of the University of Colima, Mexico. At the time of the data collection, the student population of the School of Telematics was 469 students. The sample used in this study was one hundred students selected randomly from the student population of the School of Telematics. The sample of 100 subjects in this study may seem small, but earlier studies in the field of technology adoption have shown that with smaller or similar samples good results can still be obtained (Caine, 2016; van Raaij & Schepers, 2008).
The questionnaire consisted of fifteen indicators and five latent factors measured on a 5-point Likert scale (1 = strongly disagree, 2 = disagree, 3 = neither agree nor disagree, 4 = agree, 5 = strongly agree). Therefore, the analysis was done through a categorical ordinal approach. Table 1 shows the dimensions and items of the instrument used for measuring the acceptance of VLE with Moodle.
According to the literature reviewed, a hypothesized linked relationship is proposed, using CFA between the 15 indicators and the five underlying factors, as shown in Figure 1. The first loading of each factor has been fixed at 1 for identification. Correlated factors are admissible for this model. Since there were five factors, it was possible to establish 10 correlations or covariances. In this case, the number of observations was greater than the number of parameters; for that reason, the model is considered as over-identified. Fifteen indicators yielded 15 (15+1)⁄2=120 number of observations. There were 85 parameters to be estimated; these parameters were 10 loadings, five factor variances, 60 thresholds, and 10 covariances among factors.

Source: Author’s own elaboration.
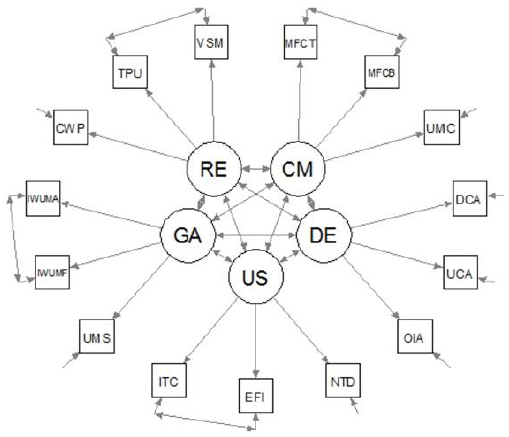
Figure 1 A path diagram of CFA representing the factors structure of the acceptance of VLE with Moodle.
Figure 1 is a schematic drawing that represents a concise overview of the hypothesized model to be fit. It includes the 15 observed items (represented by square boxes) and the latent variables (represented by five circles), with arrows that illustrate the (hypothesized) relationships among the items. A direct effect of one item on another is represented by a single-headed arrow, while (unexplained) correlations between latent variables and items are represented by double-headed arrows. Also, it is important to point out that all the indicators are assumed as independent of each other since there are no double-headed arrows between indicators.
Construct validation and analysis
Validity refers to the extent to which an instrument measures what it is intended to measure (Kimberlin & Winterstein, 2008). On the other hand, construct validation pertains to the parallel process of measurement and theory validation (Strauss & Smith, 2009). According to Heilman & Brusa (2006), it establishes that a measure appropriately operationalizes its underlying construct. In this sense, exploratory factor analysis (EFA) and CFA are frequently used methods for construct validation (Boelen, van den Hout & van den Bout, 2008). EFA is commonly used to confirm construct validity in cases where the relationships among variables are unknown or ambiguous, while CFA is properly applied when the researcher has some knowledge of the theory, empirical research, or both, and it postulates relations between the observed measures and the underlying factors a priori and, then, test this hypothesized structure statistically (Byrne, 2012). CFA and EFA are commonly used by researchers. Both statistical techniques are used in order to reduce the overall number of observed variables into latent factors, based on commonalities within the data (McArdle, 1996). CFA is also regularly used to compare the factor structure of different groups, for example, different types of schools like private or public. By using CFA, researchers who want to validate their instruments add a level of statistical precision (Atkinson et al., 2011).
For this reason, the statistical technique used to assess the construct validity of the hypothetical model given in Figure 1 was CFA (Kline, 2011). CFA seeks to determine whether the number of factors and the loading of measured (items) variables conform to what is expected in the model given in Figure 1, based on a pre-established theory. The factors or latent constructs are assumed to cause the observed scores in the indicators (Kismiantini, Montesinos-López, García-Martínez & Franco-Pérez, 2014). By using Chi-Square, the evaluation of the goodness-of-fit of the proposed model with CFA was done. A non-significant Chi-Square is an indication of a good fit. Nevertheless, it is difficult to get a good fit when samples are well over 200 (Newsom, 2012). The Chi-Square test is more sensitive with larger sample sizes. Hence, it is important to report three additional indices (Hu & Bentler, 1999): 1) the comparative fit index (CFI) evaluates the fit of the model relative to another baseline model (Kismiantini et al., 2014) and, according to Yu & Muthen (2002), the criteria for a good CFI is a value >0.96 to a maximum of 1; 2) the root mean square error of approximation (RMSEA) shows how a model does not fit compared to a perfect model (Kismiantini et al., 2014). The criterium for a good model is a value <0.06 (Browne & Cudeck, 1993); and 3) the weighted root mean square (WRMR) assesses average weighted residuals, which range from 0 to 1 (Kismiantini et al., 2014). Yu & Muthen (2002) explain that values close to 1 are indicators of a good fit. In this research, for scaling and statistical identification purposes, the factor loading of one indicator in each sub-factor is set to 1. The implementation of all CFA was done in MPLUS version 6.11.
Since the item responses are categorical, it is not appropriate to base the CFA on the Pearson sample variance-covariance matrix, because the Pearson correlation coefficients are higher when computed between two continuous variables than when computed between the same two variables, restructured with an ordered categorical scale. For this reason, this paper is based on the polychoric correlation matrix given in Table 2, by using the weighted least squares means and variance adjusted (WLSMV) estimation method with probit link to get the appropriate parameter estimates of the ordered categorical variables. The polychoric correlation matrix is the correct correlation matrix when the variables are ordinal categorical.
Table 2 Proportions and counts of categorical variables.
| Proportion of each category | Count of each category | ||||||||||
|---|---|---|---|---|---|---|---|---|---|---|---|
| Factor | Item | 1 | 2 | 3 | 4 | 5 | 1 | 2 | 3 | 4 | 5 |
| CM | MFCTS | 0.04 | 0.03 | 0.13 | 0.5 | 0.3 | 4 | 3 | 13 | 50 | 30 |
| MFCBS | 0.07 | 0.14 | 0.37 | 0.32 | 0.1 | 7 | 14 | 37 | 32 | 10 | |
| UMCL | 0.01 | 0.03 | 0.19 | 0.51 | 0.26 | 1 | 3 | 19 | 51 | 26 | |
| DE | DCA | 0.02 | 0.06 | 0.18 | 0.5 | 0.24 | 2 | 6 | 18 | 50 | 24 |
| UCA | 0.04 | 0.06 | 0.19 | 0.41 | 0.3 | 4 | 6 | 19 | 41 | 30 | |
| OIA | 0.03 | 0.09 | 0.11 | 0.47 | 0.3 | 3 | 9 | 11 | 47 | 30 | |
| US | NTDMS | 0.03 | 0.06 | 0.14 | 0.38 | 0.39 | 3 | 6 | 14 | 38 | 39 |
| EFICM | 0.02 | 0.03 | 0.2 | 0.4 | 0.35 | 2 | 3 | 20 | 40 | 35 | |
| ITCUHL | 0.03 | 0.04 | 0.14 | 0.43 | 0.36 | 3 | 4 | 14 | 43 | 36 | |
| GA | UMSS | 0.03 | 0.03 | 0.13 | 0.51 | 0.3 | 3 | 3 | 13 | 51 | 30 |
| IWUMFT | 0.01 | 0.05 | 0.2 | 0.26 | 0.48 | 1 | 5 | 20 | 26 | 48 | |
| IWUMAS | 0.05 | 0.08 | 0.26 | 0.26 | 0.35 | 5 | 8 | 26 | 26 | 35 | |
| RE | CWPLQ | 0.04 | 0.1 | 0.17 | 0.47 | 0.22 | 4 | 10 | 17 | 47 | 22 |
| TPUCAQ | 0.09 | 0.24 | 0.13 | 0.24 | 0.3 | 9 | 24 | 13 | 24 | 30 | |
| VSMCA | 0.05 | 0.21 | 0.28 | 0.2 | 0.26 | 5 | 21 | 28 | 20 | 26 | |
Source: Author’s own elaboration.
Results and Discussion
Table 2 shows the proportions and counts for each item. As it can be seen in Table 2, the item distribution is highly skewed to categories 4 (agree) and 5 (strongly agree). This indicates relatively high levels of satisfaction with the use of Moodle as a VLE. The exception is the items for the factor PU which show low proportions in categories 4 and 5.
Confirmatory Factor Analysis
In this phase, it was attempted to fit the hypothesized model given in Figure 1 with a CFA. Since the latent factors of the technology acceptance of VLE are continuous variables and the indicators are categorical variables, therefore, this CFA is also known as item response theory (Kismiantini et al., 2014). The data was fitted by two parameters: logistic for polytomous responses (5 category) using WLSMV estimation with probit link. The overall fit of the model was reasonable, since χ_((80))^2=156.32, p<0.0001, the RMSEA was 0.098>0.08 with a 90% confidence interval between 0.075 and 0.120, the CFI was 0.979 > 0.96, and the WRMR was 0.732 close to 1. However, since the RMSEA was not satisfied (>0.08), the model given in Figure 2 was proposed, which is slightly different than the model shown in Figure 1, because this new hypothesized model assumed dependence among some indicators and fixed some threshold parameters that were not significant.
Source: Author’s own elaboration.
Figure 2 Adjusted path diagram of CFA representing the factors structure of the technology acceptance of VLE with Moodle.
Again, using CFA (under an item response theory model with two parameters logistic for polytomous responses with probit link and with a WLSMV estimation method), the hypothesized model given in Figure 2 is fitted. The overall fit of the model was improved and deemed satisfactory, χ_((80))^2=105.180, p<0.0001, the RMSEA was 0.056<0.08 with a 90% confidence interval between 0.018 and 0.084, the CFI was 0.993>0.96, and the WRMR was 0.56 close to 1. Under this model, the number of estimated parameters was 85 as well (10 loadings, five factor variances, 56 thresholds, 10 covariances between factors, and four covariances between the following indicators: MFCTS with MFCBS; EFICM with ITCUHL; IWUMFT with IWUMAS; TPUCAQ with VSMCA).
In Table 3 and Table 4 it can be seen that all the indicators, variances, covariances, and thresholds are statistically significant (p-value<0.0001) with exception of Var(US) and Var(RE) with p-values of 0.127 and 0.205, respectively. In addition, it is relevant to point out that all the correlations between the latent factors are larger than 0.48, while the correlations among the indicators with dependence are larger than 0.40.
Table 3 Estimates for the CFA model of the technology acceptance of VLE with Moodle (correlations and covariances).
| Standardized | Unstandardized | ||||
|---|---|---|---|---|---|
| Item | Estimate | Estimate | S.E. | p-value | |
| CM | MFCTS | 0.876 | 1 | 0 | - |
| MFCBS | 0.568 | 0.38 | 0.089 | <0.001 | |
| UMCL | 0.847 | 0.877 | 0.173 | <0.001 | |
| DE | DCA | 0.877 | 1 | 0 | - |
| UCA | 0.856 | 0.909 | 0.152 | <0.001 | |
| OIA | 0.856 | 0.91 | 0.155 | <0.001 | |
| US | NTDMS | 0.968 | 1 | 0 | - |
| EFICM | 0.893 | 0.512 | 0.197 | 0.009 | |
| ITCUHL | 0.867 | 0.447 | 0.157 | 0.004 | |
| GA | UMSS | 0.907 | 1 | 0 | - |
| IWUMFT | 0.844 | 0.734 | 0.145 | <0.001 | |
| IWUMAS | 0.692 | 0.447 | 0.095 | <0.001 | |
| RE | CWPLQ | 0.912 | 1 | 0 | - |
| TPUCAQ | 0.596 | 0.335 | 0.166 | 0.044 | |
| VSMCA | 0.797 | 0.596 | 0.282 | 0.035 | |
| Covariances | Corr | Cov | S.E. | p-value | |
| DE with CM | 0.948 | 3.132 | 0.782 | <0.001 | |
| US with CM | 0.874 | 6.159 | 2.399 | 0.01 | |
| US with DE | 0.906 | 6.415 | 2.45 | 0.009 | |
| GA with CM | 0.995 | 3.873 | 1.115 | 0.001 | |
| GA with DO | 0.934 | 3.653 | 0.988 | <0.001 | |
| GA with US | 0.897 | 7.484 | 2.99 | 0.012 | |
| RE with CM | 0.612 | 2.461 | 1.069 | 0.021 | |
| RE with DE | 0.677 | 2.737 | 1.134 | 0.016 | |
| RE with US | 0.489 | 4.212 | 2.248 | 0.061 | |
| RE with GA | 0.651 | 3.101 | 1.41 | 0.028 | |
| MFCTS with MFCBS | 0.332 | 0.332 | 0.135 | 0.014 | |
| EFICM with ITCUHL | 0.405 | 0.405 | 0.11 | <0.001 | |
| IWUMFT with IWUMAS | 0.585 | 0.585 | 0.065 | <0.001 | |
| TPUCAQ with VSMCA | 0.592 | 0.592 | 0.101 | <0.001 | |
| Var(CM) | 1 | 3.286 | 1.21 | 0.007 | |
| Var(DE) | 1 | 3.321 | 0.941 | <0.001 | |
| Var(US) | 1 | 15.108 | 9.893 | 0.127 | |
| Var(GA) | 1 | 4.61 | 1.716 | 0.007 | |
| Var(RE) | 1 | 4.917 | 3.881 | 0.205 |
Source: Author’s own elaboration.
Table 4 Estimates for the CFA model of the technology acceptance of VLE with Moodle (thresholds).
| Unstandardized thresholds estimates | |||||||
|---|---|---|---|---|---|---|---|
| Thresholds | Estimate | S.E. | p-value | Thresholds | Estimate | S.E. | p-value |
| MFCTS$1 | -3.625 | 0.585 | <0.001 | ITCUHL$3 | -1.617 | 0.32 | <0.001 |
| MFCTS$2 | -3.055 | 0.488 | <0.001 | ITCUHL$4 | 0.719 | 0.249 | 0.004 |
| MFCTS$3 | -1.742 | 0.37 | <0.001 | UMSS$1 | -4.455 | 0.678 | <0.001 |
| MFCTS$4 | 1.086 | 0.278 | <0.001 | UMSS$2 | -3.683 | 0.44 | <0.001 |
| MFCBS$1 | -1.793 | 0.238 | <0.001 | UMSS$3 | -2.079 | 0.449 | <0.001 |
| MFCBS$2 | -0.98 | 0.172 | <0.001 | UMSS$4 | 1.242 | 0.323 | <0.001 |
| MFCBS$3 | 0 | 0 | - | IWUMFT$1 | -4.343 | 0.706 | <0.001 |
| MFCBS$4 | 1.557 | 0.212 | <0.001 | IWUMFT$2 | -2.903 | 0.386 | <0.001 |
| UMCL$1 | -4.37 | 0.776 | <0.001 | IWUMFT$3 | -1.201 | 0.278 | <0.001 |
| UMCL$2 | -3.289 | 0.492 | <0.001 | IWUMFT$4 | 0 | 0 | - |
| UMCL$3 | -1.388 | 0.305 | <0.001 | IWUMAS$1 | -2.28 | 0.272 | <0.001 |
| UMCL$4 | 1.209 | 0.262 | <0.001 | IWUMAS$2 | -1.561 | 0.219 | <0.001 |
| DCA$1 | -4.269 | 0.649 | <0.001 | IWUMAS$3 | -0.387 | 0.179 | 0.031 |
| DCA$2 | -2.921 | 0.415 | <0.001 | IWUMAS$4 | 0.534 | 0.172 | 0.002 |
| DCA$3 | -1.337 | 0.315 | <0.001 | CWPLQ$1 | -4.259 | 1.263 | 0.001 |
| DCA$4 | 1.468 | 0.274 | <0.001 | CWPLQ$2 | -2.628 | 0.884 | 0.003 |
| UCA$1 | -3.387 | 0.467 | <0.001 | CWPLQ$3 | -1.206 | 0.492 | 0.014 |
| UCA$2 | -2.479 | 0.36 | <0.001 | CWPLQ$4 | 1.878 | 0.635 | 0.003 |
| UCA$3 | -1.071 | 0.277 | <0.001 | TPUCAQ$1 | -1.67 | 0.243 | <0.001 |
| UCA$4 | 1.014 | 0.246 | <0.001 | TPUCAQ$2 | -0.548 | 0.167 | 0.001 |
| OIA$1 | -3.643 | 0.447 | <0.001 | TPUCAQ$3 | 0 | 0 | - |
| OIA$2 | -2.276 | 0.323 | <0.001 | TPUCAQ$4 | 0.653 | 0.16 | <0.001 |
| OIA$3 | -1.431 | 0.297 | <0.001 | VSMCA$1 | -2.725 | 0.424 | <0.001 |
| OIA$4 | 1.016 | 0.249 | <0.001 | VSMCA$2 | -1.066 | 0.242 | <0.001 |
| NTDMS$1 | -7.548 | 2.281 | 0.001 | VSMCA$3 | 0 | 0 | - |
| NTDMS$2 | -5.381 | 1.643 | 0.001 | VSMCA$4 | 1.066 | 0.211 | <0.001 |
| NTDMS$3 | -2.965 | 1.082 | 0.006 | HATOM$1 | -0.994 | 0.151 | <0.001 |
| NTDMS$4 | 1.121 | 0.499 | 0.025 | HATOM$2 | -0.253 | 0.127 | 0.046 |
| EFICM$1 | -4.571 | 0.806 | <0.001 | HATOM$3 | 0.842 | 0.143 | <0.001 |
| EFICM$2 | -3.661 | 0.607 | <0.001 | HATOM$4 | 1.476 | 0.19 | <0.001 |
| EFICM$3 | -1.501 | 0.336 | <0.001 | TPM$1 | -0.385 | 0.129 | 0.003 |
| EFICM$4 | 0.858 | 0.276 | 0.002 | TPM$2 | 0.253 | 0.127 | 0.046 |
| ITCUHL$1 | -3.772 | 0.575 | <0.001 | TPM$3 | 1.476 | 0.19 | <0.001 |
| ITCUHL$2 | -2.96 | 0.439 | <0.001 | TPM$4 | 1.645 | 0.211 | <0.001 |
Source: Author’s own elaboration.
Interpretation of category response curves and item information curves
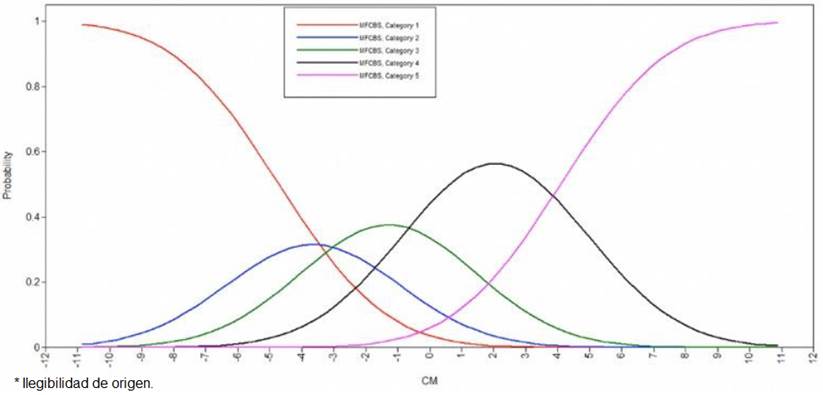
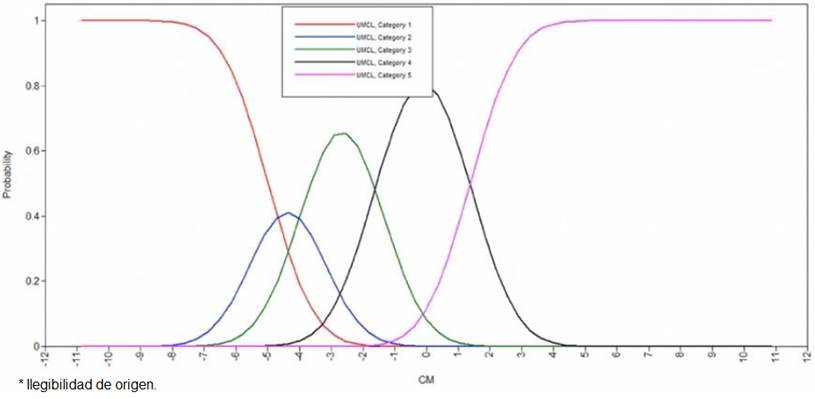
Figures 3, 4, and 5 show the category response curves (CRC) for the three items belonging to factor CM. In general, the CRC would preferably cover a range of values on the latent characteristic. Low peaks indicate low probability of endorsement of a specific category and relatively poor discrimination parameters. For example, the probability of endorsement of category 2 (disagree) in item MFCTS is around 0.22 for students with a latent value around -3.5, whereas category 4 (agree) works better because it covers almost the same range with a higher probability of endorsement that is around 0.8 for students with a latent value around -0.5. Therefore, visually inspecting all such plots for all items, it was decided to merge response categories, removing items with similar properties or items with undesirable properties. In simple words, the CRC are often used to evaluate the need for item and scale reduction (Li & Baser, 2012). It can be seen in Figure 3, 4, and 5 that there is a visible overlap between categories 2 and 3; however, this overlap is not severe. For this reason, it is reasonable to keep the 5-point-Likert scale used in this instrument. The CRC of the other items are not shown but have a similar behavior.
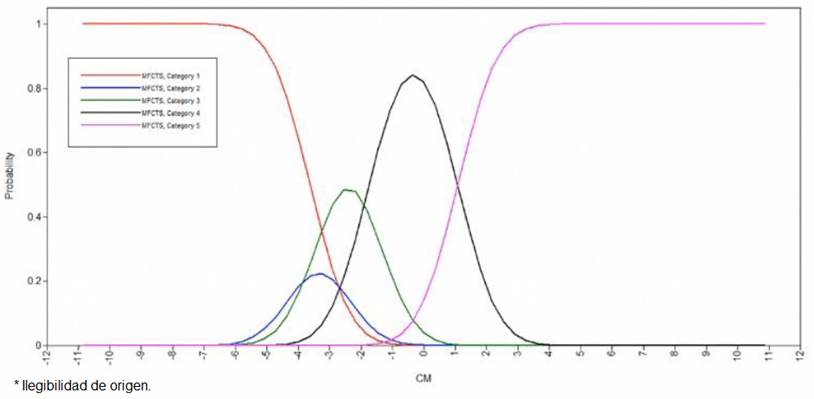
In the section Confirmatory Factor Analysis, it was declared that the fit of the model was appropriate; however, to see the level of certainty about the estimates of the latent continues factors (in this case five latent dimensions are assumed: CM, DE, US, GA, RE), it is inspected the Fisher information of an item over a range of latent values. A higher information means lowers uncertainty for the estimate of the latent values and vice versa (Li & Baser, 2012). Figure 6 plots the item information curves across a range of latent values of factor CM for items MFCTS, MFCBS, and UMCL. Item MFCTS is clearly the most informative item. The next one is UMCL and the item MFCB shows a low information profile.

Source: Author’s own elaboration.
Figure 6 Item information curves for items MFCTS, MFCBS, and UMCL that correspond to factor CM.
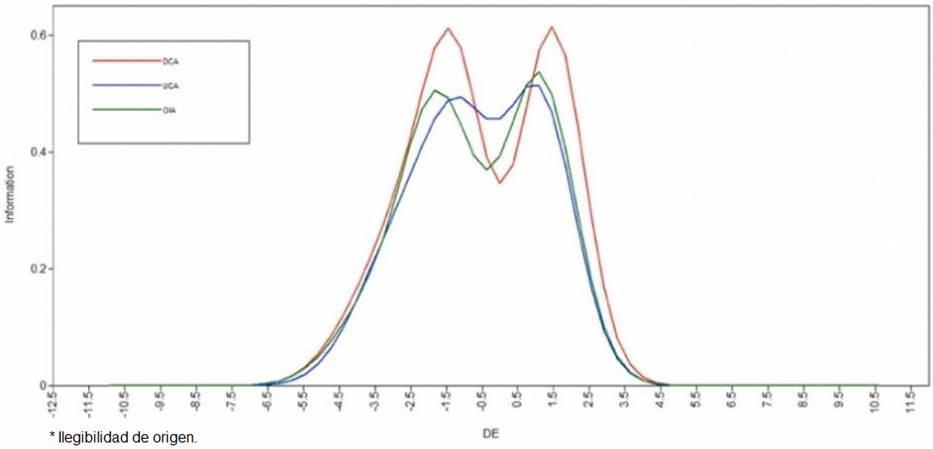
Figure 7 plots the item information curves across a range of latent values of factor DE for items DCA, UCA, and IOA. In this factor the three items showed a similar level of information.
Source: Author’s own elaboration.
Figure 7 Item information curves for items DCA, UCA, and OIA that correspond to factor DE.
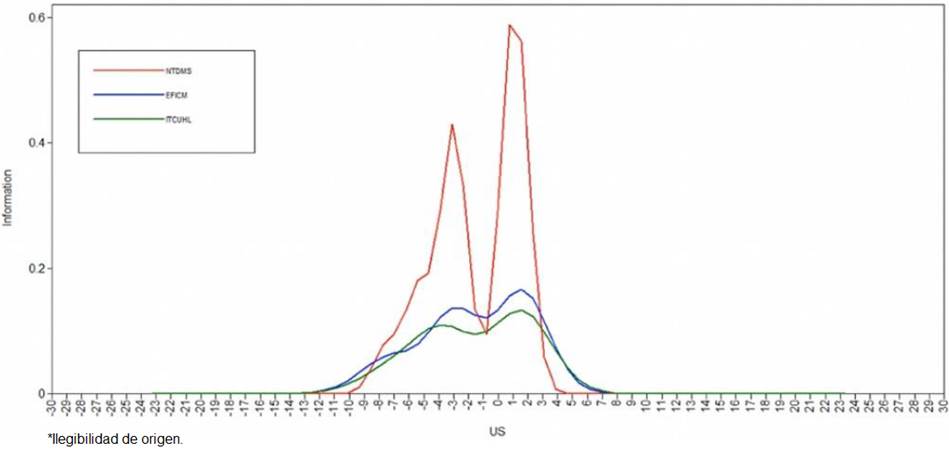
In Figure 8 the item NTDMS appears to be the most informative, while items EFICM and ITCUHL show low levels of information. This implies that these two items do not provide much information to the latent values of factor usability.
Conclusions
To successfully use VLE with Moodle, it is important to assess the technology acceptance because such success depends mostly on the professors, researchers, and educational leaders’ acceptance. For this reason, in this paper, a set of feasible measurement models to examine five factors of technology acceptance of VLE with Moodle have been presented: communication, design, usability, general aspects, and reliability. An ordinal categorical instrument of 15 items and five factors was confirmed to measure the technology acceptance of a VLE with Moodle in a Mexican University.
It is believed that the use of strong statistical techniques is very important when validating these kinds of instruments and their outcomes. This is very important in the education field, because there is a controversy about different assessment topics, especially when it is related with learning technology.
Finally, it is important to point out that more research is required to be able to generalize these results to other technology acceptance instruments used in educational settings and with other group samples from a larger student population. For this reason, the use of the proposed instrument should be taken with caution. The English version of the proposed instrument requires further validation since current findings are based on the Spanish version, and some words may change their meaning in the translation. In addition, it would be very interesting to verify measurement invariance among areas of knowledge within the whole University of Colima.

